Marion County, Ohio
| Marion County, Ohio | |||
|---|---|---|---|
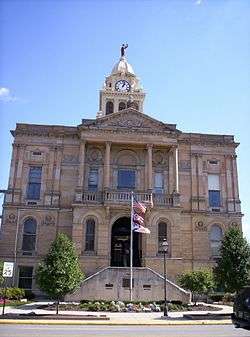 Marion County Courthouse | |||
| |||
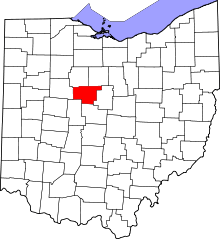 Location in the U.S. state of Ohio | |||
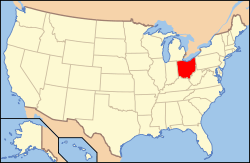 Ohio's location in the U.S. | |||
| Founded | May 1, 1824 | ||
| Named for | Francis Marion | ||
| Seat | Marion | ||
| Largest city | Marion | ||
| Area | |||
| • Total | 404 sq mi (1,046 km2) | ||
| • Land | 404 sq mi (1,046 km2) | ||
| • Water | 0.4 sq mi (1 km2), 0.1% | ||
| Population | |||
| • (2010) | 66,501 | ||
| • Density | 165/sq mi (64/km2) | ||
| Congressional districts | 4th, 12th | ||
| Time zone | Eastern: UTC−5/−4 | ||
| Website |
www | ||


Marion County is a county located in the U.S. state of Ohio. As of the 2010 census, the population was 66,501.[1] Its county seat is Marion.[2] The county was created in 1820 and later organized in 1824.[3] It is named for General Francis "The Swamp Fox" Marion, a South Carolinian officer in the Revolutionary War.[4]
Marion County comprises the Marion, OH Micropolitan Statistical Area, which is also included in the Columbus-Marion-Zanesville, OH Combined Statistical Area.
Geography
According to the U.S. Census Bureau, the county has a total area of 404 square miles (1,050 km2), of which 404 square miles (1,050 km2) is land and 0.4 square miles (1.0 km2) (0.1%) is water.[5] It is the fifth-smallest county in Ohio by total area.
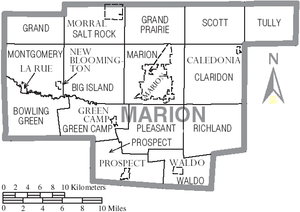
Adjacent counties
- Crawford County (northeast)
- Morrow County (east)
- Delaware County (south)
- Union County (southwest)
- Hardin County (west)
- Wyandot County (northwest)
Major highways
Demographics
| Historical population | |||
|---|---|---|---|
| Census | Pop. | %± | |
| 1830 | 6,551 | — | |
| 1840 | 14,765 | 125.4% | |
| 1850 | 12,618 | −14.5% | |
| 1860 | 15,490 | 22.8% | |
| 1870 | 16,184 | 4.5% | |
| 1880 | 20,565 | 27.1% | |
| 1890 | 24,727 | 20.2% | |
| 1900 | 28,678 | 16.0% | |
| 1910 | 33,971 | 18.5% | |
| 1920 | 42,004 | 23.6% | |
| 1930 | 45,420 | 8.1% | |
| 1940 | 44,898 | −1.1% | |
| 1950 | 49,959 | 11.3% | |
| 1960 | 60,221 | 20.5% | |
| 1970 | 64,724 | 7.5% | |
| 1980 | 67,974 | 5.0% | |
| 1990 | 64,274 | −5.4% | |
| 2000 | 66,217 | 3.0% | |
| 2010 | 66,501 | 0.4% | |
| Est. 2017 | 64,967 | [6] | −2.3% |
| U.S. Decennial Census[7] 1790-1960[8] 1900-1990[9] 1990-2000[10] 2010-2017[1] | |||
2000 census
As of the census[11] of 2000, there were 66,217 people, 24,578 households, and 17,253 families residing in the county. The population density was 164 people per square mile (63/km²). There were 26,298 housing units at an average density of 65 per square mile (25/km²). The racial makeup of the county was 92.10% White, 5.75% Black or African American, 0.19% Native American, 0.52% Asian, 0.01% Pacific Islander, 0.49% from other races, and 0.95% from two or more races. 1.09% of the population were Hispanic or Latino of any race.
There were 24,578 households out of which 32.30% had children under the age of 18 living with them, 54.50% were married couples living together, 11.40% had a female householder with no husband present, and 29.80% were non-families. 25.10% of all households were made up of individuals and 10.90% had someone living alone who was 65 years of age or older. The average household size was 2.50 and the average family size was 2.98.
In the county, the population was spread out with 24.50% under the age of 18, 8.30% from 18 to 24, 30.30% from 25 to 44, 23.50% from 45 to 64, and 13.40% who were 65 years of age or older. The median age was 37 years. For every 100 females there were 106.90 males. For every 100 females age 18 and over, there were 107.10 males.
The median income for a household in the county was $38,709, and the median income for a family was $45,297. Males had a median income of $33,179 versus $23,586 for females. The per capita income for the county was $18,255. About 7.40% of families and 9.70% of the population were below the poverty line, including 13.60% of those under age 18 and 5.50% of those age 65 or over.
2010 census
As of the 2010 United States Census, there were 66,501 people, 24,691 households, and 16,837 families residing in the county.[12] The population density was 164.7 inhabitants per square mile (63.6/km2). There were 27,834 housing units at an average density of 68.9 per square mile (26.6/km2).[13] The racial makeup of the county was 91.1% white, 5.7% black or African American, 0.5% Asian, 0.2% American Indian, 0.1% Pacific islander, 0.8% from other races, and 1.7% from two or more races. Those of Hispanic or Latino origin made up 2.3% of the population.[12] In terms of ancestry, 29.7% were German, 15.2% were Irish, 14.7% were American, and 10.2% were English.[14]
Of the 24,691 households, 31.8% had children under the age of 18 living with them, 49.4% were married couples living together, 13.3% had a female householder with no husband present, 31.8% were non-families, and 26.3% of all households were made up of individuals. The average household size was 2.47 and the average family size was 2.94. The median age was 39.9 years.[12]
The median income for a household in the county was $40,511 and the median income for a family was $50,900. Males had a median income of $39,741 versus $30,161 for females. The per capita income for the county was $19,849. About 13.1% of families and 17.3% of the population were below the poverty line, including 24.6% of those under age 18 and 9.4% of those age 65 or over.[15]
Politics
| Year | Republican | Democratic | Third parties |
|---|---|---|---|
| 2016 | 64.1% 16,961 | 29.9% 7,928 | 6.0% 1,589 |
| 2012 | 52.0% 14,265 | 45.6% 12,504 | 2.4% 649 |
| 2008 | 53.1% 15,454 | 44.2% 12,870 | 2.6% 768 |
| 2004 | 58.7% 17,171 | 40.8% 11,930 | 0.5% 157 |
| 2000 | 54.9% 13,617 | 41.8% 10,370 | 3.3% 828 |
| 1996 | 45.0% 11,112 | 42.5% 10,482 | 12.5% 3,080 |
| 1992 | 42.1% 11,675 | 34.1% 9,444 | 23.8% 6,596 |
| 1988 | 60.1% 14,864 | 38.8% 9,596 | 1.0% 258 |
| 1984 | 65.8% 17,392 | 33.4% 8,827 | 0.9% 224 |
| 1980 | 57.0% 14,605 | 36.8% 9,419 | 6.3% 1,607 |
| 1976 | 53.4% 13,141 | 44.5% 10,962 | 2.1% 517 |
| 1972 | 67.0% 17,197 | 31.1% 7,970 | 1.9% 492 |
| 1968 | 53.1% 12,887 | 35.5% 8,611 | 11.4% 2,773 |
| 1964 | 41.1% 10,050 | 58.9% 14,400 | |
| 1960 | 61.3% 15,210 | 38.7% 9,598 | |
| 1956 | 67.1% 15,125 | 32.9% 7,425 | |
| 1952 | 62.2% 14,583 | 37.8% 8,851 | |
| 1948 | 55.5% 10,333 | 44.2% 8,223 | 0.3% 50 |
| 1944 | 57.6% 11,925 | 42.4% 8,775 | |
| 1940 | 53.0% 11,817 | 47.0% 10,462 | |
| 1936 | 42.3% 9,070 | 55.5% 11,881 | 2.2% 476 |
| 1932 | 44.1% 8,569 | 53.3% 10,354 | 2.6% 506 |
| 1928 | 70.3% 13,398 | 28.7% 5,468 | 1.0% 194 |
| 1924 | 54.2% 9,161 | 31.0% 5,234 | 14.8% 2,506 |
| 1920 | 57.9% 11,320 | 41.3% 8,065 | 0.8% 156 |
| 1916 | 43.3% 4,264 | 53.5% 5,273 | 3.2% 313 |
| 1912 | 36.0% 3,218 | 45.1% 4,024 | 18.9% 1,686 |
| 1908 | 46.1% 4,175 | 51.4% 4,657 | 2.4% 221 |
| 1904 | 53.8% 4,473 | 43.1% 3,581 | 3.1% 257 |
| 1900 | 47.0% 3,770 | 51.7% 4,141 | 1.3% 105 |
| 1896 | 45.4% 3,426 | 53.2% 4,016 | 1.4% 105 |
| 1892 | 40.9% 2,477 | 54.2% 3,282 | 4.8% 293 |
| 1888 | 41.4% 2,521 | 54.1% 3,297 | 4.5% 274 |
| 1884 | 43.1% 2,439 | 55.1% 3,118 | 1.8% 100 |
| 1880 | 42.5% 2,192 | 56.8% 2,932 | 0.8% 39 |
| 1876 | 42.2% 1,918 | 57.3% 2,603 | 0.5% 21 |
| 1872 | 41.4% 1,340 | 56.9% 1,842 | 1.6% 53 |
Government
Marion County is represented by two members of the Ohio House of Representatives, as it is split between the 86th and 87th Ohio House Districts. State Representative Dorothy Pelanda, appointed in 2011, represents the 86th Ohio House district, and Riordan T. McClain, appointed in 2018, serves the 87th Ohio House District.
The entirety of Marion County lies within the 26th Ohio Senate District, currently represented by Marion native and Marion Catholic alumnus David E. Burke, who was appointed to the seat in July 2011.
Education
Colleges and universities
Public school districts
Five school districts cover the majority of Marion County:
- Elgin Local Schools
- Marion City School District
- Pleasant Local School District
- Ridgedale Local School District
- River Valley Local School District
Additionally, Buckeye Valley Local School District, Cardington-Lincoln Local Schools, Northmor Local School District, and Upper Sandusky Exempted Village School District cover small areas on the edges of the county.[17]
Communities
City
- Marion (county seat)
Villages
Townships
https://web.archive.org/web/20160715023447/http://www.ohiotownships.org/township-websites
Unincorporated communities
- Bellaire Gardens
- Big Island
- Brush Ridge
- Centerville
- Claridon
- Decliff
- Espyville
- Kirkpatrick
- Lynn
- Martel
- Meeker
- Oak Knoll
- Owens
- Tobias
See also
References
- 1 2 "State & County QuickFacts". United States Census Bureau. Archived from the original on July 14, 2011. Retrieved February 9, 2015.
- ↑ "Find a County". National Association of Counties. Retrieved 2011-06-07.
- ↑ "Ohio: Individual County Chronologies". Ohio Atlas of Historical County Boundaries. The Newberry Library. 2007. Retrieved February 14, 2015.
- ↑ Gannett, Henry (1905). The Origin of Certain Place Names in the United States. U.S. Government Printing Office. p. 200.
- ↑ "2010 Census Gazetteer Files". United States Census Bureau. August 22, 2012. Archived from the original on May 4, 2014. Retrieved February 9, 2015.
- ↑ "Population and Housing Unit Estimates". Retrieved June 9, 2017.
- ↑ "U.S. Decennial Census". United States Census Bureau. Retrieved February 9, 2015.
- ↑ "Historical Census Browser". University of Virginia Library. Retrieved February 9, 2015.
- ↑ Forstall, Richard L., ed. (March 27, 1995). "Population of Counties by Decennial Census: 1900 to 1990". United States Census Bureau. Retrieved February 9, 2015.
- ↑ "Census 2000 PHC-T-4. Ranking Tables for Counties: 1990 and 2000" (PDF). United States Census Bureau. April 2, 2001. Retrieved February 9, 2015.
- ↑ "American FactFinder". United States Census Bureau. Retrieved 2008-01-31.
- 1 2 3 "DP-1 Profile of General Population and Housing Characteristics: 2010 Demographic Profile Data". United States Census Bureau. Retrieved 2015-12-27.
- ↑ "Population, Housing Units, Area, and Density: 2010 - County". United States Census Bureau. Retrieved 2015-12-27.
- ↑ "DP02 SELECTED SOCIAL CHARACTERISTICS IN THE UNITED STATES – 2006-2010 American Community Survey 5-Year Estimates". United States Census Bureau. Retrieved 2015-12-27.
- ↑ "DP03 SELECTED ECONOMIC CHARACTERISTICS – 2006-2010 American Community Survey 5-Year Estimates". United States Census Bureau. Retrieved 2015-12-27.
- ↑ Leip, David. "Dave Leip's Atlas of U.S. Presidential Elections". uselectionatlas.org. Retrieved 2018-05-02.
- ↑ "Marion County School Map". Elgin Local Schools. Retrieved 19 July 2018.
External links
- Marion County Government website

Places adjacent to Marion County, Ohio | ||||||||||
|---|---|---|---|---|---|---|---|---|---|---|
| ||||||||||
Municipalities and communities of Marion County, Ohio, United States | ||
|---|---|---|
| City | | |
| Villages | ||
| Townships | ||
| Unincorporated communities | ||
| Ghost town | ||