Hardy County, West Virginia
| Hardy County, West Virginia | |
|---|---|
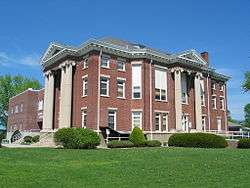 Hardy County Courthouse | |
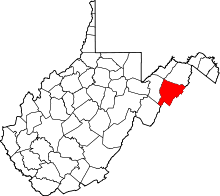 Location in the U.S. state of West Virginia | |
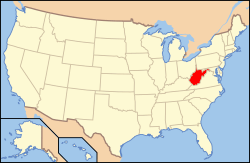 West Virginia's location in the U.S. | |
| Founded | October 17, 1786 |
| Named for | Samuel Hardy |
| Seat | Moorefield |
| Largest town | Moorefield |
| Area | |
| • Total | 584 sq mi (1,513 km2) |
| • Land | 582 sq mi (1,507 km2) |
| • Water | 2.2 sq mi (6 km2), 0.4% |
| Population (est.) | |
| • (2015) | 13,852 |
| • Density | 24/sq mi (9/km2) |
| Congressional district | 2nd |
| Time zone | Eastern: UTC−5/−4 |
| Website |
www |
Hardy County is a county in the U.S. state of West Virginia. As of the 2010 census, the population was 14,025.[1] Its county seat is Moorefield.[2] The county was created from Hampshire County in 1786[3] and named for Samuel Hardy,[4] a distinguished Virginian.
History
The first European known to visit this area was John Van Meter in 1725. The earliest permanent European settlements were established in the 1730s.
Hardy County was formed in 1786 from Hampshire County in Virginia. When West Virginia was admitted to the Union in 1863 it followed.
Hardy County has a rich African American history, with many free African Americans living there before the Civil War. This history is discussed in part 2 of the Henry Louis Gates television series African American Lives.
Geography
According to the U.S. Census Bureau, the county has a total area of 584 square miles (1,510 km2), of which 582 square miles (1,510 km2) is land and 2.2 square miles (5.7 km2) (0.4%) is water.[5]
Through this county flows the South Branch Potomac River with its surrounding magnificent valley. Several miles wide, "the Valley," as it is commonly called, contains lands whose fertility lends itself to successful farming. Agriculture and stock raising have always been the main source of employment in this area, with corn, wheat, apples, peaches, melons, cattle and poultry having important interests. Truck-farming has a vital role, each household possessing its own small garden.
On either side of the Valley are high mountains with rough terrain and heavy timber. Throughout the area wildlife is plentiful, and hunting has always been a major diversion and source of meat supply.
The South Branch is a clear stream, quite wide, and of considerable depth in many places. Watering the Valley, the river abounds in fish and creates many picturesque settings. At times the usually calm waters surge from low banks and spread over the Valley, enveloping and ravishing the rich surrounding lands. The river has a peculiar feature in the field of geology as it flows through the Valley. At one point the river, thousands of years ago, did not cut across the mountains from one side to the other, but made a passage through them from end to end. This geological exception is now in the form of a narrow, trough-like gap, about seven miles (11 km) long, and appropriately called "The Trough". At the present day, the gorge is several hundred feet deep, and the South Branch flows in a narrow channel at the bottom, with almost perpendicular walls of rock on either side.
In the very center of the South Branch Valley, surrounded by high mountains, and located on the east side of the junction of the South Fork South Branch Potomac River and the South Branch Potomac, is Moorefield, the county seat of Hardy County. A quiet farming center in 1860, the population of the Moorefield area at that time was about 1,500. At this period there were no bridges at Moorefield, and the South Branch had to be forded some three miles (5 km) up the Valley, or the ferryboat, which was usually busy, had to be used. The main towns that communicated with Moorefield were Petersburg, Romney, and New Creek (presently Keyser) the latter having a stage line between the two points.
Major highways
Adjacent counties
- Hampshire County (north)
- Frederick County, Virginia (east)
- Shenandoah County, Virginia (southeast)
- Rockingham County, Virginia (south)
- Pendleton County (southwest)
- Grant County (west)
National protected areas
Demographics
| Historical population | |||
|---|---|---|---|
| Census | Pop. | %± | |
| 1790 | 7,336 | — | |
| 1800 | 6,627 | −9.7% | |
| 1810 | 5,525 | −16.6% | |
| 1820 | 5,700 | 3.2% | |
| 1830 | 6,798 | 19.3% | |
| 1840 | 7,622 | 12.1% | |
| 1850 | 9,543 | 25.2% | |
| 1860 | 9,864 | 3.4% | |
| 1870 | 5,518 | −44.1% | |
| 1880 | 6,794 | 23.1% | |
| 1890 | 7,567 | 11.4% | |
| 1900 | 8,449 | 11.7% | |
| 1910 | 9,163 | 8.5% | |
| 1920 | 9,601 | 4.8% | |
| 1930 | 9,816 | 2.2% | |
| 1940 | 10,813 | 10.2% | |
| 1950 | 10,032 | −7.2% | |
| 1960 | 9,308 | −7.2% | |
| 1970 | 8,855 | −4.9% | |
| 1980 | 10,030 | 13.3% | |
| 1990 | 10,977 | 9.4% | |
| 2000 | 12,669 | 15.4% | |
| 2010 | 14,025 | 10.7% | |
| Est. 2016 | 13,889 | [6] | −1.0% |
| U.S. Decennial Census[7] 1790–1960[8] 1900–1990[9] 1990–2000[10] 2010–2015[1] | |||
2000 census
As of the census[11] of 2000, there were 12,669 people, 5,204 households, and 3,564 families residing in the county. The population density was 22 people per square mile (8/km²). There were 7,115 housing units at an average density of 12 per square mile (5/km²). The racial makeup of the county was 96.87% White, 1.93% Black or African American, 0.16% Native American, 0.14% Asian, 0.23% from other races, and 0.67% from two or more races. 0.66% of the population were Hispanic or Latino of any race.
There were 5,204 households out of which 29.60% had children under the age of 18 living with them, 56.10% were married couples living together, 8.60% had a female householder with no husband present, and 31.50% were non-families. 27.00% of all households were made up of individuals and 12.20% had someone living alone who was 65 years of age or older. The average household size was 2.42 and the average family size was 2.92.
In the county, the population was spread out with 23.30% under the age of 18, 7.60% from 18 to 24, 28.80% from 25 to 44, 25.40% from 45 to 64, and 14.90% who were 65 years of age or older. The median age was 39 years. For every 100 females there were 97.50 males. For every 100 females age 18 and over, there were 96.70 males.
The median income for a household in the county was $31,846, and the median income for a family was $37,003. Males had a median income of $28,032 versus $18,798 for females. The per capita income for the county was $15,859. About 10.50% of families and 13.10% of the population were below the poverty line, including 13.10% of those under age 18 and 20.20% of those age 65 or over.
2010 census
As of the 2010 United States Census, there were 14,025 people, 5,818 households, and 3,900 families residing in the county.[12] The population density was 24.1 inhabitants per square mile (9.3/km2). There were 8,078 housing units at an average density of 13.9 per square mile (5.4/km2).[13] The racial makeup of the county was 93.8% white, 2.5% black or African American, 1.0% Asian, 0.2% American Indian, 1.5% from other races, and 1.0% from two or more races. Those of Hispanic or Latino origin made up 3.4% of the population.[12] In terms of ancestry, 42.7% were German, 13.2% were English, 11.0% were American, and 9.9% were Irish.[14]
Of the 5,818 households, 29.0% had children under the age of 18 living with them, 52.0% were married couples living together, 10.0% had a female householder with no husband present, 33.0% were non-families, and 27.0% of all households were made up of individuals. The average household size was 2.40 and the average family size was 2.86. The median age was 42.8 years.[12]
The median income for a household in the county was $31,347 and the median income for a family was $41,401. Males had a median income of $37,506 versus $23,865 for females. The per capita income for the county was $16,944. About 11.1% of families and 14.9% of the population were below the poverty line, including 21.9% of those under age 18 and 14.0% of those age 65 or over.[15]
Politics
During the Virginia Secession Convention, Hardy County voted against secession, but much of this vote was within fiercely Unionist and overwhelmingly Republican Grant County, which was detached from it after the war. Following the detachment of Grant – which was frequently to be among the nation’s most Republican counties in the subsequent century and a half – Hardy County became solidly Democratic, not voting for any Republican candidate between 1868 and 1964 inclusive.[16] However, since 1968 Hardy County has not voted for any Democratic presidential candidate apart from Jimmy Carter in 1976 and Bill Clinton in 1996, whilst since 2000 it has seen the same drastic declines in Democratic support as the rest of socially conservative West Virginia.[17]
| Year | Republican | Democratic | Third parties |
|---|---|---|---|
| 2016 | 75.3% 4,274 | 20.4% 1,155 | 4.3% 245 |
| 2012 | 68.3% 3,536 | 28.6% 1,482 | 3.2% 163 |
| 2008 | 62.4% 3,376 | 35.2% 1,901 | 2.4% 130 |
| 2004 | 68.9% 3,635 | 30.7% 1,617 | 0.5% 24 |
| 2000 | 62.4% 2,816 | 35.9% 1,621 | 1.7% 77 |
| 1996 | 44.5% 1,895 | 44.9% 1,911 | 10.6% 453 |
| 1992 | 45.9% 2,144 | 41.0% 1,917 | 13.1% 610 |
| 1988 | 60.2% 2,581 | 39.4% 1,689 | 0.4% 18 |
| 1984 | 64.1% 2,938 | 35.8% 1,641 | 0.2% 8 |
| 1980 | 51.8% 2,329 | 45.6% 2,050 | 2.7% 120 |
| 1976 | 38.3% 1,858 | 61.7% 2,993 | |
| 1972 | 63.3% 2,609 | 36.7% 1,510 | |
| 1968 | 43.9% 1,768 | 43.9% 1,767 | 12.2% 490 |
| 1964 | 30.4% 1,308 | 69.6% 2,996 | |
| 1960 | 45.3% 2,042 | 54.7% 2,465 | |
| 1956 | 49.4% 2,202 | 50.6% 2,259 | |
| 1952 | 45.8% 2,037 | 54.2% 2,411 | |
| 1948 | 37.0% 1,433 | 62.8% 2,435 | 0.3% 10 |
| 1944 | 41.4% 1,489 | 58.6% 2,111 | |
| 1940 | 38.4% 1,674 | 61.6% 2,690 | |
| 1936 | 34.8% 1,581 | 65.1% 2,956 | 0.1% 5 |
| 1932 | 30.8% 1,267 | 68.6% 2,824 | 0.6% 25 |
| 1928 | 45.0% 1,611 | 54.9% 1,965 | 0.2% 6 |
| 1924 | 33.9% 1,272 | 65.1% 2,442 | 1.0% 36 |
| 1920 | 40.1% 1,354 | 59.7% 2,014 | 0.2% 7 |
| 1916 | 32.9% 701 | 66.8% 1,425 | 0.3% 6 |
| 1912 | 18.4% 344 | 64.5% 1,209 | 17.1% 321 |
Communities
Towns
- Moorefield (county seat)
- Wardensville
Unincorporated communities
See also
References
- 1 2 "State & County QuickFacts". United States Census Bureau. Archived from the original on July 11, 2011. Retrieved January 10, 2014.
- ↑ "Find a County". National Association of Counties. Retrieved 2011-06-07.
- ↑ "West Virginia: Individual County Chronologies". West Virginia Atlas of Historical County Boundaries. The Newberry Library. 2003. Retrieved August 10, 2015.
- ↑ "Archived copy". Archived from the original on 2013-01-21. Retrieved 2013-01-29.
- ↑ "2010 Census Gazetteer Files". United States Census Bureau. August 22, 2012. Retrieved July 24, 2015.
- ↑ "Population and Housing Unit Estimates". Retrieved June 9, 2017.
- ↑ "U.S. Decennial Census". United States Census Bureau. Retrieved January 10, 2014.
- ↑ "Historical Census Browser". University of Virginia Library. Retrieved January 10, 2014.
- ↑ "Population of Counties by Decennial Census: 1900 to 1990". United States Census Bureau. Retrieved January 10, 2014.
- ↑ "Census 2000 PHC-T-4. Ranking Tables for Counties: 1990 and 2000" (PDF). United States Census Bureau. Retrieved January 10, 2014.
- ↑ "American FactFinder". United States Census Bureau. Retrieved 2011-05-14.
- 1 2 3 "DP-1 Profile of General Population and Housing Characteristics: 2010 Demographic Profile Data". United States Census Bureau. Retrieved 2016-04-03.
- ↑ "Population, Housing Units, Area, and Density: 2010 - County". United States Census Bureau. Retrieved 2016-04-03.
- ↑ "DP02 SELECTED SOCIAL CHARACTERISTICS IN THE UNITED STATES – 2006-2010 American Community Survey 5-Year Estimates". United States Census Bureau. Retrieved 2016-04-03.
- ↑ "DP03 SELECTED ECONOMIC CHARACTERISTICS – 2006-2010 American Community Survey 5-Year Estimates". United States Census Bureau. Retrieved 2016-04-03.
- ↑ Menendez, Albert J.; The Geography of Presidential Elections in the United States, 1868-2004, pp. 334-335 ISBN 0786422173
- ↑ Cohn, Nate; ‘Demographic Shift: Southern Whites’ Loyalty to G.O.P. Nearing That of Blacks to Democrats’, New York Times, April 24, 2014
- ↑ Leip, David. "Dave Leip's Atlas of U.S. Presidential Elections". uselectionatlas.org. Retrieved 2018-03-27.
External links
| Wikimedia Commons has media related to Hardy County, West Virginia. |
Places adjacent to Hardy County, West Virginia | ||||||||||
|---|---|---|---|---|---|---|---|---|---|---|
| ||||||||||
Municipalities and communities of Hardy County, West Virginia, United States | ||
|---|---|---|
| Towns | | |
| Unincorporated communities | ||