Gallia County, Ohio
| Gallia County, Ohio | ||
|---|---|---|
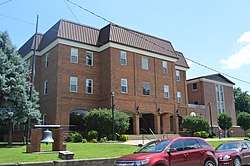 Courthouse in Gallipolis | ||
| ||
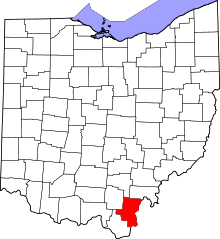 Location in the U.S. state of Ohio | ||
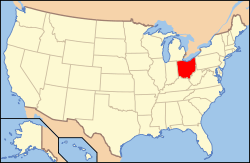 Ohio's location in the U.S. | ||
| Founded | March 25, 1803[1] | |
| Named for | the Latin name for France | |
| Seat | Gallipolis | |
| Largest village | Gallipolis | |
| Area | ||
| • Total | 471 sq mi (1,220 km2) | |
| • Land | 467 sq mi (1,210 km2) | |
| • Water | 4.7 sq mi (12 km2), 1.0% | |
| Population | ||
| • (2010) | 30,934 | |
| • Density | 66/sq mi (25/km2) | |
| Congressional district | 6th | |
| Time zone | Eastern: UTC−5/−4 | |
| Website |
www | |

Gallia County (pronunciation: GAL-yuh) is a county located in the U.S. state of Ohio. As of the 2010 census, the population was 30,934.[2] Its county seat is Gallipolis.[3]
Named after the French people who originally settled there,[4] its name “Gallia” is the Latin word for Gaul, the ancient region of Western Europe that included present day France.[5]
Gallia County is part of the Point Pleasant, WV-OH Micropolitan Statistical Area.
History
Gallia County was formed on March 25, 1803 from portions of Adams and Washington counties. Gallia County had originally been settled by French immigrants, who named the county “Gallia,” the Latin name for Gaul, the ancient region of Western Europe which included present day France.[6]
In the 19th century, the county was settled by numerous migrants from the Upper South, who traveled to the territory by the Ohio River. In the antebellum years, some of its towns became centers of settlement by African Americans, both free blacks (some also from the South) and refugee slaves who had escaped their owners and come across the river to a free state.
Geography
According to the U.S. Census Bureau, the county has a total area of 471 square miles (1,220 km2), of which 467 square miles (1,210 km2) is land and 4.7 square miles (12 km2) (1.0%) is water.[7]
Adjacent counties
- Vinton County (north)
- Meigs County (northeast)
- Mason County, West Virginia (east)
- Cabell County, West Virginia (south)
- Lawrence County (southwest)
- Jackson County (northwest)
National protected area
- Wayne National Forest (part)
Demographics
| Historical population | |||
|---|---|---|---|
| Census | Pop. | %± | |
| 1810 | 4,181 | — | |
| 1820 | 7,098 | 69.8% | |
| 1830 | 9,733 | 37.1% | |
| 1840 | 13,444 | 38.1% | |
| 1850 | 17,063 | 26.9% | |
| 1860 | 22,043 | 29.2% | |
| 1870 | 25,545 | 15.9% | |
| 1880 | 28,124 | 10.1% | |
| 1890 | 27,005 | −4.0% | |
| 1900 | 27,918 | 3.4% | |
| 1910 | 25,745 | −7.8% | |
| 1920 | 23,311 | −9.5% | |
| 1930 | 23,050 | −1.1% | |
| 1940 | 24,930 | 8.2% | |
| 1950 | 24,910 | −0.1% | |
| 1960 | 26,120 | 4.9% | |
| 1970 | 25,239 | −3.4% | |
| 1980 | 30,098 | 19.3% | |
| 1990 | 30,954 | 2.8% | |
| 2000 | 31,069 | 0.4% | |
| 2010 | 30,934 | −0.4% | |
| Est. 2017 | 29,973 | [8] | −3.1% |
| U.S. Decennial Census[9] 1790-1960[10] 1900-1990[11] 1990-2000[12] 2010-2017[2] | |||
2000 census
As of the census[13] of 2000, there were 31,069 people, 12,060 households, and 8,586 families residing in the county. The population density was 66 people per square mile (26/km²). There were 13,498 housing units at an average density of 29 per square mile (11/km²). The racial makeup of the county was 95.26% White, 2.70% Black or African American, 0.43% Native American, 0.35% Asian, 0.15% from other races, and 1.11% from two or more races. 0.61% of the population were Hispanic or Latino of any race.
There were 12,060 households out of which 33.00% had children under the age of 18 living with them, 56.50% were married couples living together, 11.00% had a female householder with no husband present, and 28.80% were non-families. 25.20% of all households were made up of individuals and 10.40% had someone living alone who was 65 years of age or older. The average household size was 2.50 and the average family size was 2.98.
In the county, the population was spread out with 25.00% under the age of 18, 9.70% from 18 to 24, 27.50% from 25 to 44, 24.20% from 45 to 64, and 13.60% who were 65 years of age or older. The median age was 37 years. For every 100 females, there were 95.40 males. For every 100 females age 18 and over, there were 92.10 males.
The median income for a household in the county was $30,191, and the median income for a family was $35,938. Males had a median income of $31,783 versus $22,829 for females. The per capita income for the county was $15,183. About 13.50% of families and 18.10% of the population were below the poverty line, including 25.20% of those under age 18 and 10.00% of those age 65 or over.
2010 census
As of the 2010 United States Census, there were 30,934 people, 12,062 households, and 8,264 families residing in the county.[14] The population density was 66.3 inhabitants per square mile (25.6/km2). There were 13,925 housing units at an average density of 29.8 per square mile (11.5/km2).[15] The racial makeup of the county was 94.7% white, 2.6% black or African American, 0.5% Asian, 0.4% American Indian, 0.2% from other races, and 1.6% from two or more races. Those of Hispanic or Latino origin made up 0.9% of the population.[14] In terms of ancestry, 18.6% were American, 15.9% were German, 15.6% were Irish, and 8.0% were English.[16]
Of the 12,062 households, 31.9% had children under the age of 18 living with them, 51.9% were married couples living together, 11.6% had a female householder with no husband present, 31.5% were non-families, and 27.0% of all households were made up of individuals. The average household size was 2.49 and the average family size was 2.99. The median age was 39.9 years.[14]
The median income for a household in the county was $37,409 and the median income for a family was $46,470. Males had a median income of $39,301 versus $30,068 for females. The per capita income for the county was $20,199. About 15.8% of families and 21.3% of the population were below the poverty line, including 30.7% of those under age 18 and 14.9% of those age 65 or over.[17]
Politics
Gallia County has been a Republican stronghold ever since that party was formed. Lyndon Johnson in his 1964 landslide is the solitary Democrat to win a majority of the county’s vote in the presidential election, although Bill Clinton won a plurality in 1996.
| Year | Republican | Democratic | Third parties |
|---|---|---|---|
| 2016 | 75.5% 9,822 | 20.2% 2,628 | 4.3% 554 |
| 2012 | 61.4% 7,750 | 36.1% 4,557 | 2.5% 315 |
| 2008 | 61.7% 8,247 | 35.7% 4,777 | 2.6% 347 |
| 2004 | 61.3% 8,576 | 38.4% 5,366 | 0.4% 51 |
| 2000 | 58.8% 7,511 | 38.1% 4,872 | 3.1% 393 |
| 1996 | 41.2% 5,135 | 43.2% 5,386 | 15.6% 1,945 |
| 1992 | 42.0% 5,776 | 38.9% 5,350 | 19.0% 2,612 |
| 1988 | 59.9% 7,399 | 39.1% 4,834 | 0.9% 116 |
| 1984 | 65.3% 8,194 | 33.9% 4,251 | 0.9% 109 |
| 1980 | 56.7% 6,469 | 38.6% 4,406 | 4.6% 529 |
| 1976 | 50.4% 5,198 | 48.2% 4,971 | 1.4% 148 |
| 1972 | 72.4% 6,506 | 26.1% 2,341 | 1.6% 139 |
| 1968 | 58.1% 5,134 | 30.1% 2,660 | 11.8% 1,042 |
| 1964 | 48.2% 4,408 | 51.8% 4,740 | |
| 1960 | 68.5% 7,602 | 31.5% 3,498 | |
| 1956 | 71.0% 7,040 | 29.0% 2,877 | |
| 1952 | 68.2% 6,763 | 31.8% 3,153 | |
| 1948 | 62.4% 5,743 | 37.3% 3,430 | 0.4% 34 |
| 1944 | 68.5% 6,464 | 31.5% 2,968 | |
| 1940 | 64.9% 7,285 | 35.1% 3,943 | |
| 1936 | 59.4% 6,700 | 40.3% 4,548 | 0.2% 27 |
| 1932 | 56.5% 5,646 | 41.9% 4,190 | 1.7% 166 |
| 1928 | 73.4% 5,513 | 25.5% 1,916 | 1.1% 80 |
| 1924 | 61.2% 4,325 | 32.3% 2,284 | 6.5% 457 |
| 1920 | 67.4% 5,388 | 32.1% 2,562 | 0.6% 44 |
| 1916 | 54.7% 2,860 | 43.6% 2,277 | 1.7% 91 |
| 1912 | 25.2% 1,355 | 32.9% 1,765 | 41.9% 2,250 |
| 1908 | 63.5% 3,914 | 35.2% 2,171 | 1.3% 81 |
| 1904 | 67.5% 3,880 | 30.3% 1,742 | 2.2% 125 |
| 1900 | 62.8% 4,159 | 36.1% 2,388 | 1.1% 73 |
| 1896 | 63.7% 4,247 | 35.5% 2,369 | 0.8% 55 |
| 1892 | 62.0% 3,547 | 34.7% 1,984 | 3.3% 191 |
| 1888 | 61.3% 3,651 | 37.2% 2,216 | 1.4% 86 |
| 1884 | 60.7% 3,690 | 38.4% 2,333 | 1.0% 59 |
| 1880 | 59.9% 3,488 | 39.7% 2,310 | 0.4% 23 |
| 1876 | 58.1% 3,202 | 41.8% 2,302 | 0.2% 10 |
| 1872 | 64.4% 2,855 | 35.0% 1,553 | 0.6% 25 |
Communities
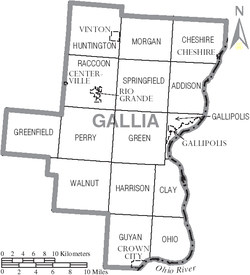
Villages
- Centerville
- Cheshire
- Crown City
- Gallipolis (county seat)
- Rio Grande
- Vinton
Townships
https://web.archive.org/web/20160715023447/http://www.ohiotownships.org/township-websites
Census-designated place
Other unincorporated communities
See also
References
- ↑ "Ohio County Profiles: Gallia County" (PDF). Ohio Department of Development. Archived from the original (PDF) on June 21, 2007. Retrieved April 28, 2007.
- 1 2 "State & County QuickFacts". United States Census Bureau. Archived from the original on July 10, 2011. Retrieved February 8, 2015.
- ↑ "Find a County". National Association of Counties. Archived from the original on May 31, 2011. Retrieved June 7, 2011.
- ↑ https://books.google.com/books?id=DmxNAQAAMAAJ&dq=gallia&pg=PR1#v=onepage&q=gallia&f=true
- ↑ http://ohio.llgc.org.uk/co-jacksongallia.php
- ↑ Gannett, Henry (1905). The Origin of Certain Place Names in the United States. Govt. Print. Off. p. 133.
- ↑ "2010 Census Gazetteer Files". United States Census Bureau. August 22, 2012. Archived from the original on May 4, 2014. Retrieved February 8, 2015.
- ↑ "Population and Housing Unit Estimates". Retrieved June 9, 2017.
- ↑ "U.S. Decennial Census". United States Census Bureau. Archived from the original on May 12, 2015. Retrieved February 8, 2015.
- ↑ "Historical Census Browser". University of Virginia Library. Retrieved February 8, 2015.
- ↑ Forstall, Richard L., ed. (March 27, 1995). "Population of Counties by Decennial Census: 1900 to 1990". United States Census Bureau. Retrieved February 8, 2015.
- ↑ "Census 2000 PHC-T-4. Ranking Tables for Counties: 1990 and 2000" (PDF). United States Census Bureau. April 2, 2001. Retrieved February 8, 2015.
- ↑ "American FactFinder". United States Census Bureau. Archived from the original on September 11, 2013. Retrieved January 31, 2008.
- 1 2 3 "DP-1 Profile of General Population and Housing Characteristics: 2010 Demographic Profile Data". United States Census Bureau. Retrieved December 27, 2015.
- ↑ "Population, Housing Units, Area, and Density: 2010 - County". United States Census Bureau. Retrieved December 27, 2015.
- ↑ "DP02 SELECTED SOCIAL CHARACTERISTICS IN THE UNITED STATES – 2006-2010 American Community Survey 5-Year Estimates". United States Census Bureau. Retrieved December 27, 2015.
- ↑ "DP03 SELECTED ECONOMIC CHARACTERISTICS – 2006-2010 American Community Survey 5-Year Estimates". United States Census Bureau. Retrieved December 27, 2015.
- ↑ Leip, David. "Dave Leip's Atlas of U.S. Presidential Elections". uselectionatlas.org. Retrieved May 2, 2018.
External links
| Wikivoyage has a travel guide for Gallia County (Ohio). |
Places adjacent to Gallia County, Ohio | |
|---|---|
Municipalities and communities of Gallia County, Ohio, United States | ||
|---|---|---|
| Villages | | |
| Townships | ||
| CDP | ||
| Unincorporated communities | ||