Wood County, West Virginia
| Wood County, West Virginia | |
|---|---|
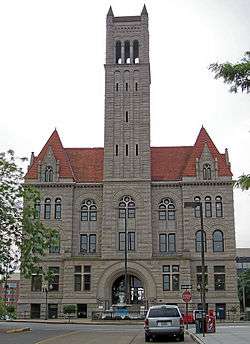 The Wood County Courthouse in Parkersburg | |
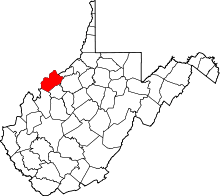 Location in the U.S. state of West Virginia | |
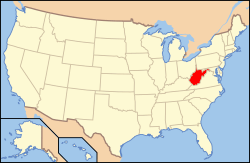 West Virginia's location in the U.S. | |
| Founded | December 21, 1798 |
| Named for | James Wood |
| Seat | Parkersburg |
| Largest city | Parkersburg |
| Area | |
| • Total | 377 sq mi (976 km2) |
| • Land | 367 sq mi (951 km2) |
| • Water | 11 sq mi (28 km2), 2.8% |
| Population (est.) | |
| • (2015) | 86,452 |
| • Density | 236/sq mi (91/km2) |
| Congressional district | 1st |
| Time zone | Eastern: UTC−5/−4 |
| Website |
www |
Wood County is a county in the U.S. state of West Virginia. As of the 2010 census, the population was 86,956,[1] making it West Virginia's fifth-most populous county. Its county seat is Parkersburg.[2] The county was formed in 1798 from the western part of Harrison County and named for James Wood, governor of Virginia from 1796 to 1799.[3]
Wood County is part of the Parkersburg-Vienna, WV Metropolitan Statistical Area.
History
Wood County was formed on December 21, 1798 from portions of Harrison County. It was named for the then Governor of Virginia (1796–99), James Wood, formerly a brigadier general in the American Revolutionary War.
In 1861, Virginia seceded from the Union. The delegates of the 40 western counties who opposed secession formed their own government and seceded from the Confederate state of Virginia. West Virginia was granted statehood in 1863.
Geography
According to the U.S. Census Bureau, the county has a total area of 377 square miles (980 km2), of which 366 square miles (950 km2) is land and 11 square miles (28 km2) (2.8%) is water.[4]
Wood County's northern and western boundary is the Ohio River. The Little Kanawha River flows northwestward through the county to its mouth at the Ohio River in Parkersburg. Tributaries of the Little Kanawha River in Wood County include Worthington Creek, Tygart Creek, and Walker Creek.[5]
Major highways
Adjacent counties
- Washington County, Ohio (north)
- Pleasants County (northeast)
- Ritchie County (east)
- Wirt County (southeast)
- Jackson County (south)
- Meigs County, Ohio (southwest)
- Athens County, Ohio (west)
National protected area
Demographics
| Historical population | |||
|---|---|---|---|
| Census | Pop. | %± | |
| 1800 | 1,217 | — | |
| 1810 | 3,036 | 149.5% | |
| 1820 | 5,860 | 93.0% | |
| 1830 | 6,429 | 9.7% | |
| 1840 | 7,923 | 23.2% | |
| 1850 | 9,450 | 19.3% | |
| 1860 | 11,046 | 16.9% | |
| 1870 | 19,000 | 72.0% | |
| 1880 | 25,006 | 31.6% | |
| 1890 | 28,612 | 14.4% | |
| 1900 | 34,452 | 20.4% | |
| 1910 | 38,001 | 10.3% | |
| 1920 | 42,306 | 11.3% | |
| 1930 | 56,521 | 33.6% | |
| 1940 | 62,399 | 10.4% | |
| 1950 | 66,540 | 6.6% | |
| 1960 | 78,331 | 17.7% | |
| 1970 | 86,818 | 10.8% | |
| 1980 | 93,648 | 7.9% | |
| 1990 | 86,915 | −7.2% | |
| 2000 | 87,986 | 1.2% | |
| 2010 | 86,956 | −1.2% | |
| Est. 2016 | 85,643 | [6] | −1.5% |
| U.S. Decennial Census[7] 1790–1960[8] 1900–1990[9] 1990–2000[10] 2010–2015[1] | |||
2000 census
As of the census[11] of 2000, there were 87,986 people, 36,275 households, and 24,884 families residing in the county. The population density was 240 people per square mile (92/km²). There were 39,785 housing units at an average density of 108 per square mile (42/km²). The racial makeup of the county was 97.32% White, 1.01% Black or African American, 0.21% Native American, 0.51% Asian, 0.04% Pacific Islander, 0.14% from other races, and 0.77% from two or more races. 0.58% of the population were Hispanic or Latino of any race.
There were 36,275 households out of which 29.30% had children under the age of 18 living with them, 54.30% were married couples living together, 10.80% had a female householder with no husband present, and 31.40% were non-families. 27.10% of all households were made up of individuals and 11.50% had someone living alone who was 65 years of age or older. The average household size was 2.39 and the average family size was 2.88.
In the county, the population was spread out with 23.00% under the age of 18, 8.00% from 18 to 24, 27.90% from 25 to 44, 25.60% from 45 to 64, and 15.50% who were 65 years of age or older. The median age was 39 years. For every 100 females there were 92.40 males. For every 100 females age 18 and over, there were 89.30 males.
The median income for a household in the county was $33,285, and the median income for a family was $40,436. Males had a median income of $34,899 versus $22,109 for females. The per capita income for the county was $18,073. About 10.60% of families and 13.90% of the population were below the poverty line, including 20.50% of those under age 18 and 8.60% of those age 65 or over.
2010 census
As of the 2010 United States Census, there were 86,956 people, 36,571 households, and 24,262 families residing in the county.[12] The population density was 237.4 inhabitants per square mile (91.7/km2). There were 40,215 housing units at an average density of 109.8 per square mile (42.4/km2).[13] The racial makeup of the county was 96.4% white, 1.1% black or African American, 0.5% Asian, 0.2% American Indian, 0.2% from other races, and 1.5% from two or more races. Those of Hispanic or Latino origin made up 0.9% of the population.[12] In terms of ancestry, 22.3% were German, 19.6% were American, 13.7% were English, and 13.6% were Irish.[14]
Of the 36,571 households, 29.1% had children under the age of 18 living with them, 50.1% were married couples living together, 11.6% had a female householder with no husband present, 33.7% were non-families, and 28.4% of all households were made up of individuals. The average household size was 2.35 and the average family size was 2.85. The median age was 42.2 years.[12]
The median income for a household in the county was $42,146 and the median income for a family was $52,058. Males had a median income of $42,497 versus $27,893 for females. The per capita income for the county was $22,890. About 12.3% of families and 16.4% of the population were below the poverty line, including 25.3% of those under age 18 and 7.8% of those age 65 or over.[15]
Politics
Like most of what is now West Virginia, Wood County was strongly Unionist during the Virginia Secession Convention[16] and has been solidly Republican for most of the century and a half since. The only Democrats to win Wood County have been Samuel J. Tilden in 1876, Woodrow Wilson in 1912 and 1916, Franklin D. Roosevelt between 1932 and 1940, Harry S. Truman in 1948, and Lyndon Johnson in 1964.
| Year | Republican | Democratic | Third parties |
|---|---|---|---|
| 2016 | 70.5% 25,434 | 23.3% 8,400 | 6.2% 2,229 |
| 2012 | 65.1% 22,183 | 33.0% 11,230 | 2.0% 663 |
| 2008 | 63.4% 22,896 | 34.8% 12,573 | 1.8% 657 |
| 2004 | 63.6% 24,948 | 35.8% 14,025 | 0.7% 254 |
| 2000 | 60.3% 20,428 | 37.4% 12,664 | 2.3% 765 |
| 1996 | 47.5% 15,502 | 40.6% 13,261 | 12.0% 3,909 |
| 1992 | 42.8% 15,441 | 37.5% 13,529 | 19.7% 7,084 |
| 1988 | 59.7% 19,450 | 39.8% 12,959 | 0.5% 154 |
| 1984 | 68.4% 24,821 | 31.3% 11,357 | 0.3% 101 |
| 1980 | 56.5% 20,080 | 38.4% 13,622 | 5.1% 1,810 |
| 1976 | 51.8% 18,382 | 48.2% 17,075 | |
| 1972 | 71.5% 27,315 | 28.5% 10,886 | |
| 1968 | 51.8% 18,960 | 39.0% 14,293 | 9.2% 3,379 |
| 1964 | 40.9% 14,947 | 59.1% 21,560 | |
| 1960 | 59.0% 22,131 | 41.0% 15,396 | |
| 1956 | 61.3% 21,096 | 38.7% 13,320 | |
| 1952 | 58.5% 19,917 | 41.5% 14,154 | |
| 1948 | 49.8% 14,198 | 49.9% 14,224 | 0.3% 71 |
| 1944 | 51.6% 14,566 | 48.4% 13,676 | |
| 1940 | 48.5% 15,005 | 51.6% 15,962 | |
| 1936 | 42.8% 12,574 | 57.2% 16,829 | 0.0% 11 |
| 1932 | 47.3% 12,144 | 51.8% 13,294 | 0.9% 235 |
| 1928 | 69.9% 15,184 | 29.5% 6,412 | 0.6% 125 |
| 1924 | 50.3% 10,086 | 46.8% 9,378 | 3.0% 591 |
| 1920 | 53.7% 10,463 | 45.4% 8,839 | 0.9% 176 |
| 1916 | 47.7% 4,521 | 50.8% 4,817 | 1.5% 142 |
| 1912 | 29.4% 2,509 | 44.3% 3,784 | 26.4% 2,251 |
Communities
Cities
- Parkersburg (county seat)
- Vienna
- Williamstown
Town
Census-designated places
Unincorporated communities
- Belleville
- Bonnivale
- Cedar Grove
- Central
- Eli
- Dallison
- Davisville
- Deerwalk
- Fort Neal
- Kanawha
- New England
- Ogden
- Pettyville
- Rockport
- Slate
- Volcano
- Walker
- Wells Subdivision
See also
References
- 1 2 "State & County QuickFacts". United States Census Bureau. Retrieved January 16, 2014.
- ↑ "Find a County". National Association of Counties. Retrieved June 7, 2011.
- ↑ "Archived copy". Archived from the original on September 23, 2001. Retrieved February 4, 2013.
- ↑ "2010 Census Gazetteer Files". United States Census Bureau. August 22, 2012. Retrieved July 31, 2015.
- ↑ West Virginia Atlas & Gazetteer. Yarmouth, Me.: DeLorme. 1997. pp. 22–23, 33–34. ISBN 0-89933-246-3.
- ↑ "Population and Housing Unit Estimates". Retrieved June 9, 2017.
- ↑ "U.S. Decennial Census". United States Census Bureau. Retrieved January 16, 2014.
- ↑ "Historical Census Browser". University of Virginia Library. Retrieved January 16, 2014.
- ↑ "Population of Counties by Decennial Census: 1900 to 1990". United States Census Bureau. Retrieved January 16, 2014.
- ↑ "Census 2000 PHC-T-4. Ranking Tables for Counties: 1990 and 2000" (PDF). United States Census Bureau. Retrieved January 16, 2014.
- ↑ "American FactFinder". United States Census Bureau. Retrieved May 14, 2011.
- 1 2 3 "DP-1 Profile of General Population and Housing Characteristics: 2010 Demographic Profile Data". United States Census Bureau. Retrieved April 3, 2016.
- ↑ "Population, Housing Units, Area, and Density: 2010 - County". United States Census Bureau. Retrieved April 3, 2016.
- ↑ "DP02 SELECTED SOCIAL CHARACTERISTICS IN THE UNITED STATES – 2006-2010 American Community Survey 5-Year Estimates". United States Census Bureau. Retrieved April 3, 2016.
- ↑ "DP03 SELECTED ECONOMIC CHARACTERISTICS – 2006-2010 American Community Survey 5-Year Estimates". United States Census Bureau. Retrieved April 3, 2016.
- ↑ ‘How Virginia Convention Delegates Voted on Secession, April 4 and April 17, 1861, and Whether They Signed a Copy of the Ordinance of Secession’
- ↑ Leip, David. "Dave Leip's Atlas of U.S. Presidential Elections". uselectionatlas.org. Retrieved 2018-03-28.
Places adjacent to Wood County, West Virginia | ||||||||||
|---|---|---|---|---|---|---|---|---|---|---|
| ||||||||||