Clark County, Ohio
| Clark County, Ohio | ||
|---|---|---|
 | ||
| ||
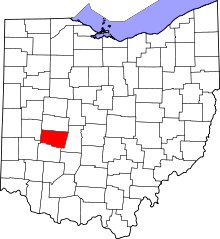 Location in the U.S. state of Ohio | ||
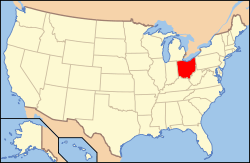 Ohio's location in the U.S. | ||
| Founded | March 1, 1818[1] | |
| Named for | George Rogers Clark | |
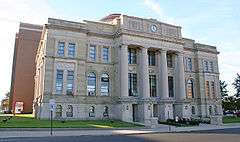
| Seat | Springfield | |
| Largest city | Springfield | |
| Area | ||
| • Total | 403 sq mi (1,044 km2) | |
| • Land | 397 sq mi (1,028 km2) | |
| • Water | 5.1 sq mi (13 km2), 1.3% | |
| Population | ||
| • (2010) | 138,333 | |
| • Density | 348/sq mi (134/km2) | |
| Congressional district | 8th | |
| Time zone | Eastern: UTC−5/−4 | |
| Website |
www | |

Clark County is a county in the U.S. state of Ohio. As of the 2010 census, the population was 138,333.[2] Its county seat is Springfield.[3] The county was created on March 1, 1818, and was named for General George Rogers Clark,[4] a hero of the American Revolution.
Clark County comprises the Springfield, OH Metropolitan Statistical Area, which is also included in the Dayton-Springfield-Sidney-OH Combined Statistical Area.
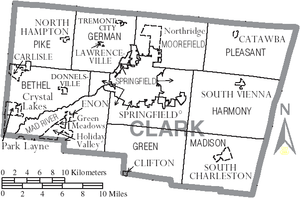
Geography
According to the U.S. Census Bureau, the county has a total area of 403 square miles (1,040 km2), of which 397 square miles (1,030 km2) is land and 5.1 square miles (13 km2) (1.3%) is water.[5] It is the third-smallest county in Ohio by total area.
Adjacent counties
- Champaign County (north)
- Madison County (east)
- Greene County (south)
- Montgomery County (southwest)
- Miami County (west)
Demographics
| Historical population | |||
|---|---|---|---|
| Census | Pop. | %± | |
| 1820 | 9,533 | — | |
| 1830 | 13,114 | 37.6% | |
| 1840 | 16,882 | 28.7% | |
| 1850 | 22,178 | 31.4% | |
| 1860 | 25,300 | 14.1% | |
| 1870 | 32,070 | 26.8% | |
| 1880 | 41,948 | 30.8% | |
| 1890 | 52,277 | 24.6% | |
| 1900 | 58,939 | 12.7% | |
| 1910 | 66,435 | 12.7% | |
| 1920 | 80,728 | 21.5% | |
| 1930 | 90,936 | 12.6% | |
| 1940 | 95,647 | 5.2% | |
| 1950 | 111,661 | 16.7% | |
| 1960 | 131,440 | 17.7% | |
| 1970 | 157,115 | 19.5% | |
| 1980 | 150,236 | −4.4% | |
| 1990 | 147,548 | −1.8% | |
| 2000 | 144,742 | −1.9% | |
| 2010 | 138,333 | −4.4% | |
| Est. 2017 | 134,557 | [6] | −2.7% |
| U.S. Decennial Census[7] 1790-1960[8] 1900-1990[9] 1990-2000[10] 2010-2017[2] | |||
2000 census
As of the census[11] of 2000, there were 144,742 people, 56,648 households, and 39,370 families residing in the county. The population density was 362 people per square mile (140/km²). There were 61,056 housing units at an average density of 153 per square mile (59/km²). The racial makeup of the county was 88.12% White, 8.95% Black or African American, 0.28% Native American, 0.53% Asian, 0.02% Pacific Islander, 0.53% from other races, and 1.58% from two or more races. 1.17% of the population were Hispanic or Latino of any race. 23.8% were of German, 21.6% American, 10.4% Irish and 8.7% English ancestry according to Census 2000.
There were 56,648 households out of which 31.40% had children under the age of 18 living with them, 52.60% were married couples living together, 12.80% had a female householder with no husband present, and 30.50% were non-families. 26.00% of all households were made up of individuals and 11.10% had someone living alone who was 65 years of age or older. The average household size was 2.49 and the average family size was 2.97.
In the county, the population was spread out with 25.10% under the age of 18, 9.10% from 18 to 24, 26.80% from 25 to 44, 24.30% from 45 to 64, and 14.70% who were 65 years of age or older. The median age was 38 years. For every 100 females there were 92.50 males. For every 100 females age 18 and over, there were 88.60 males.
The median income for a household in the county was $40,340, and the median income for a family was $48,259. Males had a median income of $37,157 versus $24,688 for females. The per capita income for the county was $19,501. About 7.90% of families and 10.70% of the population were below the poverty line, including 14.90% of those under age 18 and 8.20% of those age 65 or over.
2010 census
As of the 2010 United States Census, there were 138,333 people, 55,244 households, and 36,906 families residing in the county.[12] The population density was 348.0 inhabitants per square mile (134.4/km2). There were 61,419 housing units at an average density of 154.5 per square mile (59.7/km2).[13] The racial makeup of the county was 86.3% white, 8.8% black or African American, 0.6% Asian, 0.3% American Indian, 1.4% from other races, and 2.5% from two or more races. Those of Hispanic or Latino origin made up 2.8% of the population.[12] In terms of ancestry, 25.3% were German, 15.0% were Irish, 13.8% were American, and 10.5% were English.[14]
Of the 55,244 households, 31.1% had children under the age of 18 living with them, 47.5% were married couples living together, 14.1% had a female householder with no husband present, 33.2% were non-families, and 27.7% of all households were made up of individuals. The average household size was 2.45 and the average family size was 2.96. The median age was 40.5 years.[12]
The median income for a household in the county was $44,141 and the median income for a family was $53,678. Males had a median income of $43,209 versus $30,811 for females. The per capita income for the county was $22,110. About 11.1% of families and 15.9% of the population were below the poverty line, including 24.5% of those under age 18 and 7.4% of those age 65 or over.[15]
Metropolitan Statistical Area
The Springfield metropolitan area was first defined in 1950. Then known as the Springfield Standard Metropolitan Area (Springfield SMA), it consisted of a single county – Clark – and had a population of 111,661.[16][17] Following a term change by the Bureau of the Budget (present-day Office of Management and Budget) in 1959, the Springfield SMA became the Springfield Standard Metropolitan Statistical Area (Springfield SMSA).[18] By the census of 1960, the population had grown to 131,440, an 18 percent increase over the previous census.[17] Champaign County was added to the Springfield SMSA in 1973. The two-county area had a combined population of 187,606 in 1970.[17]
In 1983, the official name was shortened to the Springfield Metropolitan Statistical Area (Springfield MSA).[18] That same year, Dayton and Springfield were grouped together as the Dayton-Springfield Metropolitan Statistical Area. The new MSA consisted of four counties – Clark, Greene, Miami, and Montgomery.[19] This arrangement remained unchanged until 2003, when the MSA was split with Springfield's newly defined metropolitan area including only Clark County.[20]
Politics
County Commissioners - Rick Lohnes (R), Melanie Flax Wilt (R) and Lowell McGlothlin (R)
Sheriff - Deb Burchett (R)
Recorder - Nancy Pence (R)
Treasurer - Stephen Metzger (D)
Auditor - John Federer (R)
Prosecuting Attorney - D Andrew Wilson (R)
Coroner - Richard Marsh, MD (D)
Judicial
Municipal Court
Clerk of Courts - Guy Ferguson (D)
Judges - Denise Moody (R), Eugene Nevius (D), Thomas Trempe (D)
Common Pleas Court
Clerk of Courts - Melissa Tuttle (R)
General Division - Judges Douglas Rastatter (R) and Richard O'Neil (D)
Domestic Relations - Judge Thomas Capper (R)
Juvenile Court - Judge Joseph Monnin (D)
Probate - Judge Richard Carey (R)
| Year | Republican | Democratic | Third parties |
|---|---|---|---|
| 2016 | 56.9% 35,205 | 37.7% 23,328 | 5.4% 3,360 |
| 2012 | 49.5% 31,820 | 48.7% 31,297 | 1.8% 1,184 |
| 2008 | 50.2% 33,634 | 47.7% 31,958 | 2.1% 1,395 |
| 2004 | 50.8% 34,941 | 48.7% 33,535 | 0.5% 331 |
| 2000 | 48.1% 27,660 | 48.6% 27,984 | 3.3% 1,915 |
| 1996 | 38.6% 22,297 | 48.3% 27,890 | 13.2% 7,615 |
| 1992 | 37.8% 24,011 | 42.0% 26,692 | 20.2% 12,835 |
| 1988 | 57.9% 32,729 | 41.1% 23,247 | 0.9% 527 |
| 1984 | 62.1% 35,831 | 36.6% 21,154 | 1.3% 759 |
| 1980 | 50.4% 27,237 | 41.9% 22,630 | 7.7% 4,148 |
| 1976 | 48.9% 26,745 | 47.8% 26,135 | 3.3% 1,780 |
| 1972 | 61.8% 34,447 | 35.4% 19,725 | 2.8% 1,578 |
| 1968 | 43.6% 23,748 | 44.1% 24,029 | 12.3% 6,714 |
| 1964 | 35.8% 19,112 | 64.2% 34,275 | |
| 1960 | 57.7% 30,588 | 42.3% 22,456 | |
| 1956 | 61.9% 28,767 | 38.1% 17,680 | |
| 1952 | 56.9% 27,464 | 43.1% 20,786 | |
| 1948 | 51.6% 18,548 | 48.0% 17,236 | 0.4% 133 |
| 1944 | 49.8% 22,207 | 50.2% 22,362 | |
| 1940 | 44.4% 20,681 | 55.6% 25,888 | |
| 1936 | 36.4% 15,483 | 61.4% 26,138 | 2.2% 919 |
| 1932 | 51.5% 19,028 | 46.9% 17,314 | 1.7% 610 |
| 1928 | 71.7% 26,666 | 27.7% 10,316 | 0.5% 201 |
| 1924 | 66.4% 20,340 | 27.5% 8,415 | 6.1% 1,860 |
| 1920 | 57.5% 19,869 | 40.8% 14,097 | 1.7% 574 |
| 1916 | 47.6% 8,715 | 48.4% 8,848 | 4.0% 730 |
| 1912 | 36.2% 6,036 | 31.3% 5,217 | 32.6% 5,440 |
| 1908 | 53.0% 8,917 | 38.8% 6,529 | 8.3% 1,388 |
| 1904 | 62.0% 9,355 | 30.3% 4,565 | 7.7% 1,164 |
| 1900 | 57.3% 8,806 | 40.7% 6,243 | 2.0% 308 |
| 1896 | 53.9% 7,667 | 44.9% 6,382 | 1.3% 179 |
| 1892 | 50.1% 6,214 | 42.4% 5,255 | 7.5% 933 |
| 1888 | 51.8% 7,128 | 42.6% 5,860 | 5.6% 774 |
| 1884 | 57.3% 7,517 | 39.6% 5,204 | 3.1% 408 |
| 1880 | 59.0% 6,229 | 39.6% 4,179 | 1.5% 158 |
| 1876 | 58.9% 5,136 | 40.6% 3,536 | 0.6% 48 |
| 1872 | 60.8% 4,095 | 38.8% 2,612 | 0.4% 28 |
Education
Public school districts
- Clark - Shawnee Local School District
- Shawnee High School, Springfield (the Braves)
- Greenon Local School District
- Greenon High School, Springfield (the Knights)
- Northeastern Local School District
- Kenton Ridge High School, Springfield (the Cougars)
- Northeastern High School, Springfield (the Jets)
- Northwestern Local School District
- Northwestern High School, Springfield (the Warriors)
- Southeastern Local Schools
- Southeastern High School, South Charleston (the Trojans)
- Springfield City School District
- Springfield City High School, (the Wildcats)
- Tecumseh Local School District
- Tecumseh High School, New Carlisle (the Arrows)
Colleges and Universities
- Clark State Community College
- Clark State Community College, Springfield (the Eagles)
- Wittenberg University
- Wittenberg University, Springfield (the Tigers)
Communities
Cities
- New Carlisle
- Springfield (county seat)
Villages
Townships
https://web.archive.org/web/20160715023447/http://www.ohiotownships.org/township-websites
Census-designated places
Unincorporated communities
See also
References
- ↑ "Ohio County Profiles: Clark County" (PDF). Ohio Department of Development. Archived from the original (PDF) on 2007-04-21. Retrieved 2007-04-28.
- 1 2 "State & County QuickFacts". United States Census Bureau. Retrieved February 7, 2015.
- ↑ "Find a County". National Association of Counties. Archived from the original on 2011-05-31. Retrieved 2011-06-07.
- ↑ Gannett, Henry (1905). The Origin of Certain Place Names in the United States. Govt. Print. Off. p. 82.
- ↑ "2010 Census Gazetteer Files". United States Census Bureau. August 22, 2012. Retrieved January 19, 2017.
- ↑ "Population and Housing Unit Estimates". Retrieved June 9, 2017.
- ↑ "U.S. Decennial Census". United States Census Bureau. Archived from the original on May 12, 2015. Retrieved February 7, 2015.
- ↑ "Historical Census Browser". University of Virginia Library. Retrieved February 7, 2015.
- ↑ Forstall, Richard L., ed. (March 27, 1995). "Population of Counties by Decennial Census: 1900 to 1990". United States Census Bureau. Retrieved February 7, 2015.
- ↑ "Census 2000 PHC-T-4. Ranking Tables for Counties: 1990 and 2000" (PDF). United States Census Bureau. April 2, 2001. Retrieved February 7, 2015.
- ↑ "American FactFinder". United States Census Bureau. Archived from the original on 2013-09-11. Retrieved 2008-01-31.
- 1 2 3 "DP-1 Profile of General Population and Housing Characteristics: 2010 Demographic Profile Data". United States Census Bureau. Retrieved 2015-12-27.
- ↑ "Population, Housing Units, Area, and Density: 2010 - County". United States Census Bureau. Retrieved 2015-12-27.
- ↑ "DP02 SELECTED SOCIAL CHARACTERISTICS IN THE UNITED STATES – 2006-2010 American Community Survey 5-Year Estimates". United States Census Bureau. Retrieved 2015-12-27.
- ↑ "DP03 SELECTED ECONOMIC CHARACTERISTICS – 2006-2010 American Community Survey 5-Year Estimates". United States Census Bureau. Retrieved 2015-12-27.
- ↑ "Standard Metropolitan Areas (SMAs) and Components" (TXT). Standard Metropolitan Areas defined by the Bureau of the Budget, October 13, 1950. United States Census Bureau, Population Division. 2000-12-14. Retrieved 2009-02-07.
- 1 2 3 "Ohio - Population of Counties by Decennial Census: 1900 to 1990". United States Census Bureau, Population Division. 1995-03-27. Retrieved 2009-02-07.
- 1 2 "About Metropolitan and Micropolitan Statistical Areas". United States Census Bureau, Population Division. Retrieved 2009-02-07.
- ↑ "Metropolitan Areas and Components, 1983" (TXT). Metropolitan Areas defined by Office of Management and Budget, June 27, 1983. United States Census Bureau, Population Division. 2001-03-01. Retrieved 2009-02-07.
- ↑ "Metropolitan Statistical Areas and Components, 2003" (TXT). Metropolitan statistical areas defined by Office of Management and Budget, June 6, 2003. United States Census Bureau, Population Division. 2003-07-10. Retrieved 2009-02-07.
- ↑ Leip, David. "Dave Leip's Atlas of U.S. Presidential Elections". uselectionatlas.org. Retrieved 2018-05-01.
External links
Places adjacent to Clark County, Ohio | ||||||||||
|---|---|---|---|---|---|---|---|---|---|---|
| ||||||||||
Municipalities and communities of Clark County, Ohio, United States | ||
|---|---|---|
| Cities | | |
| Villages | ||
| Townships | ||
| CDPs | ||
| Unincorporated communities | ||
| Ghost towns | ||
| Footnotes | ‡This populated place also has portions in an adjacent county or counties | |