Grant County, West Virginia
| Grant County, West Virginia | |
|---|---|
 | |
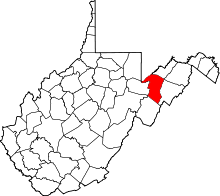 Location in the U.S. state of West Virginia | |
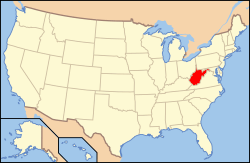 West Virginia's location in the U.S. | |
| Founded | February 14, 1866 |
| Named for | Ulysses S. Grant |
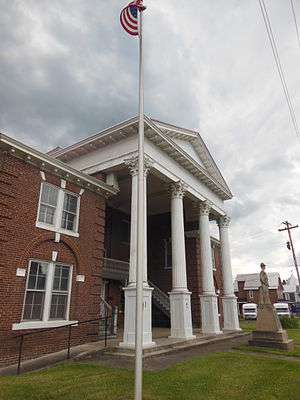
| Seat | Petersburg |
| Largest city | Petersburg |
| Area | |
| • Total | 480 sq mi (1,243 km2) |
| • Land | 477 sq mi (1,235 km2) |
| • Water | 2.9 sq mi (8 km2), 0.6% |
| Population (est.) | |
| • (2015) | 11,766 |
| • Density | 25/sq mi (10/km2) |
| Congressional district | 1st |
| Time zone | Eastern: UTC−5/−4 |
| Website |
www |
Grant County is a county in the U.S. state of West Virginia. As of the 2010 census, the population was 11,937.[1] Its county seat is Petersburg.[2] The county was created from Hardy County in 1866 and named for General Ulysses Simpson Grant.[3]
Most of the 47 people killed in the 1985 Election day floods were in Pendleton and Grant counties, according to the National Weather Service.[4] At Franklin, the Pendleton County seat, the South Branch of the Potomac River crested at 22.6 feet during the incident. Flood stage in the shallow riverbed was only 7 feet.[4]
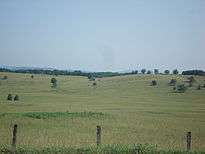
Geography
According to the U.S. Census Bureau, the county has a total area of 480 square miles (1,200 km2), of which 477 square miles (1,240 km2) is land and 2.9 square miles (7.5 km2) (0.6%) is water.[5]
Major highways
Adjacent counties
- Mineral County (northeast)
- Hardy County (east)
- Pendleton County (south)
- Randolph County (southwest)
- Tucker County (west)
- Preston County (northwest)
- Garrett County, Maryland (northwest)
National protected areas
Demographics
| Historical population | |||
|---|---|---|---|
| Census | Pop. | %± | |
| 1870 | 4,467 | — | |
| 1880 | 5,542 | 24.1% | |
| 1890 | 6,802 | 22.7% | |
| 1900 | 7,275 | 7.0% | |
| 1910 | 7,838 | 7.7% | |
| 1920 | 8,993 | 14.7% | |
| 1930 | 8,441 | −6.1% | |
| 1940 | 8,805 | 4.3% | |
| 1950 | 8,756 | −0.6% | |
| 1960 | 8,304 | −5.2% | |
| 1970 | 8,607 | 3.6% | |
| 1980 | 10,210 | 18.6% | |
| 1990 | 10,428 | 2.1% | |
| 2000 | 11,299 | 8.4% | |
| 2010 | 11,937 | 5.6% | |
| Est. 2016 | 11,732 | [6] | −1.7% |
| U.S. Decennial Census[7] 1790–1960[8] 1900–1990[9] 1990–2000[10] 2010–2015[1] | |||
2000 census
As of the census[11] of 2000, there were 11,299 people, 4,591 households, and 3,273 families residing in the county. The population density was 24 people per square mile (9/km²). There were 6,105 housing units at an average density of 13 per square mile (5/km²). The racial makeup of the county was 98.33% White, 0.67% Black or African American, 0.26% Indigenous American, 0.14% Asian, 0.02% Pacific Islander, 0.13% from other races, and 0.45% from two or more races. 0.55% of the population were Hispanic or Latino of any race.
There were 4,591 households out of which 30.20% had children under the age of 18 living with them, 59.50% were married couples living together, 8.20% had a female householder with no husband present, and 28.70% were non-families. 24.50% of all households were made up of individuals and 11.30% had someone living alone who was 65 years of age or older. The average household size was 2.43 and the average family size was 2.87.
In the county, the population was spread out with 22.70% under the age of 18, 7.80% from 18 to 24, 27.50% from 25 to 44, 26.80% from 45 to 64, and 15.30% who were 65 years of age or older. The median age was 39 years. For every 100 females there were 97.70 males. For every 100 females age 18 and over, there were 94.50 males.
The median income for a household in the county was $28,916, and the median income for a family was $33,813. Males had a median income of $24,796 versus $18,354 for females. The per capita income for the county was $15,696. About 12.60% of families and 16.30% of the population were below the poverty line, including 21.00% of those under age 18 and 18.70% of those age 65 or over.
2010 census
As of the 2010 United States Census, there were 11,937 people, 4,941 households, and 3,435 families residing in the county.[12] The population density was 25.0 inhabitants per square mile (9.7/km2). There were 6,366 housing units at an average density of 13.3 per square mile (5.1/km2).[13] The racial makeup of the county was 97.7% white, 0.7% black or African American, 0.2% Asian, 0.2% American Indian, 0.5% from other races, and 0.9% from two or more races. Those of Hispanic or Latino origin made up 1.0% of the population.[12] In terms of ancestry, 26.9% were German, 15.0% were American, 9.3% were Irish, and 5.3% were English.[14]
Of the 4,941 households, 29.3% had children under the age of 18 living with them, 56.3% were married couples living together, 8.3% had a female householder with no husband present, 30.5% were non-families, and 25.7% of all households were made up of individuals. The average household size was 2.39 and the average family size was 2.84. The median age was 44.0 years.[12]
The median income for a household in the county was $35,593 and the median income for a family was $46,193. Males had a median income of $35,000 versus $24,643 for females. The per capita income for the county was $19,358. About 10.6% of families and 12.9% of the population were below the poverty line, including 15.0% of those under age 18 and 12.8% of those age 65 or over.[15]
Communities
City
- Petersburg (county seat)
Town
Unincorporated communities
Politics
Whereas most of West Virginia has become a Republican bastion in the 21st century after having leaned heavily Democratic between the New Deal and Bill Clinton, Grant County has always been among the most rock-ribbed Republican counties in the country. Since Grant County was created in 1866, no Democrat has managed to receive even forty percent of the county’s vote in any Presidential election, and only Lyndon Johnson in 1964 and Jimmy Carter in 1976 ever received over thirty percent. The only Republican to ever lose Grant County has been William Howard Taft in 1912 when the Republican Party was divided and Progressive Theodore Roosevelt claimed the majority of the county’s vote.
| Year | Republican | Democratic | Third parties |
|---|---|---|---|
| 2016 | 87.5% 4,346 | 10.3% 512 | 2.2% 107 |
| 2012 | 82.5% 3,783 | 15.7% 718 | 1.9% 87 |
| 2008 | 75.1% 3,166 | 23.6% 997 | 1.3% 55 |
| 2004 | 80.5% 4,063 | 19.1% 963 | 0.4% 21 |
| 2000 | 78.8% 3,571 | 19.7% 891 | 1.6% 72 |
| 1996 | 60.5% 2,599 | 28.1% 1,206 | 11.5% 492 |
| 1992 | 64.3% 2,762 | 23.5% 1,011 | 12.2% 525 |
| 1988 | 77.9% 3,215 | 21.6% 893 | 0.5% 22 |
| 1984 | 81.6% 3,715 | 18.2% 828 | 0.2% 11 |
| 1980 | 75.2% 3,452 | 22.7% 1,041 | 2.1% 98 |
| 1976 | 69.2% 2,976 | 30.8% 1,323 | |
| 1972 | 85.3% 3,556 | 14.7% 614 | |
| 1968 | 73.8% 2,936 | 19.8% 786 | 6.4% 256 |
| 1964 | 62.3% 2,464 | 37.8% 1,494 | |
| 1960 | 78.6% 3,333 | 21.4% 908 | |
| 1956 | 84.3% 3,408 | 15.7% 634 | |
| 1952 | 83.0% 3,282 | 17.0% 674 | |
| 1948 | 80.8% 2,816 | 19.1% 664 | 0.1% 4 |
| 1944 | 84.0% 2,996 | 16.0% 570 | |
| 1940 | 78.9% 3,195 | 21.2% 857 | |
| 1936 | 74.5% 2,923 | 25.4% 995 | 0.1% 5 |
| 1932 | 72.2% 2,477 | 26.8% 920 | 1.1% 36 |
| 1928 | 82.8% 2,648 | 17.0% 542 | 0.2% 7 |
| 1924 | 75.5% 2,344 | 21.2% 658 | 3.3% 103 |
| 1920 | 82.2% 2,417 | 16.7% 492 | 1.1% 33 |
| 1916 | 78.4% 1,438 | 21.3% 391 | 0.3% 5 |
| 1912 | 20.0% 349 | 20.4% 356 | 59.6% 1,038 |
See also
References
- 1 2 "State & County QuickFacts". United States Census Bureau. Archived from the original on July 11, 2011. Retrieved January 10, 2014.
- ↑ "Find a County". National Association of Counties. Archived from the original on 2011-05-31. Retrieved 2011-06-07.
- ↑ "Archived copy". Archived from the original on 2012-12-30. Retrieved 2013-01-29.
- 1 2 West Virginia Gazette: "Remembering the '85 floods" (D. White) 4 Nov 2010
- ↑ "2010 Census Gazetteer Files". United States Census Bureau. August 22, 2012. Retrieved July 24, 2015.
- ↑ "Population and Housing Unit Estimates". Retrieved June 9, 2017.
- ↑ "U.S. Decennial Census". United States Census Bureau. Archived from the original on May 12, 2015. Retrieved January 10, 2014.
- ↑ "Historical Census Browser". University of Virginia Library. Retrieved January 10, 2014.
- ↑ "Population of Counties by Decennial Census: 1900 to 1990". United States Census Bureau. Retrieved January 10, 2014.
- ↑ "Census 2000 PHC-T-4. Ranking Tables for Counties: 1990 and 2000" (PDF). United States Census Bureau. Retrieved January 10, 2014.
- ↑ "American FactFinder". United States Census Bureau. Archived from the original on 2013-09-11. Retrieved 2011-05-14.
- 1 2 3 "DP-1 Profile of General Population and Housing Characteristics: 2010 Demographic Profile Data". United States Census Bureau. Retrieved 2016-04-03.
- ↑ "Population, Housing Units, Area, and Density: 2010 - County". United States Census Bureau. Retrieved 2016-04-03.
- ↑ "DP02 SELECTED SOCIAL CHARACTERISTICS IN THE UNITED STATES – 2006-2010 American Community Survey 5-Year Estimates". United States Census Bureau. Retrieved 2016-04-03.
- ↑ "DP03 SELECTED ECONOMIC CHARACTERISTICS – 2006-2010 American Community Survey 5-Year Estimates". United States Census Bureau. Retrieved 2016-04-03.
- ↑ Leip, David. "Dave Leip's Atlas of U.S. Presidential Elections". uselectionatlas.org. Retrieved 2018-03-27.
External links
| Wikimedia Commons has media related to Grant County, West Virginia. |
- Grant County - Gateway to the Potomac Highlands
- Grant County Chamber of Commerce
- Grant County Press
- Grant County Development Authority
- Grant County Schools
- Grant County Historical/Genealogy Society, Inc.
- WVGenWeb Grant County
Places adjacent to Grant County, West Virginia | ||||||||||
|---|---|---|---|---|---|---|---|---|---|---|
| ||||||||||
Municipalities and communities of Grant County, West Virginia, United States | ||
|---|---|---|
| City | | |
| Town | ||
| Unincorporated communities | ||
| Footnotes | ‡This populated place also has portions in an adjacent county or counties | |