Defiance County, Ohio
| Defiance County, Ohio | ||
|---|---|---|
 | ||
| ||
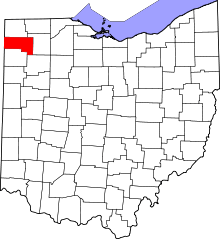 Location in the U.S. state of Ohio | ||
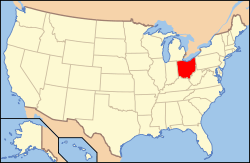 Ohio's location in the U.S. | ||
| Founded | April 7, 1845[1] | |
| Named for | Fort Defiance | |
| Seat | Defiance | |
| Largest city | Defiance | |
| Area | ||
| • Total | 414 sq mi (1,072 km2) | |
| • Land | 411 sq mi (1,064 km2) | |
| • Water | 2.7 sq mi (7 km2), 0.7% | |
| Population | ||
| • (2010) | 39,037 | |
| • Density | 95/sq mi (37/km2) | |
| Congressional district | 5th | |
| Time zone | Eastern: UTC−5/−4 | |
| Website |
www | |

Defiance County is a county located in the U.S. state of Ohio. As of the 2010 census, the population was 39,037.[2] Its county seat is Defiance.[3] The county was named after an early Army fortification, Fort Defiance, which was so named by Mad Anthony Wayne to signify the settlers' "defiance" of the Indians.[4][5]
The Defiance, OH Micropolitan Statistical Area includes all of Defiance County.
Geography
According to the U.S. Census Bureau, the county has a total area of 414 square miles (1,070 km2), of which 411 square miles (1,060 km2) is land and 2.7 square miles (7.0 km2) (0.7%) is water.[6]
Adjacent counties
- Williams County (north)
- Henry County (east)
- Putnam County (southeast)
- Paulding County (south)
- Allen County, Indiana (southwest)
- DeKalb County, Indiana (west)
Demographics
| Historical population | |||
|---|---|---|---|
| Census | Pop. | %± | |
| 1850 | 6,966 | — | |
| 1860 | 11,886 | 70.6% | |
| 1870 | 15,719 | 32.2% | |
| 1880 | 22,515 | 43.2% | |
| 1890 | 25,769 | 14.5% | |
| 1900 | 26,387 | 2.4% | |
| 1910 | 24,498 | −7.2% | |
| 1920 | 24,549 | 0.2% | |
| 1930 | 22,714 | −7.5% | |
| 1940 | 24,367 | 7.3% | |
| 1950 | 25,925 | 6.4% | |
| 1960 | 31,508 | 21.5% | |
| 1970 | 36,949 | 17.3% | |
| 1980 | 39,987 | 8.2% | |
| 1990 | 39,350 | −1.6% | |
| 2000 | 39,500 | 0.4% | |
| 2010 | 39,037 | −1.2% | |
| Est. 2017 | 38,156 | [7] | −2.3% |
| U.S. Decennial Census[8] 1790-1960[9] 1900-1990[10] 1990-2000[11] 2010-2017[2] | |||
2000 census
As of the census[12] of 2000, there were 39,500 people, 15,138 households, and 11,020 families residing in the county. The population density was 96 people per square mile (37/km²). There were 16,040 housing units at an average density of 39 per square mile (15/km²). The racial makeup of the county was 92.59% White, 1.75% Black or African American, 0.26% Native American, 0.36% Asian, 0.02% Pacific Islander, 3.59% from other races, and 1.43% from two or more races. 7.23% of the population were Hispanic or Latino of any race. 45.6% were of German, 13.5% American, 6.8% Irish and 5.1% English ancestry according to Census 2000.
There were 15,138 households out of which 34.30% had children under the age of 18 living with them, 58.90% were married couples living together, 9.60% had a female householder with no husband present, and 27.20% were non-families. 23.00% of all households were made up of individuals and 9.50% had someone living alone who was 65 years of age or older. The average household size was 2.57 and the average family size was 3.02.
In the county, the population was spread out with 26.50% under the age of 18, 9.20% from 18 to 24, 27.40% from 25 to 44, 23.90% from 45 to 64, and 12.90% who were 65 years of age or older. The median age was 36 years. For every 100 females there were 97.30 males. For every 100 females age 18 and over, there were 94.90 males.
The median income for a household in the county was $44,938, and the median income for a family was $50,876. Males had a median income of $37,936 versus $23,530 for females. The per capita income for the county was $19,667. About 4.50% of families and 5.60% of the population were below the poverty line, including 6.40% of those under age 18 and 5.30% of those age 65 or over.
2010 census
As of the 2010 United States Census, there were 39,037 people, 15,268 households, and 10,792 families residing in the county.[13] The population density was 94.9 inhabitants per square mile (36.6/km2). There were 16,729 housing units at an average density of 40.7 per square mile (15.7/km2).[14] The racial makeup of the county was 92.8% white, 1.9% black or African American, 0.3% Asian, 0.3% American Indian, 2.8% from other races, and 2.0% from two or more races. Those of Hispanic or Latino origin made up 8.7% of the population.[13] In terms of ancestry, 42.3% were German, 12.5% were Irish, 9.6% were English, and 7.7% were American.[15]
Of the 15,268 households, 32.4% had children under the age of 18 living with them, 55.1% were married couples living together, 10.8% had a female householder with no husband present, 29.3% were non-families, and 24.6% of all households were made up of individuals. The average household size was 2.51 and the average family size was 2.97. The median age was 39.4 years.[13]
The median income for a household in the county was $44,480 and the median income for a family was $54,472. Males had a median income of $44,354 versus $30,610 for females. The per capita income for the county was $22,139. About 11.2% of families and 12.7% of the population were below the poverty line, including 18.0% of those under age 18 and 7.1% of those age 65 or over.[16]
Politics
Based on how closely the county came to matching the nationwide vote for the winning Presidential candidate, Defiance deviated the least of any county from 1980 to 2004. In 2004, the difference between the points swing vs. the national trend was just 0.05%. All the other elections since 1980 have been tight margins: 4.6% in 2000, 0.4% in 1996, 0.04% (exactly) in 1992, 0.6% in 1988, 0.03 in 1984, and 2.1% in 1980.[17]
In 2008, it lost its bellwether status, voting for John McCain with 54% of the vote in the year that Barack Obama won the presidency.[18]
| Year | Republican | Democratic | Third parties |
|---|---|---|---|
| 2016 | 63.7% 11,688 | 29.3% 5,368 | 7.1% 1,293 |
| 2012 | 55.5% 10,176 | 42.2% 7,732 | 2.4% 431 |
| 2008 | 54.1% 10,407 | 43.7% 8,399 | 2.2% 426 |
| 2004 | 61.6% 11,397 | 37.7% 6,975 | 0.8% 144 |
| 2000 | 58.7% 9,540 | 38.0% 6,175 | 3.3% 527 |
| 1996 | 47.0% 7,469 | 39.9% 6,343 | 13.1% 2,081 |
| 1992 | 41.8% 7,195 | 33.3% 5,735 | 24.9% 4,281 |
| 1988 | 63.1% 9,566 | 36.0% 5,448 | 0.9% 139 |
| 1984 | 67.9% 10,951 | 31.0% 5,004 | 1.1% 175 |
| 1980 | 59.8% 9,358 | 32.6% 5,096 | 7.6% 1,185 |
| 1976 | 55.0% 7,526 | 42.8% 5,850 | 2.2% 303 |
| 1972 | 65.4% 8,914 | 32.1% 4,377 | 2.5% 339 |
| 1968 | 52.6% 7,348 | 40.7% 5,686 | 6.6% 925 |
| 1964 | 36.7% 5,048 | 63.3% 8,707 | |
| 1960 | 63.1% 8,912 | 36.9% 5,207 | |
| 1956 | 69.0% 8,786 | 31.0% 3,941 | |
| 1952 | 68.0% 8,834 | 32.0% 4,161 | |
| 1948 | 56.9% 5,927 | 42.8% 4,454 | 0.3% 28 |
| 1944 | 67.2% 7,450 | 32.8% 3,634 | |
| 1940 | 65.0% 8,010 | 35.0% 4,313 | |
| 1936 | 42.8% 5,000 | 48.1% 5,608 | 9.1% 1,062 |
| 1932 | 36.5% 3,871 | 61.7% 6,532 | 1.8% 192 |
| 1928 | 64.3% 6,289 | 35.7% 3,487 | |
| 1924 | 52.6% 4,841 | 35.0% 3,227 | 12.4% 1,145 |
| 1920 | 60.5% 5,987 | 37.6% 3,723 | 1.8% 180 |
| 1916 | 42.4% 2,565 | 55.5% 3,359 | 2.2% 131 |
| 1912 | 15.8% 872 | 50.6% 2,784 | 33.6% 1,848 |
| 1908 | 39.1% 2,531 | 57.9% 3,754 | 3.0% 197 |
| 1904 | 47.4% 3,032 | 50.3% 3,216 | 2.3% 144 |
| 1900 | 40.8% 2,684 | 57.2% 3,766 | 2.0% 130 |
| 1896 | 36.0% 2,414 | 63.2% 4,239 | 0.8% 50 |
| 1892 | 35.1% 2,062 | 56.4% 3,311 | 8.6% 503 |
| 1888 | 37.2% 2,245 | 59.2% 3,567 | 3.6% 218 |
| 1884 | 39.6% 2,184 | 59.6% 3,288 | 0.9% 47 |
| 1880 | 38.4% 1,977 | 61.0% 3,140 | 0.6% 30 |
| 1876 | 34.4% 1,520 | 65.4% 2,888 | 0.2% 7 |
| 1872 | 38.3% 1,093 | 60.3% 1,720 | 1.4% 40 |
Communities

City
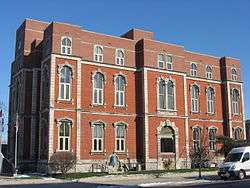
- Defiance (county seat)
Villages
Townships
https://web.archive.org/web/20160715023447/http://www.ohiotownships.org/township-websites
Unincorporated communities
- Ashwood
- Ayersville
- Brunersburg
- Evansport
- Farmer
- Independence
- Jewell
- Mark Center
- Moats
- Rosedale
- Six Corners
- The Bend
In popular culture
The closeness of elections in Defiance County has also been referenced in fiction; the ABC political drama Scandal in its second season had as the center of the ongoing plot of the first half of that season, a vote manipulation conspiracy which bent the presidential election towards Republican candidate Fitzgerald Grant based on tampering of the voting machines in Defiance County.
See also
References
- ↑ "Ohio County Profiles: Defiance County" (PDF). Ohio Department of Development. Archived from the original (PDF) on 2007-06-21. Retrieved 2007-04-28.
- 1 2 "State & County QuickFacts". United States Census Bureau. Archived from the original on July 9, 2011. Retrieved February 7, 2015.
- ↑ "Find a County". National Association of Counties. Archived from the original on 2011-05-31. Retrieved 2011-06-07.
- ↑ "Maumee Valley Heritage Corridor". Retrieved 2007-04-05.
- ↑ Gannett, Henry (1905). The Origin of Certain Place Names in the United States. Govt. Print. Off. p. 102.
- ↑ "2010 Census Gazetteer Files". United States Census Bureau. August 22, 2012. Archived from the original on May 4, 2014. Retrieved February 7, 2015.
- ↑ "Population and Housing Unit Estimates". Retrieved June 9, 2017.
- ↑ "U.S. Decennial Census". United States Census Bureau. Archived from the original on May 12, 2015. Retrieved February 7, 2015.
- ↑ "Historical Census Browser". University of Virginia Library. Retrieved February 7, 2015.
- ↑ Forstall, Richard L., ed. (March 27, 1995). "Population of Counties by Decennial Census: 1900 to 1990". United States Census Bureau. Retrieved February 7, 2015.
- ↑ "Census 2000 PHC-T-4. Ranking Tables for Counties: 1990 and 2000" (PDF). United States Census Bureau. April 2, 2001. Retrieved February 7, 2015.
- ↑ "American FactFinder". United States Census Bureau. Archived from the original on 2013-09-11. Retrieved 2008-01-31.
- 1 2 3 "DP-1 Profile of General Population and Housing Characteristics: 2010 Demographic Profile Data". United States Census Bureau. Retrieved 2015-12-27.
- ↑ "Population, Housing Units, Area, and Density: 2010 - County". United States Census Bureau. Retrieved 2015-12-27.
- ↑ "DP02 SELECTED SOCIAL CHARACTERISTICS IN THE UNITED STATES – 2006-2010 American Community Survey 5-Year Estimates". United States Census Bureau. Retrieved 2015-12-27.
- ↑ "DP03 SELECTED ECONOMIC CHARACTERISTICS – 2006-2010 American Community Survey 5-Year Estimates". United States Census Bureau. Retrieved 2015-12-27.
- ↑ "Top 50 bellwethers for presidential election trends". Beyond Red & Blue. Retrieved 2018-05-01.
- 1 2 Leip, David. "Dave Leip's Atlas of U.S. Presidential Elections". uselectionatlas.org. Retrieved 2018-05-01.
External links
Places adjacent to Defiance County, Ohio | ||||||||||
|---|---|---|---|---|---|---|---|---|---|---|
| ||||||||||
Municipalities and communities of Defiance County, Ohio, United States | ||
|---|---|---|
| City | | |
| Villages | ||
| Townships | ||
| Unincorporated communities | ||
| Ghost towns | ||