Coshocton County, Ohio
| Coshocton County, Ohio | ||
|---|---|---|
 | ||
| ||
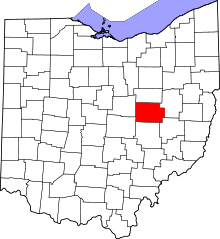 Location in the U.S. state of Ohio | ||
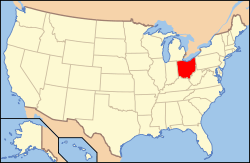 Ohio's location in the U.S. | ||
| Founded | April 1, 1811 | |
| Named for | "union of waters" or "black bear crossing" in Delaware (Lenape) language | |
| Seat | Coshocton | |
| Largest city | Coshocton | |
| Area | ||
| • Total | 567 sq mi (1,469 km2) | |
| • Land | 564 sq mi (1,461 km2) | |
| • Water | 3.6 sq mi (9 km2), 0.6% | |
| Population | ||
| • (2010) | 36,901 | |
| • Density | 65/sq mi (25/km2) | |
| Congressional district | 7th | |
| Time zone | Eastern: UTC−5/−4 | |
| Website |
www | |

Coshocton County is a county located in the U.S. state of Ohio. As of the 2010 census, the population was 36,901.[1] Its county seat is Coshocton.[2] The county was formed on January 31, 1810 from portions of Muskingum and Tuscarawas Counties and later organized in 1811.[3] Its name comes from the Delaware Indian language and has been translated as "union of waters" or "black bear crossing".[4]
The Coshocton, OH Micropolitan Statistical Area includes all of Coshocton County.
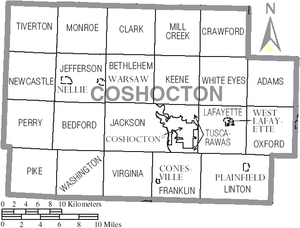
Geography
According to the U.S. Census Bureau, the county has a total area of 567 square miles (1,470 km2), of which 564 square miles (1,460 km2) is land and 3.6 square miles (9.3 km2) (0.6%) is water.[5]
Adjacent counties
- Holmes County (north)
- Tuscawaras County (east)
- Guernsey County (southeast)
- Muskingum County (south)
- Licking County (southwest)
- Knox County (west)
Demographics
| Historical population | |||
|---|---|---|---|
| Census | Pop. | %± | |
| 1820 | 7,086 | — | |
| 1830 | 11,161 | 57.5% | |
| 1840 | 21,590 | 93.4% | |
| 1850 | 25,674 | 18.9% | |
| 1860 | 25,032 | −2.5% | |
| 1870 | 23,600 | −5.7% | |
| 1880 | 26,642 | 12.9% | |
| 1890 | 26,703 | 0.2% | |
| 1900 | 29,337 | 9.9% | |
| 1910 | 30,121 | 2.7% | |
| 1920 | 29,595 | −1.7% | |
| 1930 | 28,976 | −2.1% | |
| 1940 | 30,594 | 5.6% | |
| 1950 | 31,141 | 1.8% | |
| 1960 | 32,224 | 3.5% | |
| 1970 | 33,486 | 3.9% | |
| 1980 | 36,024 | 7.6% | |
| 1990 | 35,427 | −1.7% | |
| 2000 | 36,655 | 3.5% | |
| 2010 | 36,901 | 0.7% | |
| Est. 2017 | 36,544 | [6] | −1.0% |
| U.S. Decennial Census[7] 1790-1960[8] 1900-1990[9] 1990-2000[10] 2010-2017[1] | |||
2000 census
As of the census[11] of 2000, there were 36,655 people, 14,356 households, and 10,164 families residing in the county. The population density was 65 people per square mile (25/km²). There were 16,107 housing units at an average density of 29 per square mile (11/km²). The racial makeup of the county was 97.35% White, 1.09% Black or African American, 0.17% Native American, 0.32% Asian, 0.03% Pacific Islander, 0.20% from other races, and 0.84% from two or more races. 0.59% of the population were Hispanic or Latino of any race. 29.4% were of German, 23.4% American, 11.6% English and 9.3% Irish ancestry according to Census 2000. 93.9% spoke English, 2.4% German, 1.5% Pennsylvania Dutch, and 0.9% Dutch as their first language.[12]
There were 14,356 households out of which 32.60% had children under the age of 18 living with them, 57.80% were married couples living together, 9.20% had a female householder with no husband present, and 29.20% were non-families. 25.40% of all households were made up of individuals and 11.90% had someone living alone who was 65 years of age or older. The average household size was 2.52 and the average family size was 3.01.
In the county, the population was spread out with 26.20% under the age of 18, 7.80% from 18 to 24, 27.40% from 25 to 44, 24.00% from 45 to 64, and 14.70% who were 65 years of age or older. The median age was 38 years. For every 100 females, there were 95.50 males. For every 100 females age 18 and over, there were 92.70 males.
The median income for a household in the county was $34,701, and the median income for a family was $41,676. Males had a median income of $31,095 versus $21,276 for females. The per capita income for the county was $16,364. About 7.00% of families and 9.10% of the population were below the poverty line, including 10.40% of those under age 18 and 9.10% of those age 65 or over.
2010 census
As of the 2010 United States Census, there were 36,901 people, 14,658 households, and 10,089 families residing in the county.[13] The population density was 65.4 inhabitants per square mile (25.3/km2). There were 16,545 housing units at an average density of 29.3 per square mile (11.3/km2).[14] The racial makeup of the county was 97.0% white, 1.1% black or African American, 0.3% Asian, 0.2% American Indian, 0.2% from other races, and 1.2% from two or more races. Those of Hispanic or Latino origin made up 0.8% of the population.[13] In terms of ancestry, 29.5% were German, 14.2% were Irish, 11.2% were English, and 10.3% were American.[15]
Of the 14,658 households, 30.8% had children under the age of 18 living with them, 53.7% were married couples living together, 10.4% had a female householder with no husband present, 31.2% were non-families, and 26.3% of all households were made up of individuals. The average household size was 2.49 and the average family size was 2.98. The median age was 40.8 years.[13]
The median income for a household in the county was $39,469 and the median income for a family was $47,931. Males had a median income of $39,701 versus $26,706 for females. The per capita income for the county was $19,635. About 12.4% of families and 17.0% of the population were below the poverty line, including 26.0% of those under age 18 and 8.3% of those age 65 or over.[16]
Politics
| Year | Republican | Democratic | Third parties |
|---|---|---|---|
| 2016 | 68.9% 10,785 | 25.6% 4,013 | 5.5% 861 |
| 2012 | 53.2% 8,390 | 44.0% 6,940 | 2.9% 454 |
| 2008 | 51.2% 8,675 | 45.4% 7,689 | 3.4% 574 |
| 2004 | 56.9% 9,839 | 42.6% 7,378 | 0.5% 86 |
| 2000 | 57.8% 8,243 | 39.2% 5,594 | 3.0% 431 |
| 1996 | 42.0% 6,018 | 41.9% 6,005 | 16.1% 2,307 |
| 1992 | 35.3% 5,705 | 38.4% 6,212 | 26.3% 4,256 |
| 1988 | 57.1% 8,282 | 41.5% 6,020 | 1.4% 204 |
| 1984 | 68.7% 9,842 | 30.7% 4,392 | 0.6% 89 |
| 1980 | 60.3% 8,359 | 34.1% 4,725 | 5.6% 772 |
| 1976 | 50.9% 6,361 | 46.6% 5,827 | 2.5% 308 |
| 1972 | 66.2% 8,082 | 31.1% 3,790 | 2.7% 334 |
| 1968 | 53.6% 7,256 | 37.0% 5,013 | 9.4% 1,270 |
| 1964 | 41.6% 5,965 | 58.4% 8,382 | |
| 1960 | 64.8% 9,913 | 35.3% 5,396 | |
| 1956 | 66.6% 9,549 | 33.4% 4,789 | |
| 1952 | 62.9% 9,832 | 37.1% 5,799 | |
| 1948 | 52.1% 7,096 | 47.4% 6,457 | 0.6% 81 |
| 1944 | 56.4% 7,917 | 43.6% 6,126 | |
| 1940 | 52.2% 8,623 | 47.8% 7,889 | |
| 1936 | 40.7% 6,449 | 58.7% 9,316 | 0.6% 101 |
| 1932 | 41.5% 6,040 | 56.3% 8,188 | 2.3% 327 |
| 1928 | 70.6% 9,154 | 28.9% 3,745 | 0.6% 71 |
| 1924 | 49.8% 5,837 | 37.6% 4,415 | 12.6% 1,477 |
| 1920 | 51.1% 6,154 | 46.6% 5,617 | 2.3% 280 |
| 1916 | 37.5% 2,831 | 56.6% 4,269 | 5.9% 443 |
| 1912 | 27.4% 1,984 | 47.8% 3,465 | 24.9% 1,805 |
| 1908 | 44.5% 3,606 | 50.6% 4,106 | 4.9% 399 |
| 1904 | 49.5% 3,715 | 47.2% 3,545 | 3.4% 253 |
| 1900 | 46.6% 3,592 | 51.2% 3,940 | 2.2% 169 |
| 1896 | 45.2% 3,340 | 53.9% 3,979 | 0.9% 65 |
| 1892 | 41.6% 2,705 | 54.3% 3,529 | 4.1% 269 |
| 1888 | 42.2% 2,768 | 54.4% 3,567 | 3.4% 223 |
| 1884 | 44.7% 2,839 | 54.6% 3,469 | 0.7% 45 |
| 1880 | 45.0% 2,831 | 54.7% 3,440 | 0.3% 21 |
| 1876 | 43.2% 2,518 | 56.8% 3,312 | 0.1% 4 |
| 1872 | 45.7% 2,252 | 53.9% 2,656 | 0.5% 22 |
Government
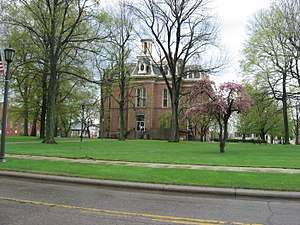
The county courts meet in the courthouse located in Coshocton. Built in 1875, it is still in use today.
Communities
City
- Coshocton (county seat)
Villages
Townships
https://web.archive.org/web/20160715023447/http://www.ohiotownships.org/township-websites
Census-designated places
Unincorporated communities
See also
References
- 1 2 "State & County QuickFacts". United States Census Bureau. Retrieved February 7, 2015.
- ↑ "Find a County". National Association of Counties. Archived from the original on 2011-05-31. Retrieved 2011-06-07.
- ↑ "Ohio: Individual County Chronologies". Ohio Atlas of Historical County Boundaries. The Newberry Library. 2007. Retrieved February 12, 2015.
- ↑ "Coshocton County data". Ohio State University Extension Data Center. Retrieved 2007-04-28.
- ↑ "2010 Census Gazetteer Files". United States Census Bureau. August 22, 2012. Archived from the original on May 4, 2014. Retrieved February 7, 2015.
- ↑ "Population and Housing Unit Estimates". Retrieved June 9, 2017.
- ↑ "U.S. Decennial Census". United States Census Bureau. Archived from the original on May 12, 2015. Retrieved February 7, 2015.
- ↑ "Historical Census Browser". University of Virginia Library. Retrieved February 7, 2015.
- ↑ Forstall, Richard L., ed. (March 27, 1995). "Population of Counties by Decennial Census: 1900 to 1990". United States Census Bureau. Retrieved February 7, 2015.
- ↑ "Census 2000 PHC-T-4. Ranking Tables for Counties: 1990 and 2000" (PDF). United States Census Bureau. April 2, 2001. Retrieved February 7, 2015.
- ↑ "American FactFinder". United States Census Bureau. Archived from the original on 2013-09-11. Retrieved 2008-01-31.
- ↑ results Archived August 15, 2013, at the Wayback Machine. (reference does not show any data)
- 1 2 3 "DP-1 Profile of General Population and Housing Characteristics: 2010 Demographic Profile Data". United States Census Bureau. Retrieved 2015-12-27.
- ↑ "Population, Housing Units, Area, and Density: 2010 - County". United States Census Bureau. Retrieved 2015-12-27.
- ↑ "DP02 SELECTED SOCIAL CHARACTERISTICS IN THE UNITED STATES – 2006-2010 American Community Survey 5-Year Estimates". United States Census Bureau. Retrieved 2015-12-27.
- ↑ "DP03 SELECTED ECONOMIC CHARACTERISTICS – 2006-2010 American Community Survey 5-Year Estimates". United States Census Bureau. Retrieved 2015-12-27.
- ↑ Leip, David. "Dave Leip's Atlas of U.S. Presidential Elections". uselectionatlas.org. Retrieved 2018-05-01.
Further reading
- Thomas William Lewis, History of Southeastern Ohio and the Muskingum Valley, 1788-1928. In Three Volumes. Chicago: S.J. Clarke Publishing Co., 1928.
External links
Places adjacent to Coshocton County, Ohio | ||||||||||
|---|---|---|---|---|---|---|---|---|---|---|
| ||||||||||
Municipalities and communities of Coshocton County, Ohio, United States | ||
|---|---|---|
| City | | |
| Villages | ||
| Townships | ||
| CDPs | ||
| Unincorporated communities |
| |
| Ghost towns | ||
| Footnotes | ‡This populated place also has portions in an adjacent county or counties | |