Ritchie County, West Virginia
| Ritchie County, West Virginia | |
|---|---|
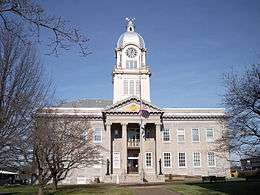 Ritchie County Courthouse in Harrisville | |
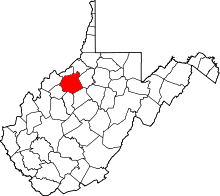 Location in the U.S. state of West Virginia | |
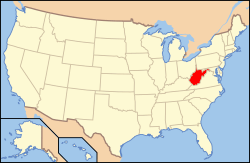 West Virginia's location in the U.S. | |
| Founded | February 18, 1843 |
| Named for | Thomas Ritchie |
| Seat | Harrisville |
| Largest town | Harrisville |
| Area | |
| • Total | 454 sq mi (1,176 km2) |
| • Land | 452 sq mi (1,171 km2) |
| • Water | 1.7 sq mi (4 km2), 0.4% |
| Population (est.) | |
| • (2015) | 9,982 |
| • Density | 22/sq mi (8/km2) |
| Congressional district | 1st |
| Time zone | Eastern: UTC−5/−4 |
| Website |
www |
Ritchie County is a county in the U.S. state of West Virginia. As of the 2010 census, the population was 10,449.[1] Its county seat is Harrisville.[2] The county was created in 1843 by the Virginia General Assembly and named for Richmond newspaper publisher Thomas Ritchie.[3]
History
In 1911, historian Minnie Kendall Lowther published "The History of Ritchie County." Her book is still regarded as one of the most comprehensive histories of any county in West Virginia.[4]
Geography
According to the U.S. Census Bureau, the county has a total area of 454 square miles (1,180 km2), of which 452 square miles (1,170 km2) is land and 1.7 square miles (4.4 km2) (0.4%) is water.[5]
Major highways
Adjacent counties
- Pleasants County (north)
- Tyler County (northeast)
- Doddridge County (east)
- Gilmer County (southeast)
- Calhoun County (south)
- Wirt County (west)
- Wood County (northwest)
Demographics
| Historical population | |||
|---|---|---|---|
| Census | Pop. | %± | |
| 1850 | 3,902 | — | |
| 1860 | 6,847 | 75.5% | |
| 1870 | 9,055 | 32.2% | |
| 1880 | 13,474 | 48.8% | |
| 1890 | 16,621 | 23.4% | |
| 1900 | 18,901 | 13.7% | |
| 1910 | 17,875 | −5.4% | |
| 1920 | 16,506 | −7.7% | |
| 1930 | 15,594 | −5.5% | |
| 1940 | 15,389 | −1.3% | |
| 1950 | 12,535 | −18.5% | |
| 1960 | 10,877 | −13.2% | |
| 1970 | 10,145 | −6.7% | |
| 1980 | 11,442 | 12.8% | |
| 1990 | 10,233 | −10.6% | |
| 2000 | 10,343 | 1.1% | |
| 2010 | 10,449 | 1.0% | |
| Est. 2016 | 9,875 | [6] | −5.5% |
| U.S. Decennial Census[7] 1790–1960[8] 1900–1990[9] 1990–2000[10] 2010–2015[1] | |||
2000 census
As of the census[11] of 2000, there were 10,343 people, 4,184 households, and 2,999 families residing in the county. The population density was 23 people per square mile (9/km²). There were 5,513 housing units at an average density of 12 per square mile (5/km²). The racial makeup of the county was 98.68% White, 0.14% Black or African American, 0.27% Native American, 0.13% Asian, 0.11% from other races, and 0.69% from two or more races. 0.47% of the population were Hispanic or Latino of any race.
There were 4,184 households out of which 30.20% had children under the age of 18 living with them, 58.20% were married couples living together, 9.70% had a female householder with no husband present, and 28.30% were non-families. 25.00% of all households were made up of individuals and 12.30% had someone living alone who was 65 years of age or older. The average household size was 2.45 and the average family size was 2.91.
In the county, the population was spread out with 23.00% under the age of 18, 7.70% from 18 to 24, 28.00% from 25 to 44, 26.10% from 45 to 64, and 15.20% who were 65 years of age or older. The median age was 40 years. For every 100 females there were 96.20 males. For every 100 females age 18 and over, there were 95.10 males.
The median income for a household in the county was $27,332, and the median income for a family was $34,809. Males had a median income of $28,147 versus $18,149 for females. The per capita income for the county was $15,175. About 14.30% of families and 19.10% of the population were below the poverty line, including 23.60% of those under age 18 and 14.10% of those age 65 or over.
2010 census
As of the 2010 United States Census, there were 10,449 people, 4,367 households, and 2,960 families residing in the county.[12] The population density was 23.1 inhabitants per square mile (8.9/km2). There were 5,843 housing units at an average density of 12.9 per square mile (5.0/km2).[13] The racial makeup of the county was 98.7% white, 0.2% black or African American, 0.1% Asian, 0.1% American Indian, 0.2% from other races, and 0.8% from two or more races. Those of Hispanic or Latino origin made up 0.5% of the population.[12] In terms of ancestry, 20.3% were German, 14.6% were Irish, 13.2% were American, and 11.3% were English.[14]
Of the 4,367 households, 28.2% had children under the age of 18 living with them, 53.2% were married couples living together, 9.8% had a female householder with no husband present, 32.2% were non-families, and 28.2% of all households were made up of individuals. The average household size was 2.37 and the average family size was 2.85. The median age was 44.3 years.[12]
The median income for a household in the county was $32,619 and the median income for a family was $39,919. Males had a median income of $31,807 versus $23,966 for females. The per capita income for the county was $18,255. About 13.9% of families and 18.9% of the population were below the poverty line, including 21.6% of those under age 18 and 15.2% of those age 65 or over.[15]
Politics
After having leaned strongly towards the Democratic Party between the New Deal and Bill Clinton’s presidency, most of West Virginia has since 2000 seen an extremely rapid swing towards the Republican Party due to declining unionization[16] along with views on environmental, social and cultural issues increasingly at odds with the national Democratic party.[17] In contrast, Ritchie County along with neighbouring Doddridge County and Tyler County were historically powerfully Unionist and have always been solidly Republican since the Civil War. Only one Democratic presidential nominee has carried Ritchie County since West Virginia’s statehood: Woodrow Wilson in 1912, and he won by a mere six votes with only 34.22 percent of all votes against a Republican Party mortally divided between conservative incumbent Taft and progressive Theodore Roosevelt.[18]
| Year | Republican | Democratic | Third parties |
|---|---|---|---|
| 2016 | 83.0% 3,405 | 12.1% 496 | 5.0% 204 |
| 2012 | 77.1% 2,921 | 20.3% 768 | 2.7% 101 |
| 2008 | 72.3% 2,781 | 26.0% 998 | 1.7% 67 |
| 2004 | 73.6% 3,086 | 25.5% 1,070 | 1.0% 40 |
| 2000 | 71.3% 2,717 | 26.9% 1,024 | 1.9% 71 |
| 1996 | 49.8% 1,906 | 36.2% 1,385 | 14.1% 540 |
| 1992 | 49.5% 2,184 | 33.4% 1,474 | 17.2% 758 |
| 1988 | 66.3% 2,874 | 33.3% 1,446 | 0.4% 18 |
| 1984 | 72.8% 3,355 | 26.7% 1,231 | 0.5% 23 |
| 1980 | 65.7% 3,081 | 30.9% 1,450 | 3.4% 160 |
| 1976 | 59.7% 2,874 | 40.3% 1,941 | |
| 1972 | 78.6% 3,635 | 21.4% 990 | |
| 1968 | 66.5% 3,106 | 27.4% 1,281 | 6.1% 284 |
| 1964 | 54.8% 2,717 | 45.2% 2,244 | |
| 1960 | 71.4% 3,972 | 28.6% 1,591 | |
| 1956 | 73.8% 4,140 | 26.2% 1,471 | |
| 1952 | 71.8% 4,238 | 28.2% 1,665 | |
| 1948 | 67.7% 3,619 | 32.0% 1,712 | 0.3% 14 |
| 1944 | 70.6% 3,963 | 29.4% 1,650 | |
| 1940 | 67.1% 4,982 | 32.9% 2,439 | |
| 1936 | 62.0% 4,639 | 37.7% 2,825 | 0.3% 22 |
| 1932 | 55.4% 4,055 | 43.5% 3,179 | 1.1% 83 |
| 1928 | 70.4% 4,195 | 28.7% 1,711 | 0.9% 53 |
| 1924 | 62.6% 4,152 | 36.2% 2,403 | 1.2% 77 |
| 1920 | 67.4% 4,377 | 31.6% 2,050 | 1.1% 68 |
| 1916 | 56.0% 2,225 | 41.7% 1,657 | 2.2% 89 |
| 1912 | 26.3% 937 | 35.7% 1,270 | 38.0% 1,355[lower-alpha 1] |
Notable sights
- Historic Berdine's Five and Dime
- North Bend State Park
- North Bend Rail Trail
- The Double Scoop Ice Cream Parlor Cairo, WV
- Pine Hill Pottery
- Sunny Hollow Farms
- Old Stone House Museum
Communities
City
Towns
- Auburn
- Cairo
- Ellenboro
- Harrisville (county seat)
- Pullman
Unincorporated communities
See also
Notes
- ↑ The leading "other" candidate, Progressive Theodore Roosevelt, received 1,264 votes, while Socialist candidate Eugene Debs received 91 votes.
References
- 1 2 "State & County QuickFacts". United States Census Bureau. Retrieved January 11, 2014.
- ↑ "Find a County". National Association of Counties. Retrieved 2011-06-07.
- ↑ "Archived copy". Archived from the original on 2013-05-29. Retrieved 2013-01-29.
- ↑ "September 18, 1947: Historian Minnie Kendall Lowther Dies in Harrisville". West Virginia Public Broadcasting. 2015-08-26. Retrieved 2015-09-20.
- ↑ "2010 Census Gazetteer Files". United States Census Bureau. August 22, 2012. Retrieved July 30, 2015.
- ↑ "Population and Housing Unit Estimates". Retrieved June 9, 2017.
- ↑ "U.S. Decennial Census". United States Census Bureau. Retrieved January 11, 2014.
- ↑ "Historical Census Browser". University of Virginia Library. Retrieved January 11, 2014.
- ↑ "Population of Counties by Decennial Census: 1900 to 1990". United States Census Bureau. Retrieved January 11, 2014.
- ↑ "Census 2000 PHC-T-4. Ranking Tables for Counties: 1990 and 2000" (PDF). United States Census Bureau. Retrieved January 11, 2014.
- ↑ "American FactFinder". United States Census Bureau. Retrieved 2011-05-14.
- 1 2 3 "DP-1 Profile of General Population and Housing Characteristics: 2010 Demographic Profile Data". United States Census Bureau. Retrieved 2016-04-03.
- ↑ "Population, Housing Units, Area, and Density: 2010 - County". United States Census Bureau. Retrieved 2016-04-03.
- ↑ "DP02 SELECTED SOCIAL CHARACTERISTICS IN THE UNITED STATES – 2006-2010 American Community Survey 5-Year Estimates". United States Census Bureau. Retrieved 2016-04-03.
- ↑ "DP03 SELECTED ECONOMIC CHARACTERISTICS – 2006-2010 American Community Survey 5-Year Estimates". United States Census Bureau. Retrieved 2016-04-03.
- ↑ Schwartzman, Gabe; ‘How Central Appalachia Went Right’; Daily Yonder, January 13, 2015
- ↑ Cohn, Nate; ‘Demographic Shift: Southern Whites’ Loyalty to G.O.P. Nearing That of Blacks to Democrats’, New York Times, April 24, 2014
- ↑ "Presidential Election of 1912 – Map by Counties (.xlsx file for €15)". Géoelections. Retrieved 2017-06-06.
- ↑ Leip, David. "Dave Leip's Atlas of U.S. Presidential Elections". uselectionatlas.org. Retrieved 2018-03-28.
Places adjacent to Ritchie County, West Virginia | ||||||||||
|---|---|---|---|---|---|---|---|---|---|---|
| ||||||||||
Municipalities and communities of Ritchie County, West Virginia, United States | ||
|---|---|---|
| City | | |
| Towns | ||
| Unincorporated communities |
| |
| Ghost towns | ||
| Footnotes | ‡This populated place also has portions in an adjacent county or counties | |