Crawford County, Ohio
| Crawford County, Ohio | ||
|---|---|---|
 | ||
| ||
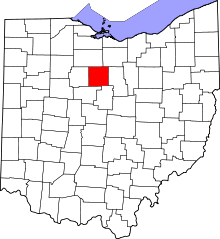 Location in the U.S. state of Ohio | ||
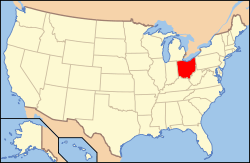 Ohio's location in the U.S. | ||
| Founded | April 1, 1826 | |
| Named for | Colonel William Crawford | |
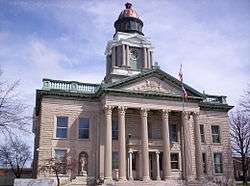
| Seat | Bucyrus | |
| Largest city | Bucyrus | |
| Area | ||
| • Total | 403 sq mi (1,044 km2) | |
| • Land | 402 sq mi (1,041 km2) | |
| • Water | 0.9 sq mi (2 km2), 0.2% | |
| Population | ||
| • (2010) | 43,784 | |
| • Density | 109/sq mi (42/km2) | |
| Congressional district | 4th | |
| Time zone | Eastern: UTC−5/−4 | |
| Website |
www | |

Crawford County is a county located in the U.S. state of Ohio. As of the 2010 census, the population was 43,784.[1] The approximate population as of 2014 is 42,480, causing a -3.00% change over the past 4 years, according to the United States Census Bureau. Its county seat is Bucyrus.[2] The county was created in 1820 and later organized in 1836.[3] It was named for Colonel William Crawford, a soldier during the American Revolution.[4]
Crawford County comprises the Bucyrus, OH Micropolitan Statistical Area, which is also included in the Mansfield-Ashland-Bucyrus, OH Combined Statistical Area.
Geography
According to the U.S. Census Bureau, the county has a total area of 403 square miles (1,040 km2), of which 402 square miles (1,040 km2) is land and 0.9 square miles (2.3 km2) (0.2%) is water.[5] It is the fourth-smallest county in Ohio by total area.
The county is drained by the Sandusky and Olentangy Rivers.
Adjacent counties
- Seneca County (north)
- Huron County (northeast)
- Richland County (east)
- Morrow County (southeast)
- Marion County (southwest)
- Wyandot County (west)
Demographics
| Historical population | |||
|---|---|---|---|
| Census | Pop. | %± | |
| 1830 | 4,791 | — | |
| 1840 | 13,152 | 174.5% | |
| 1850 | 18,177 | 38.2% | |
| 1860 | 23,881 | 31.4% | |
| 1870 | 25,556 | 7.0% | |
| 1880 | 30,583 | 19.7% | |
| 1890 | 31,927 | 4.4% | |
| 1900 | 33,915 | 6.2% | |
| 1910 | 34,036 | 0.4% | |
| 1920 | 36,054 | 5.9% | |
| 1930 | 35,345 | −2.0% | |
| 1940 | 35,571 | 0.6% | |
| 1950 | 38,738 | 8.9% | |
| 1960 | 46,775 | 20.7% | |
| 1970 | 50,364 | 7.7% | |
| 1980 | 50,075 | −0.6% | |
| 1990 | 47,870 | −4.4% | |
| 2000 | 46,966 | −1.9% | |
| 2010 | 43,784 | −6.8% | |
| Est. 2017 | 41,746 | [6] | −4.7% |
| U.S. Decennial Census[7] 1790-1960[8] 1900-1990[9] 1990-2000[10] 2010-2017[1] | |||
2000 census
As of the census[11] of 2000, there were 46,966 people, 18,957 households, and 13,175 families residing in the county. The population density was 117 people per square mile (45/km²). There were 20,178 housing units at an average density of 50 per square mile (19/km²). The racial makeup of the county was 97.99% White, 0.59% Black or African American, 0.20% Native American, 0.31% Asian, 0.02% Pacific Islander, 0.24% from other races, and 0.65% from two or more races. 0.77% of the population were Hispanic or Latino of any race. 40.4% were of German, 21.4% American, 8.1% English and 7.8% Irish ancestry according to Census 2000.
There were 18,957 households out of which 31.20% had children under the age of 18 living with them, 55.10% were married couples living together, and 30.50% were non-families. 26.30% of all households were made up of individuals and 11.50% had someone living alone who was 65 years of age or older. The average household size was 2.45 and the average family size was 2.94.
In the county, the population was spread out with 24.90% under the age of 18, 8.00% from 18 to 24, 27.60% from 25 to 44, 24.30% from 45 to 64, and 15.20% who were 65 years of age or older. The median age was 38 years. For every 100 females there were 93.40 males. For every 100 females age 18 and over, there were 90.80 males.
The median income for a household in the county was $36,227, and the median income for a family was $43,169. Males had a median income of $33,319 versus $21,346 for females. The per capita income for the county was $17,466. About 7.80% of families and 10.40% of the population were below the poverty line, including 13.70% of those under age 18 and 7.50% of those age 65 or over.
According to the United States Census Bureau, women make up about 51.3% of the population, as of 2014.
2010 census
As of the 2010 United States Census, there were 43,784 people, 18,099 households, and 12,108 families residing in the county.[12] The population density was 109.0 inhabitants per square mile (42.1/km2). There were 20,167 housing units at an average density of 50.2 per square mile (19.4/km2).[13] The racial makeup of the county was 97.2% white, 0.9% black or African American, 0.4% Asian, 0.1% American Indian, 0.3% from other races, and 1.1% from two or more races. Those of Hispanic or Latino origin made up 1.2% of the population.[12] In terms of ancestry, 43.3% were German, 14.3% were Irish, 13.7% were American, and 11.0% were English.[14]
Of the 18,099 households, 29.9% had children under the age of 18 living with them, 50.6% were married couples living together, 11.5% had a female householder with no husband present, 33.1% were non-families, and 28.4% of all households were made up of individuals. The average household size was 2.39 and the average family size was 2.89. The median age was 41.9 years.[12]
The median income for a household in the county was $41,228 and the median income for a family was $49,647. Males had a median income of $40,304 versus $28,118 for females. The per capita income for the county was $20,590. About 10.8% of families and 13.0% of the population were below the poverty line, including 21.3% of those under age 18 and 6.2% of those age 65 or over.[15]
Politics
| Year | Republican | Democratic | Third parties |
|---|---|---|---|
| 2016 | 70.4% 13,611 | 23.9% 4,625 | 5.7% 1,093 |
| 2012 | 59.7% 11,852 | 37.8% 7,507 | 2.5% 488 |
| 2008 | 58.0% 12,316 | 39.1% 8,289 | 2.9% 620 |
| 2004 | 63.7% 13,885 | 35.7% 7,773 | 0.7% 143 |
| 2000 | 60.8% 11,666 | 35.1% 6,721 | 4.1% 789 |
| 1996 | 44.9% 8,730 | 38.3% 7,449 | 16.8% 3,272 |
| 1992 | 41.4% 8,618 | 30.5% 6,351 | 28.2% 5,866 |
| 1988 | 66.7% 12,472 | 32.2% 6,018 | 1.1% 210 |
| 1984 | 74.1% 14,682 | 24.9% 4,932 | 1.0% 206 |
| 1980 | 62.9% 12,424 | 30.7% 6,058 | 6.4% 1,273 |
| 1976 | 57.2% 10,801 | 40.0% 7,553 | 2.7% 516 |
| 1972 | 69.5% 14,632 | 26.2% 5,518 | 4.3% 903 |
| 1968 | 56.6% 11,898 | 32.1% 6,737 | 11.3% 2,373 |
| 1964 | 42.8% 8,970 | 57.2% 11,968 | |
| 1960 | 67.6% 14,558 | 32.4% 6,981 | |
| 1956 | 70.5% 13,763 | 29.5% 5,769 | |
| 1952 | 66.1% 13,370 | 33.9% 6,852 | |
| 1948 | 53.7% 8,862 | 46.1% 7,600 | 0.3% 41 |
| 1944 | 59.7% 10,464 | 40.4% 7,079 | |
| 1940 | 53.6% 10,336 | 46.5% 8,966 | |
| 1936 | 36.0% 6,638 | 59.5% 10,955 | 4.5% 826 |
| 1932 | 37.3% 6,538 | 60.5% 10,593 | 2.2% 386 |
| 1928 | 66.9% 11,235 | 32.6% 5,472 | 0.5% 86 |
| 1924 | 40.8% 5,896 | 30.4% 4,384 | 28.8% 4,160 |
| 1920 | 44.7% 7,082 | 53.5% 8,467 | 1.8% 280 |
| 1916 | 29.8% 2,673 | 67.1% 6,014 | 3.2% 283 |
| 1912 | 17.8% 1,432 | 58.8% 4,733 | 23.4% 1,879 |
| 1908 | 32.8% 3,061 | 64.4% 6,006 | 2.7% 253 |
| 1904 | 39.9% 3,314 | 54.1% 4,493 | 6.0% 499 |
| 1900 | 31.7% 3,150 | 60.0% 5,968 | 8.3% 825 |
| 1896 | 34.4% 3,150 | 64.5% 5,915 | 1.1% 101 |
| 1892 | 32.3% 2,479 | 63.2% 4,858 | 4.5% 349 |
| 1888 | 33.6% 2,681 | 63.7% 5,085 | 2.7% 219 |
| 1884 | 35.4% 2,731 | 62.9% 4,851 | 1.7% 133 |
| 1880 | 36.1% 2,622 | 62.9% 4,567 | 1.0% 75 |
| 1876 | 34.5% 2,312 | 65.2% 4,365 | 0.2% 16 |
| 1872 | 36.4% 2,081 | 62.8% 3,595 | 0.8% 48 |
Communities

Cities
Villages
Townships
https://web.archive.org/web/20160715023447/http://www.ohiotownships.org/township-websites
Census-designated places
Unincorporated communities
- Auburn Center
- Benton
- Brandywine
- Brokensword
- DeKalb
- Gardner
- Jackson
- Leesville
- Lemert
- Lykens
- Mechanicsburg
- Middletown
- Monnett
- New Winchester
- Olentangy
- Plankton
- Ridgeton
- Spore
- Waynesburg
- West Liberty
See also
References
- 1 2 "State & County QuickFacts". United States Census Bureau. Retrieved February 7, 2015.
- ↑ "Find a County". National Association of Counties. Archived from the original on 2011-05-31. Retrieved 2011-06-07.
- ↑ "Ohio: Individual County Chronologies". Ohio Atlas of Historical County Boundaries. The Newberry Library. 2007. Retrieved February 12, 2015.
- ↑ Gannett, Henry (1905). The Origin of Certain Place Names in the United States. Govt. Print. Off. p. 95.
- ↑ "2010 Census Gazetteer Files". United States Census Bureau. August 22, 2012. Archived from the original on May 4, 2014. Retrieved February 7, 2015.
- ↑ "Population and Housing Unit Estimates". Retrieved June 9, 2017.
- ↑ "U.S. Decennial Census". United States Census Bureau. Archived from the original on May 12, 2015. Retrieved February 7, 2015.
- ↑ "Historical Census Browser". University of Virginia Library. Retrieved February 7, 2015.
- ↑ Forstall, Richard L., ed. (March 27, 1995). "Population of Counties by Decennial Census: 1900 to 1990". United States Census Bureau. Retrieved February 7, 2015.
- ↑ "Census 2000 PHC-T-4. Ranking Tables for Counties: 1990 and 2000" (PDF). United States Census Bureau. April 2, 2001. Retrieved February 7, 2015.
- ↑ "American FactFinder". United States Census Bureau. Archived from the original on 2013-09-11. Retrieved 2008-01-31.
- 1 2 3 "DP-1 Profile of General Population and Housing Characteristics: 2010 Demographic Profile Data". United States Census Bureau. Retrieved 2015-12-27.
- ↑ "Population, Housing Units, Area, and Density: 2010 - County". United States Census Bureau. Retrieved 2015-12-27.
- ↑ "DP02 SELECTED SOCIAL CHARACTERISTICS IN THE UNITED STATES – 2006-2010 American Community Survey 5-Year Estimates". United States Census Bureau. Retrieved 2015-12-27.
- ↑ "DP03 SELECTED ECONOMIC CHARACTERISTICS – 2006-2010 American Community Survey 5-Year Estimates". United States Census Bureau. Retrieved 2015-12-27.
- ↑ Leip, David. "Dave Leip's Atlas of U.S. Presidential Elections". uselectionatlas.org. Retrieved 2018-05-01.
Further reading
- John E. Hopley, History of Crawford County and Ohio: Containing a History of the State of Ohio, from its Earliest Settlement to the Present Time... Chicago: Baskin and Battey, Historical Publishers, 1881.
External links

- Crawford County Government's website
Places adjacent to Crawford County, Ohio | ||||||||||
|---|---|---|---|---|---|---|---|---|---|---|
| ||||||||||
Municipalities and communities of Crawford County, Ohio, United States | ||
|---|---|---|
| Cities | | |
| Villages | ||
| Townships | ||
| CDPs | ||
| Unincorporated communities | ||
| Footnotes | ‡This populated place also has portions in an adjacent county or counties | |