Greene County, Ohio
| Greene County, Ohio | ||
|---|---|---|
 The Greene County Courthouse in Xenia | ||
| ||
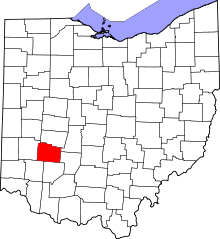 Location in the U.S. state of Ohio | ||
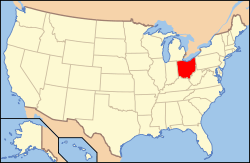 Ohio's location in the U.S. | ||
| Founded | May 1, 1803[1] | |
| Named for | General Nathanael Greene | |
| Seat | Xenia | |
| Largest city | Beavercreek* | |
| Area | ||
| • Total | 416 sq mi (1,077 km2) | |
| • Land | 414 sq mi (1,072 km2) | |
| • Water | 2.5 sq mi (6 km2), 0.6% | |
| Population | ||
| • (2010) | 161,573 | |
| • Density | 391/sq mi (151/km2) | |
| Congressional district | 10th | |
| Time zone | Eastern: UTC−5/−4 | |
| Website |
www | |
|
Footnotes: *Based on population just within the county.[2] | ||

Greene County is a county located in the U.S. state of Ohio. As of the 2010 census, the population was 161,573.[3] Its county seat is Xenia.[4] The county was established on March 24, 1803[5] and named for General Nathanael Greene,[6] an officer in the Revolutionary War.
Greene County is part of the Dayton, OH Metropolitan Statistical Area.
Geography
According to the U.S. Census Bureau, the county has a total area of 416 square miles (1,080 km2), of which 414 square miles (1,070 km2) is land and 2.5 square miles (6.5 km2) (0.6%) is water.[7]
Adjacent counties
- Clark County (north)
- Madison County (northeast)
- Fayette County (east)
- Clinton County (south)
- Warren County (southwest)
- Montgomery County (west)
National protected area
Major highways
Demographics
| Historical population | |||
|---|---|---|---|
| Census | Pop. | %± | |
| 1810 | 5,870 | — | |
| 1820 | 10,529 | 79.4% | |
| 1830 | 14,801 | 40.6% | |
| 1840 | 17,528 | 18.4% | |
| 1850 | 21,946 | 25.2% | |
| 1860 | 26,197 | 19.4% | |
| 1870 | 28,038 | 7.0% | |
| 1880 | 31,649 | 12.9% | |
| 1890 | 29,820 | −5.8% | |
| 1900 | 31,613 | 6.0% | |
| 1910 | 29,733 | −5.9% | |
| 1920 | 31,221 | 5.0% | |
| 1930 | 33,259 | 6.5% | |
| 1940 | 35,863 | 7.8% | |
| 1950 | 58,892 | 64.2% | |
| 1960 | 94,642 | 60.7% | |
| 1970 | 125,057 | 32.1% | |
| 1980 | 129,769 | 3.8% | |
| 1990 | 136,731 | 5.4% | |
| 2000 | 147,886 | 8.2% | |
| 2010 | 161,573 | 9.3% | |
| Est. 2017 | 166,752 | [8] | 3.2% |
| U.S. Decennial Census[9] 1790-1960[10] 1900-1990[11] 1990-2000[12] 2010-2013[3] | |||
2000 census
As of the census[13] of 2010, there were 161,573 people, 61,825 households, and 39,160 families residing in the county. The population density was 356 people per square mile (138/km²). There were 58,224 housing units at an average density of 140 per square mile (54/km²). The racial makeup of the county was 86.4% White, 7.2% Black or African American, 0.3% Native American, 2.9% Asian, 0.1% Pacific Islander, 0.38% from other races, and 1.66% from two or more races. 1.23% of the population were Hispanic or Latino of any race.
There were 55,312 households out of which 32.80% had children under the age of 18 living with them, 58.00% were married couples living together, 9.60% had a female householder with no husband present, and 29.20% were non-families. 23.00% of all households were made up of individuals and 7.70% had someone living alone who was 65 years of age or older. The average household size was 2.53 and the average family size was 3.00.
In the county, the population was spread out with 23.90% under the age of 18, 13.70% from 18 to 24, 27.00% from 25 to 44, 23.60% from 45 to 64, and 11.80% who were 65 years of age or older. The median age was 36 years. For every 100 females there were 94.80 males. For every 100 females age 18 and over, there were 91.40 males.
The median income for a household in the county was $48,656, and the median income for a family was $57,954. Males had a median income of $42,338 versus $28,457 for females. The per capita income for the county was $23,057. About 5.20% of families and 8.50% of the population were below the poverty line, including 8.70% of those under age 18 and 6.90% of those age 65 or over.
2010 census
As of the 2010 United States Census, there were 161,573 people, 62,770 households, and 41,696 families residing in the county.[14] The population density was 390.5 inhabitants per square mile (150.8/km2). There were 68,241 housing units at an average density of 164.9 per square mile (63.7/km2).[15] The racial makeup of the county was 86.4% white, 7.2% black or African American, 2.9% Asian, 0.3% American Indian, 0.1% Pacific islander, 0.5% from other races, and 2.6% from two or more races. Those of Hispanic or Latino origin made up 2.1% of the population.[14] In terms of ancestry, 26.4% were German, 15.7% were American, 13.0% were Irish, and 10.9% were English.[16]
Of the 62,770 households, 30.1% had children under the age of 18 living with them, 51.9% were married couples living together, 10.6% had a female householder with no husband present, 33.6% were non-families, and 26.5% of all households were made up of individuals. The average household size was 2.43 and the average family size was 2.95. The median age was 37.2 years.[14]
The median income for a household in the county was $56,679 and the median income for a family was $70,817. Males had a median income of $53,614 versus $37,056 for females. The per capita income for the county was $28,328. About 7.8% of families and 11.4% of the population were below the poverty line, including 15.3% of those under age 18 and 5.1% of those age 65 or over.[17]
Politics
| Year | Republican | Democratic | Third parties |
|---|---|---|---|
| 2016 | 58.5% 48,540 | 34.9% 28,943 | 6.6% 5,454 |
| 2012 | 59.6% 49,819 | 38.6% 32,256 | 1.9% 1,551 |
| 2008 | 58.5% 48,936 | 40.1% 33,540 | 1.5% 1,253 |
| 2004 | 61.0% 48,388 | 38.5% 30,531 | 0.5% 363 |
| 2000 | 58.2% 37,946 | 38.4% 25,059 | 3.4% 2,199 |
| 1996 | 49.7% 30,677 | 40.6% 25,082 | 9.8% 6,023 |
| 1992 | 46.5% 27,651 | 33.9% 20,139 | 19.7% 11,712 |
| 1988 | 65.1% 34,432 | 34.1% 18,025 | 0.8% 399 |
| 1984 | 66.3% 34,267 | 33.1% 17,129 | 0.6% 316 |
| 1980 | 51.0% 24,922 | 41.1% 20,068 | 7.9% 3,852 |
| 1976 | 51.3% 22,598 | 45.9% 20,245 | 2.8% 1,234 |
| 1972 | 65.2% 25,349 | 32.7% 12,736 | 2.1% 824 |
| 1968 | 45.4% 17,589 | 39.1% 15,178 | 15.5% 6,008 |
| 1964 | 40.7% 14,571 | 59.4% 21,276 | |
| 1960 | 58.1% 19,642 | 41.9% 14,155 | |
| 1956 | 61.1% 15,471 | 38.9% 9,861 | |
| 1952 | 58.6% 12,900 | 41.4% 9,123 | |
| 1948 | 50.2% 9,186 | 49.0% 8,970 | 0.8% 144 |
| 1944 | 55.0% 9,680 | 45.1% 7,937 | |
| 1940 | 51.1% 9,273 | 48.9% 8,881 | |
| 1936 | 44.6% 7,449 | 53.5% 8,946 | 1.9% 317 |
| 1932 | 54.6% 8,455 | 42.6% 6,600 | 2.8% 426 |
| 1928 | 74.1% 10,030 | 25.0% 3,385 | 0.8% 113 |
| 1924 | 73.0% 8,410 | 21.4% 2,471 | 5.6% 642 |
| 1920 | 67.3% 8,600 | 31.4% 4,016 | 1.4% 172 |
| 1916 | 57.9% 4,458 | 37.9% 2,913 | 4.2% 324 |
| 1912 | 46.0% 3,242 | 29.9% 2,107 | 24.1% 1,694 |
| 1908 | 60.1% 4,902 | 35.4% 2,882 | 4.5% 367 |
| 1904 | 67.4% 5,043 | 26.8% 2,004 | 5.8% 437 |
| 1900 | 62.9% 5,100 | 33.9% 2,743 | 3.2% 259 |
| 1896 | 62.5% 5,296 | 35.5% 3,003 | 2.0% 173 |
| 1892 | 59.1% 4,210 | 34.3% 2,442 | 6.7% 475 |
| 1888 | 61.7% 4,893 | 33.8% 2,682 | 4.5% 355 |
| 1884 | 63.4% 4,920 | 33.8% 2,624 | 2.8% 218 |
| 1880 | 66.3% 4,927 | 33.0% 2,455 | 0.7% 51 |
| 1876 | 63.7% 4,488 | 35.4% 2,494 | 1.0% 67 |
| 1872 | 66.6% 4,069 | 32.1% 1,961 | 1.3% 77 |
Government
- Auditor: David Graham (R)
- Coroner: Kevin L. Sharrett, M.D. (R)
- Engineer: Robert N. Geyer (R)
- Prosecutor: Stephen K. Haller (R)
- Recorder: Eric C. Sears (R)
- Sheriff: Gene Fischer (R)
- Treasurer: Dick Gould, CPA (R)
- Common Pleas Judge: Hon. Stephen A. Wolaver (R)
- Common Pleas Judge: Hon. Michael A. Buckwalter (R)
- Domestic Relations Judge: Hon. Stephen L. Hurley (R)
- Juvenile Court Judge: Hon. Adolfo A. Tornichio (R)
- Probate Court Judge: Hon. Thomas M. O'Diam (R)
- County Commissioners: Tom Koogler (R), Alan Anderson (R), and Bob Glaser (R)
Education
Higher education
The following colleges and universities are located in Greene County:
Public
- Wright State University, Fairborn
- Central State University, Wilberforce
- Clark State Community College - Greene Center, Beavercreek
Private
- Antioch College, Yellow Springs
- Wilberforce University, Wilberforce
- Cedarville University, Cedarville
Public schools
- Beavercreek City School District
- Beavercreek High School, Beavercreek (the Beavers)
- Cedar Cliff Local School District
- Cedarville High School, Cedarville (the Indians)
- Fairborn City School District
- Fairborn High School, Fairborn (the Skyhawks)
- Greeneview Local School District
- Greeneview High School, Jamestown (the Rams)
- Sugarcreek Local School District
- Bellbrook High School, Bellbrook (the Golden Eagles)
- Xenia Community City School District
- Xenia High School, Xenia (the Buccaneers)
- Yellow Springs Exempted Village School District
- Yellow Springs High School, Yellow Springs (the Bulldogs)
- Greene County Career Center, Xenia (Vocational school)
Private schools
- Legacy Christian Academy (the Knights)
- St. Brigid School (the Irish)
Communities
Cities
- Beavercreek
- Bellbrook
- Centerville (part)
- Dayton (part)
- Fairborn
- Huber Heights (part)[19]
- Kettering (part)
- Xenia (county seat)
Villages
Townships
https://web.archive.org/web/20160715023447/http://www.ohiotownships.org/township-websites
Census-designated places
Unincorporated communities
See also
References
- ↑ "Ohio County Profiles: Greene County" (PDF). Ohio Department of Development. Archived from the original (PDF) on 2007-06-21. Retrieved 2007-04-28.
- ↑ "Greene County data (population)". Ohio State University Extension Data Center. Retrieved 2007-05-10.
- 1 2 "State & County QuickFacts". United States Census Bureau. Archived from the original on July 11, 2011. Retrieved February 8, 2015.
- ↑ "Find a County". National Association of Counties. Archived from the original on 2011-05-31. Retrieved 2011-06-07.
- ↑ "Greene County data". Ohio State University Extension Data Center. Retrieved 2007-04-28.
- ↑ Gannett, Henry (1905). The Origin of Certain Place Names in the United States. Govt. Print. Off. p. 143.
- ↑ "2010 Census Gazetteer Files". United States Census Bureau. August 22, 2012. Archived from the original on May 4, 2014. Retrieved February 8, 2015.
- ↑ "Population and Housing Unit Estimates". Retrieved June 9, 2017.
- ↑ "U.S. Decennial Census". United States Census Bureau. Archived from the original on May 12, 2015. Retrieved February 8, 2015.
- ↑ "Historical Census Browser". University of Virginia Library. Retrieved February 8, 2015.
- ↑ Forstall, Richard L., ed. (March 27, 1995). "Population of Counties by Decennial Census: 1900 to 1990". United States Census Bureau. Retrieved February 8, 2015.
- ↑ "Census 2000 PHC-T-4. Ranking Tables for Counties: 1990 and 2000" (PDF). United States Census Bureau. April 2, 2001. Retrieved February 8, 2015.
- ↑ "American FactFinder". United States Census Bureau. Archived from the original on 2013-09-11. Retrieved 2008-01-31.
- 1 2 3 "DP-1 Profile of General Population and Housing Characteristics: 2010 Demographic Profile Data". United States Census Bureau. Retrieved 2015-12-27.
- ↑ "Population, Housing Units, Area, and Density: 2010 - County". United States Census Bureau. Retrieved 2015-12-27.
- ↑ "DP02 SELECTED SOCIAL CHARACTERISTICS IN THE UNITED STATES – 2006-2010 American Community Survey 5-Year Estimates". United States Census Bureau. Retrieved 2015-12-27.
- ↑ "DP03 SELECTED ECONOMIC CHARACTERISTICS – 2006-2010 American Community Survey 5-Year Estimates". United States Census Bureau. Retrieved 2015-12-27.
- ↑ Leip, David. "Dave Leip's Atlas of U.S. Presidential Elections". uselectionatlas.org. Retrieved 2018-05-02.
- ↑ Greene County, Ohio Archived 2007-11-11 at the Wayback Machine., Greene County Auditor's Office, 2002. Accessed 2007-11-09.
External links
Places adjacent to Greene County, Ohio | ||||||||||
|---|---|---|---|---|---|---|---|---|---|---|
| ||||||||||
Municipalities and communities of Greene County, Ohio, United States | ||
|---|---|---|
| Cities | | |
| Villages | ||
| Townships | ||
| CDPs | ||
| Unincorporated communities | ||
| Footnotes | ‡This populated place also has portions in an adjacent county or counties | |