Lucas County, Ohio
| Lucas County, Ohio | |||
|---|---|---|---|
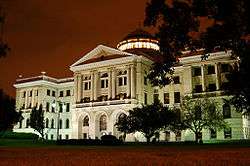 The Lucas County Courthouse in Toledo | |||
| |||
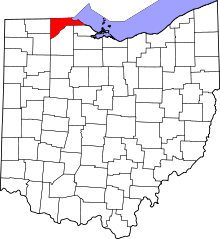 Location in the U.S. state of Ohio | |||
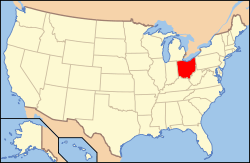 Ohio's location in the U.S. | |||
| Founded | June 20, 1835[1] | ||
| Named for | Robert Lucas | ||
| Seat | Toledo | ||
| Largest city | Toledo | ||
| Area | |||
| • Total | 596 sq mi (1,544 km2) | ||
| • Land | 341 sq mi (883 km2) | ||
| • Water | 255 sq mi (660 km2), 43% | ||
| Population (est.) | |||
| • (2017) | 430,887 | ||
| • Density | 1,296/sq mi (500/km2) | ||
| Congressional districts | 5th, 9th | ||
| Time zone | Eastern: UTC−5/−4 | ||
| Website |
www | ||


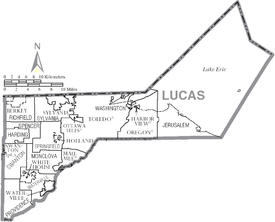
Lucas County is a county located in the U.S. state of Ohio and bordered on the east by Lake Erie, and on the southeast by the Maumee River, which runs to the lake. As of the 2010 census, the population was 441,815.[2] Its county seat is Toledo, located at the mouth of the Maumee River on the lake.[3] The county was named for Robert Lucas, 12th governor of Ohio, in 1835 during his second term.[4] Its establishment provoked the Toledo War conflict with the Michigan Territory, which claimed some of its area.
Lucas County is the central county of the Toledo Metropolitan Statistical Area.
History
On August 20, 1794, near the site of the present-day town of Maumee, American forces led by General Anthony Wayne won a decisive victory over allied Indian forces at the Battle of Fallen Timbers after years of conflict in what was known as the Northwest Indian War. The defeat of the Native forces resulted in the opening of the entire Northwest Territory for white settlement. Northwest Ohio was occupied chiefly by villages and bands of the Odawa people, who had trading relations with the French at Fort Detroit since 1701. Other Odawa were located in southeast Michigan and further north on the peninsula. They ceded much of that territory in the Treaty of Greenville but retained control of lands along the Maumee River until after the War of 1812. The last Odawa band, that of Ottokee, grandson of Chief Pontiac, left the Maumee River area for Kansas in 1839.[5][6]
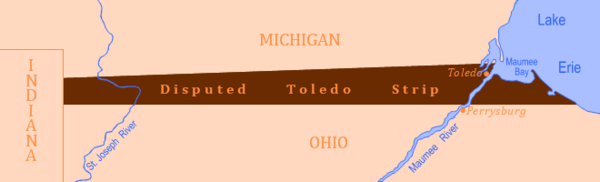
Lucas County was established in 1835. At that time, both Ohio and Michigan Territory claimed sovereignty over a 468-square-mile (1,210 km2) region along their border (see Toledo War). When Michigan petitioned Congress for statehood in 1835, it sought to include the disputed territory within its bounds. In response, the Ohio General Assembly formally organized part of the area as Lucas County, naming it after the incumbent governor of Ohio, Robert Lucas.
Geography

According to the U.S. Census Bureau, the county has a total area of 596 square miles (1,540 km2), of which 341 square miles (880 km2) is land and 255 square miles (660 km2) (43%) is water.[7] It is the fourth-smallest county in Ohio by land area. Much of the county lies within what was at the time of its establishment, a vast network of forests, wetlands, and grasslands known as the Great Black Swamp.
Rivers
Adjacent counties
- Monroe County, Michigan (north)
- Essex County, Ontario (northeast)
- Ottawa County (southeast)
- Wood County (south)
- Henry County (southwest)
- Fulton County (west)
- Lenawee County, Michigan (northwest)
National protected areas
Major highways
Demographics
| Historical population | |||
|---|---|---|---|
| Census | Pop. | %± | |
| 1840 | 9,382 | — | |
| 1850 | 12,363 | 31.8% | |
| 1860 | 25,831 | 108.9% | |
| 1870 | 46,722 | 80.9% | |
| 1880 | 67,377 | 44.2% | |
| 1890 | 102,296 | 51.8% | |
| 1900 | 153,559 | 50.1% | |
| 1910 | 192,728 | 25.5% | |
| 1920 | 275,721 | 43.1% | |
| 1930 | 347,709 | 26.1% | |
| 1940 | 344,333 | −1.0% | |
| 1950 | 395,551 | 14.9% | |
| 1960 | 456,931 | 15.5% | |
| 1970 | 484,370 | 6.0% | |
| 1980 | 471,741 | −2.6% | |
| 1990 | 462,361 | −2.0% | |
| 2000 | 455,054 | −1.6% | |
| 2010 | 441,815 | −2.9% | |
| Est. 2017 | 430,887 | [8] | −2.5% |
| U.S. Decennial Census[9] 1790-1960[10] 1900-1990[11] 1990-2000[12] 2010-2017[2] | |||
2000 census
As of the census of 2000, there were 455,054 people, 182,847 households, and 116,290 families residing in the county. The population density was 1,337 people per square mile (516/km²). There were 196,259 housing units at an average density of 576 per square mile (223/km²). The racial makeup of the county was 77.50% White, 16.98% Black or African American, 0.26% Native American, 1.21% Asian, 0.02% Pacific Islander, 1.86% from other races, and 2.16% from two or more races. 4.54% of the population were Hispanic or Latino of any race.
There were 182,847 households out of which 31.10% had children under the age of 18 living with them, 44.70% were married couples living together, 14.70% had a female householder with no husband present, and 36.40% were non-families. 30.10% of all households were made up of individuals and 10.50% had someone living alone who was 65 years of age or older. The average household size was 2.44 and the average family size was 3.06.
In the county, the population was spread out with 26.30% under the age of 18, 9.80% from 18 to 24, 29.10% from 25 to 44, 21.70% from 45 to 64, and 13.10% who were 65 years of age or older. The median age was 35 years. For every 100 females there were 92.60 males. For every 100 females age 18 and over, there were 88.60 males.
The median income for a household in the county was $38,004, and the median income for a family was $48,190. Males had a median income of $39,415 versus $26,447 for females. The per capita income for the county was $20,518. About 10.70% of families and 13.90% of the population were below the poverty line, including 19.70% of those under age 18 and 8.70% of those age 65 or over.
2010 census
As of the 2010 United States Census, there were 441,815 people, 180,267 households, and 111,016 families residing in the county.[13] The population density was 1,296.2 inhabitants per square mile (500.5/km2). There were 202,630 housing units at an average density of 594.5 per square mile (229.5/km2).[14] The racial makeup of the county was 74.0% white, 19.0% black or African American, 1.5% Asian, 0.3% American Indian, 2.0% from other races, and 3.1% from two or more races. Those of Hispanic or Latino origin made up 6.1% of the population.[13] In terms of ancestry, 29.8% were German, 13.2% were Irish, 9.7% were Polish, 8.0% were English, and 3.8% were American.[15]
Of the 180,267 households, 31.1% had children under the age of 18 living with them, 40.0% were married couples living together, 16.5% had a female householder with no husband present, 38.4% were non-families, and 31.4% of all households were made up of individuals. The average household size was 2.39 and the average family size was 3.01. The median age was 37.0 years.[13]
The median income for a household in the county was $42,072 and the median income for a family was $54,855. Males had a median income of $46,806 versus $33,394 for females. The per capita income for the county was $23,981. About 14.0% of families and 18.0% of the population were below the poverty line, including 25.4% of those under age 18 and 8.7% of those age 65 or over.[16]
Politics
Lucas County is a strongly Democratic county. The only Republicans to win a majority or plurality in the county since 1932 have been Thomas E. Dewey in 1944, Dwight D. Eisenhower in both 1952 and 1956, and Ronald Reagan in 1980 (plurality) and 1984.[17]
| Year | Republican | Democratic | Third parties |
|---|---|---|---|
| 2016 | 38.1% 75,698 | 55.7% 110,833 | 6.2% 12,299 |
| 2012 | 33.2% 69,940 | 64.9% 136,616 | 1.9% 4,065 |
| 2008 | 33.4% 73,706 | 64.8% 142,852 | 1.8% 3,899 |
| 2004 | 39.5% 87,160 | 60.2% 132,715 | 0.3% 555 |
| 2000 | 39.2% 73,342 | 57.8% 108,344 | 3.0% 5,664 |
| 1996 | 32.0% 58,120 | 57.7% 104,911 | 10.3% 18,716 |
| 1992 | 31.2% 63,297 | 49.3% 99,989 | 19.6% 39,733 |
| 1988 | 45.3% 83,788 | 53.9% 99,755 | 0.8% 1,552 |
| 1984 | 50.3% 100,285 | 48.8% 97,293 | 1.0% 1,976 |
| 1980 | 45.3% 86,653 | 44.6% 85,341 | 10.1% 19,304 |
| 1976 | 41.4% 76,069 | 56.4% 103,658 | 2.3% 4,180 |
| 1972 | 48.4% 88,401 | 49.3% 90,142 | 2.3% 4,166 |
| 1968 | 39.0% 69,403 | 51.3% 91,346 | 9.7% 17,288 |
| 1964 | 31.1% 57,782 | 68.9% 128,110 | |
| 1960 | 47.9% 94,679 | 52.1% 102,825 | |
| 1956 | 53.2% 100,501 | 46.9% 88,598 | |
| 1952 | 51.7% 97,490 | 48.3% 91,043 | |
| 1948 | 46.8% 66,798 | 51.9% 74,064 | 1.4% 1,991 |
| 1944 | 50.4% 77,247 | 49.6% 76,109 | |
| 1940 | 49.5% 76,405 | 50.5% 77,948 | |
| 1936 | 34.5% 45,853 | 55.8% 74,155 | 9.8% 12,971 |
| 1932 | 40.8% 47,796 | 55.4% 64,902 | 3.7% 4,362 |
| 1928 | 63.2% 78,435 | 36.3% 44,977 | 0.5% 669 |
| 1924 | 55.4% 53,670 | 12.3% 11,948 | 32.3% 31,284 |
| 1920 | 59.1% 52,449 | 34.3% 30,452 | 6.6% 5,868 |
| 1916 | 33.0% 16,711 | 60.8% 30,779 | 6.2% 3,136 |
| 1912 | 15.0% 5,622 | 37.2% 13,999 | 47.8% 17,989[19] |
| 1908 | 48.5% 18,715 | 42.0% 16,208 | 9.6% 3,697 |
| 1904 | 67.3% 22,924 | 24.3% 8,259 | 8.4% 2,862 |
| 1900 | 51.2% 17,128 | 46.0% 15,390 | 2.8% 932 |
| 1896 | 54.5% 16,758 | 44.7% 13,759 | 0.8% 259 |
| 1892 | 52.0% 11,211 | 45.8% 9,860 | 2.2% 481 |
| 1888 | 51.3% 9,443 | 46.9% 8,638 | 1.8% 331 |
| 1884 | 51.9% 8,341 | 45.9% 7,384 | 2.2% 360 |
| 1880 | 52.7% 7,157 | 44.0% 5,985 | 3.3% 447 |
| 1876 | 54.6% 6,524 | 43.1% 5,155 | 2.4% 281 |
| 1872 | 62.7% 5,253 | 36.8% 3,083 | 0.6% 48 |
Government and politics
Unlike most counties in northwest Ohio, Lucas County is strongly Democratic. Although Ronald Reagan carried the county twice, no other Republican has won the county in the last 50 years.[20] In 1972, for instance, it was one of only two counties in the entire state that supported George McGovern.
In the last five Presidential elections the Democratic candidate's margin of victory has ranged from 18% to 30.5% in the case of Barack Obama.[21] The eastern portion of Lucas County, including Toledo lies in Ohio's 9th congressional district, and it is represented by Marcy Kaptur, who is a member of the Congressional Progressive Caucus. The western portion, however, lies in Ohio's 5th congressional district, and is represented by Bob Latta.
County officials
| Office | Name | Party |
|---|---|---|
| Commissioner | Carol A. Contrada | Democrat |
| Commissioner | Peter L. Gerken | Democrat |
| Commissioner | Tina Skeldon Wozniak | Democrat |
| Prosecutor | Julia R. Bates | Democrat |
| Sheriff | John P. Tharp | Democrat |
| Clerk of Courts | J. Bernie Quilter | Democrat |
| Recorder | Phillip D. Copeland | Democrat |
| Treasurer | Lindsay Webb | Democrat |
| Engineer | Keith G. Earley | Democrat |
| Coroner | James R. Patrick | Democrat |
| Auditor | Anita L. Lopez | Democrat |
Communities
Cities
- Maumee
- Oregon
- Sylvania
- Toledo (county seat)
- Waterville
Villages
Townships
https://web.archive.org/web/20160715023447/http://www.ohiotownships.org/township-websites
Census-designated places
Unincorporated Communities
Ghost towns
See also
References
- ↑ "Ohio County Profiles: Lucas County" (PDF). Ohio Department of Development. Archived from the original (PDF) on 2007-06-21. Retrieved 2007-04-28.
- 1 2 "State & County QuickFacts". United States Census Bureau. Archived from the original on July 14, 2011. Retrieved February 8, 2015.
- ↑ "Find a County". National Association of Counties. Archived from the original on 2011-05-31. Retrieved 2011-06-07.
- ↑ "Lucas County data". Ohio State University Extension Data Center. Retrieved 2007-04-28.
- ↑ Helen Hornbeck Tanner, ed., Atlas of Great Lakes Indian History (University of Oklahoma Press: Norman, 1986) pp. 3, 58–59
- ↑ Larry Angelo (2nd chief of the Ottawa Tribe of Oklahoma), The Migration of the Ottawas from 1615 to Present, (1997), pp. 3-6
- ↑ "2010 Census Gazetteer Files". United States Census Bureau. August 22, 2012. Archived from the original on May 4, 2014. Retrieved February 8, 2015.
- ↑ "Population and Housing Unit Estimates". Retrieved June 9, 2017.
- ↑ "U.S. Decennial Census". United States Census Bureau. Archived from the original on May 12, 2015. Retrieved February 8, 2015.
- ↑ "Historical Census Browser". University of Virginia Library. Retrieved February 8, 2015.
- ↑ Forstall, Richard L., ed. (March 27, 1995). "Population of Counties by Decennial Census: 1900 to 1990". United States Census Bureau. Retrieved February 8, 2015.
- ↑ "Census 2000 PHC-T-4. Ranking Tables for Counties: 1990 and 2000" (PDF). United States Census Bureau. April 2, 2001. Retrieved February 8, 2015.
- 1 2 3 "DP-1 Profile of General Population and Housing Characteristics: 2010 Demographic Profile Data". United States Census Bureau. Retrieved 2015-12-27.
- ↑ "Population, Housing Units, Area, and Density: 2010 - County". United States Census Bureau. Retrieved 2015-12-27.
- ↑ "DP02 SELECTED SOCIAL CHARACTERISTICS IN THE UNITED STATES – 2006-2010 American Community Survey 5-Year Estimates". United States Census Bureau. Retrieved 2015-12-27.
- ↑ "DP03 SELECTED ECONOMIC CHARACTERISTICS – 2006-2010 American Community Survey 5-Year Estimates". United States Census Bureau. Retrieved 2015-12-27.
- ↑ Sullivan, Robert David; ‘How the Red and Blue Map Evolved Over the Past Century’; America Magazine in The National Catholic Review; June 29, 2016
- ↑ Leip, David. "Dave Leip's Atlas of U.S. Presidential Elections". uselectionatlas.org. Retrieved 1 April 2018.
- ↑ The leading "other" candidate, Progressive Theodore Roosevelt, received 12,442 votes, while Socialist candidate Eugene Debs received 5,173 votes, Prohibition candidate Eugene Chafin received 216 votes, and Socialist Labor candidate Arthur Reimer received 158 votes.
- ↑ "David Leip's Presidential Atlas (Maps for Ohio by election)". uselectionatlas.org. Retrieved 1 April 2018.
- ↑ "President Map - Election Results 2008 - The New York Times". elections.nytimes.com. Retrieved 1 April 2018.
- ↑ "Lucas County elected officials". lucas.oh.us. Retrieved 1 April 2018.
External links
| Wikivoyage has a travel guide for Lucas County. |
Places adjacent to Lucas County, Ohio | |
|---|---|
Municipalities and communities of Lucas County, Ohio, United States | ||
|---|---|---|
| Cities | | |
| Villages | ||
| Townships | ||
| CDPs | ||
| Unincorporated communities |
| |
| Ghost towns | ||
| Footnotes | ‡This populated place also has portions in an adjacent county or counties | |