Perry County, Ohio
| Perry County, Ohio | ||
|---|---|---|
 | ||
| ||
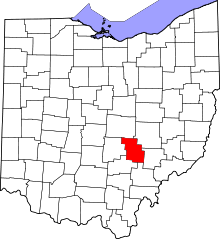 Location in the U.S. state of Ohio | ||
 Ohio's location in the U.S. | ||
| Founded | March 1, 1818[1] | |
| Named for | Oliver Hazard Perry | |
| Seat | New Lexington | |
| Largest village | New Lexington | |
| Area | ||
| • Total | 412 sq mi (1,067 km2) | |
| • Land | 408 sq mi (1,057 km2) | |
| • Water | 4.5 sq mi (12 km2), 1.1% | |
| Population | ||
| • (2010) | 36,058 | |
| • Density | 88/sq mi (34/km2) | |
| Congressional district | 15th | |
| Time zone | Eastern: UTC−5/−4 | |
| Website |
www | |

Perry County is a county located in the U.S. state of Ohio. As of the 2010 census, the population was 36,058.[2] Its county seat is New Lexington.[3] Founded on March 1, 1818, from parts of Fairfield, Washington and Muskingum counties, it was the 55th county to be formed in Ohio. The county is named for Oliver Hazard Perry, a hero of the War of 1812.[4]
Perry County is included in the Columbus, OH Metropolitan Statistical Area.
One of the poorest counties in the state, this is where the lawsuit challenging Ohio's school funding system, DeRolph v. State, began.
Geography
According to the U.S. Census Bureau, the county has a total area of 412 square miles (1,070 km2), of which 408 square miles (1,060 km2) is land and 4.5 square miles (12 km2) (1.1%) is water.[5]
Adjacent counties
- Licking County (north)
- Muskingum County (northeast)
- Morgan County (southeast)
- Athens County (south)
- Hocking County (southwest)
- Fairfield County (west)
National protected area
- Wayne National Forest (part)
Demographics
| Historical population | |||
|---|---|---|---|
| Census | Pop. | %± | |
| 1820 | 8,429 | — | |
| 1830 | 13,970 | 65.7% | |
| 1840 | 19,344 | 38.5% | |
| 1850 | 20,775 | 7.4% | |
| 1860 | 19,678 | −5.3% | |
| 1870 | 18,453 | −6.2% | |
| 1880 | 28,218 | 52.9% | |
| 1890 | 31,151 | 10.4% | |
| 1900 | 31,841 | 2.2% | |
| 1910 | 35,396 | 11.2% | |
| 1920 | 36,098 | 2.0% | |
| 1930 | 31,445 | −12.9% | |
| 1940 | 31,087 | −1.1% | |
| 1950 | 28,999 | −6.7% | |
| 1960 | 27,864 | −3.9% | |
| 1970 | 27,434 | −1.5% | |
| 1980 | 31,032 | 13.1% | |
| 1990 | 31,557 | 1.7% | |
| 2000 | 34,078 | 8.0% | |
| 2010 | 36,058 | 5.8% | |
| Est. 2017 | 36,024 | [6] | −0.1% |
| U.S. Decennial Census[7] 1790-1960[8] 1900-1990[9] 1990-2000[10] 2010-2017[2] | |||
2000 census
As of the census[11] of 2000, there were 34,078 people, 12,500 households, and 9,350 families residing in the county. The population density was 83 people per square mile (32/km²). There were 13,655 housing units at an average density of 33 per square mile (13/km²). The racial makeup of the county was 98.54% White, 0.22% Black or African American, 0.28% Native American, 0.10% Asian, 0.01% Pacific Islander, 0.09% from other races, and 0.76% from two or more races. 0.45% of the population were Hispanic or Latino of any race.
There were 12,500 households out of which 36.7% had children under the age of 18 living with them, 60.1% were married couples living together, 9.8% had a female householder with no husband present, and 25.2% were non-families. 21.4% of all households were made up of individuals and 9.9% had someone living alone who was 65 years of age or older. The average household size was 2.70 and the average family size was 3.13.
In the county, the population was spread out with 28.1% under the age of 18, 8.5% from 18 to 24, 29.1% from 25 to 44, 22.3% from 45 to 64, and 12.0% who were 65 years of age or older. The median age was 35 years. For every 100 females there were 98.9 males. For every 100 females age 18 and over, there were 95.4 males.
The median income for a household in the county was $34,383, and the median income for a family was $40,294. Males had a median income of $31,664 versus $21,147 for females. The per capita income for the county was $15,674. About 9.4% of families and 11.8% of the population were below the poverty line, including 15.2% of those under age 18 and 12.70% of those age 65 or over.
2010 census
As of the 2010 United States Census, there were 36,058 people, 13,576 households, and 9,738 families residing in the county.[12] The population density was 88.4 inhabitants per square mile (34.1/km2). There were 15,211 housing units at an average density of 37.3 per square mile (14.4/km2).[13] The racial makeup of the county was 97.9% white, 0.3% black or African American, 0.2% American Indian, 0.1% Asian, 0.1% from other races, and 1.4% from two or more races. Those of Hispanic or Latino origin made up 0.5% of the population.[12] In terms of ancestry, 25.4% were German, 14.9% were Irish, 10.4% were English, and 9.6% were American.[14]
Of the 13,576 households, 35.7% had children under the age of 18 living with them, 54.3% were married couples living together, 11.6% had a female householder with no husband present, 28.3% were non-families, and 22.8% of all households were made up of individuals. The average household size was 2.63 and the average family size was 3.06. The median age was 38.6 years.[12]
The median income for a household in the county was $42,388 and the median income for a family was $50,489. Males had a median income of $39,305 versus $31,112 for females. The per capita income for the county was $18,916. About 14.2% of families and 18.5% of the population were below the poverty line, including 26.4% of those under age 18 and 8.6% of those age 65 or over.[15]
Politics
| Year | Republican | Democratic | Third parties |
|---|---|---|---|
| 2016 | 67.7% 10,228 | 27.4% 4,138 | 4.9% 735 |
| 2012 | 50.8% 7,627 | 46.8% 7,033 | 2.4% 360 |
| 2008 | 50.0% 7,721 | 47.0% 7,261 | 3.0% 455 |
| 2004 | 51.7% 7,856 | 47.8% 7,257 | 0.5% 76 |
| 2000 | 50.2% 6,440 | 46.0% 5,895 | 3.8% 493 |
| 1996 | 37.0% 4,606 | 46.8% 5,819 | 16.3% 2,022 |
| 1992 | 34.8% 4,712 | 36.7% 4,972 | 28.5% 3,863 |
| 1988 | 56.3% 6,602 | 42.7% 5,011 | 1.0% 118 |
| 1984 | 65.1% 7,548 | 34.2% 3,961 | 0.8% 88 |
| 1980 | 53.8% 5,725 | 41.2% 4,383 | 5.1% 540 |
| 1976 | 46.4% 5,637 | 51.6% 6,268 | 1.9% 233 |
| 1972 | 62.1% 6,716 | 34.5% 3,728 | 3.4% 365 |
| 1968 | 45.0% 4,815 | 44.9% 4,811 | 10.1% 1,084 |
| 1964 | 33.3% 3,895 | 66.7% 7,816 | |
| 1960 | 59.6% 7,658 | 40.4% 5,191 | |
| 1956 | 64.6% 7,511 | 35.4% 4,123 | |
| 1952 | 58.5% 7,425 | 41.5% 5,275 | |
| 1948 | 51.8% 5,692 | 47.9% 5,264 | 0.3% 36 |
| 1944 | 59.2% 7,339 | 40.8% 5,050 | |
| 1940 | 55.5% 8,656 | 44.5% 6,953 | |
| 1936 | 43.2% 6,826 | 53.9% 8,508 | 2.9% 451 |
| 1932 | 49.3% 7,225 | 45.9% 6,714 | 4.8% 704 |
| 1928 | 64.4% 8,551 | 35.0% 4,653 | 0.6% 75 |
| 1924 | 58.1% 7,592 | 28.3% 3,702 | 13.6% 1,771 |
| 1920 | 54.8% 7,685 | 42.2% 5,917 | 3.0% 416 |
| 1916 | 47.9% 3,953 | 46.7% 3,860 | 5.4% 448 |
| 1912 | 21.6% 1,739 | 39.1% 3,147 | 39.3% 3,166[17] |
| 1908 | 49.5% 4,304 | 44.7% 3,885 | 5.9% 509 |
| 1904 | 60.3% 4,883 | 35.2% 2,846 | 4.5% 366 |
| 1900 | 52.6% 4,180 | 45.3% 3,599 | 2.1% 170 |
| 1896 | 48.6% 3,989 | 50.1% 4,112 | 1.2% 102 |
| 1892 | 47.1% 3,359 | 48.1% 3,430 | 4.8% 341 |
| 1888 | 49.2% 3,528 | 48.4% 3,474 | 2.4% 175 |
| 1884 | 48.2% 3,222 | 46.6% 3,114 | 5.2% 350 |
| 1880 | 42.8% 2,676 | 51.0% 3,187 | 6.2% 384 |
| 1876 | 40.2% 2,084 | 54.2% 2,810 | 5.5% 287 |
| 1872 | 46.7% 1,907 | 53.2% 2,172 | 0.2% 7 |
Communities

Villages
Townships
https://web.archive.org/web/20160715023447/http://www.ohiotownships.org/township-websites
Census-designated places
Other unincorporated communities
Ghost towns
See also
External links
Footnotes
- ↑ "Ohio County Profiles: Perry County" (PDF). Ohio Department of Development. Archived from the original (PDF) on 2007-06-21. Retrieved 2007-04-28.
- 1 2 "State & County QuickFacts". United States Census Bureau. Archived from the original on July 16, 2011. Retrieved February 10, 2015.
- ↑ "Find a County". National Association of Counties. Archived from the original on 2011-05-31. Retrieved 2011-06-07.
- ↑ "Perry County data". Ohio State University Extension Data Center. Retrieved 2007-04-28.
- ↑ "2010 Census Gazetteer Files". United States Census Bureau. August 22, 2012. Archived from the original on May 4, 2014. Retrieved February 10, 2015.
- ↑ "Population and Housing Unit Estimates". Retrieved June 9, 2017.
- ↑ "U.S. Decennial Census". United States Census Bureau. Archived from the original on May 12, 2015. Retrieved February 10, 2015.
- ↑ "Historical Census Browser". University of Virginia Library. Retrieved February 10, 2015.
- ↑ Forstall, Richard L., ed. (March 27, 1995). "Population of Counties by Decennial Census: 1900 to 1990". United States Census Bureau. Retrieved February 10, 2015.
- ↑ "Census 2000 PHC-T-4. Ranking Tables for Counties: 1990 and 2000" (PDF). United States Census Bureau. April 2, 2001. Retrieved February 10, 2015.
- ↑ "American FactFinder". United States Census Bureau. Archived from the original on 2013-09-11. Retrieved 2008-01-31.
- 1 2 3 "DP-1 Profile of General Population and Housing Characteristics: 2010 Demographic Profile Data". United States Census Bureau. Retrieved 2015-12-27.
- ↑ "Population, Housing Units, Area, and Density: 2010 - County". United States Census Bureau. Retrieved 2015-12-27.
- ↑ "DP02 SELECTED SOCIAL CHARACTERISTICS IN THE UNITED STATES – 2006-2010 American Community Survey 5-Year Estimates". United States Census Bureau. Retrieved 2015-12-27.
- ↑ "DP03 SELECTED ECONOMIC CHARACTERISTICS – 2006-2010 American Community Survey 5-Year Estimates". United States Census Bureau. Retrieved 2015-12-27.
- ↑ Leip, David. "Dave Leip's Atlas of U.S. Presidential Elections". uselectionatlas.org. Retrieved 2018-05-03.
- ↑ The leading "other" candidate, Progressive Theodore Roosevelt, received 2,220 votes, while Socialist candidate Eugene Debs received 806 votes, Prohibition candidate Eugene Chafin received 104 votes, and Socialist Labor candidate Arthur Reimer received 36 votes.
Further reading
- Thomas William Lewis, History of Southeastern Ohio and the Muskingum Valley, 1788-1928. In Three Volumes. Chicago: S.J. Clarke Publishing Co., 1928.
Places adjacent to Perry County, Ohio | ||||||||||
|---|---|---|---|---|---|---|---|---|---|---|
| ||||||||||
Municipalities and communities of Perry County, Ohio, United States | ||
|---|---|---|
| Villages | | |
| Townships | ||
| CDPs | ||
| Unincorporated communities | ||
| Ghost towns | ||
| Footnotes | ‡This populated place also has portions in an adjacent county or counties | |