Cuyahoga County, Ohio
| Cuyahoga County, Ohio | |
|---|---|
| County | |
| Cuyahoga County | |
 The Cuyahoga County Courthouse in 2008 | |
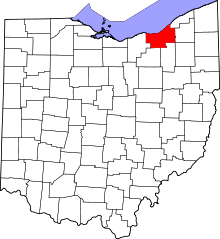 Location in the U.S. state of Ohio | |
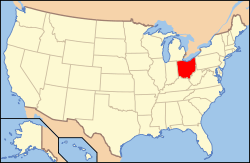 Ohio's location in the U.S. | |
| Founded | May 1, 1810 |
| Named for | "crooked river" possibly in Algonquian |
| Seat | Cleveland |
| Largest city | Cleveland |
| Area | |
| • Total | 1,246 sq mi (3,227 km2) |
| • Land | 457 sq mi (1,184 km2) |
| • Water | 788 sq mi (2,041 km2), 63% |
| Population (est.) | |
| • (2017) |
|
| • Density | 2,800/sq mi (1,100/km2) |
| Congressional districts | 9th, 11th, 14th, 16th |
| Time zone | Eastern: UTC−5/−4 |
| Website |
www |
Cuyahoga County (/ˌkaɪ.əˈhɒɡə/ or /ˌkaɪ.əˈhoʊɡə/[1][2][3][4] KY-ə-HOG-ə or KY-ə-HOH-gə) is a county in the U.S. state of Ohio. As of the 2016 United States Census estimates, the population was 1,249,352, making it the second most populous county in the state.[5] Its county seat is Cleveland.[6] The county is named after the Iroquoian word Cuyahoga, which means 'crooked river'.[7] The name is also assigned to the Cuyahoga River, which bisects the county.
Cuyahoga County is included in the Cleveland-Elyria, OH Metropolitan Statistical Area.
Former U.S. President James A. Garfield was born in what was Cuyahoga County's Orange Township.
History
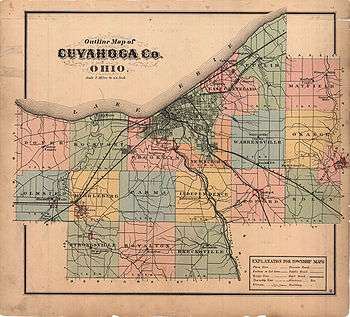
After the discovery of the New World, the land that became Cuyahoga County was originally part of the French colony of Canada (New France), which was ceded in 1763 to Great Britain and renamed Province of Quebec. In the late 18th century the land became part of the Connecticut Western Reserve in the Northwest Territory, then was purchased by the Connecticut Land Company in 1795.
Cuyahoga County was created on June 7, 1807 and organized on May 1, 1810.[8][9] It was reduced by the creation of Huron, Lake, and Lorain Counties.[10] It was named after the Cuyahoga River.
Geography
According to the U.S. Census Bureau, the county has an area of 1,246 square miles (3,230 km2), of which 457 square miles (1,180 km2) is land and 788 square miles (2,040 km2) (63%) is water.[11] It is the second-largest county in Ohio by area. A portion of Cuyahoga Valley National Park is in the county's southeastern section.
Adjacent counties
- Lake County (northeast)
- Geauga County (east)
- Summit County (southeast)
- Medina County (southwest)
- Lorain County (west)
- Portage County (southeast)
Major highways
Demographics
| Historical population | |||
|---|---|---|---|
| Census | Pop. | %± | |
| 1810 | 1,459 | — | |
| 1820 | 6,328 | 333.7% | |
| 1830 | 10,373 | 63.9% | |
| 1840 | 26,506 | 155.5% | |
| 1850 | 48,099 | 81.5% | |
| 1860 | 78,033 | 62.2% | |
| 1870 | 132,010 | 69.2% | |
| 1880 | 196,943 | 49.2% | |
| 1890 | 309,970 | 57.4% | |
| 1900 | 439,120 | 41.7% | |
| 1910 | 637,425 | 45.2% | |
| 1920 | 943,495 | 48.0% | |
| 1930 | 1,201,455 | 27.3% | |
| 1940 | 1,217,250 | 1.3% | |
| 1950 | 1,389,532 | 14.2% | |
| 1960 | 1,647,895 | 18.6% | |
| 1970 | 1,721,300 | 4.5% | |
| 1980 | 1,498,400 | −12.9% | |
| 1990 | 1,412,140 | −5.8% | |
| 2000 | 1,393,978 | −1.3% | |
| 2010 | 1,280,122 | −8.2% | |
| Est. 2017 | 1,248,514 | [12] | −2.5% |
| U.S. Decennial Census[13] 1790-1960[14] 1900-1990[15] 1990-2000[16] 2010-2013[17] | |||

2000 census
| Largest ancestries (2000) | Percent |
|---|---|
| German | 16.3% |
| Irish | 12.3% |
| Italian | 9.0% |
| Polish | 8.6% |
| English | 5.9% |
| Slovak | 3.7% |
As of the 2010 Census, there were 1,280,122 people, 571,457 households, and 319,996 families residing in the county. The population density was 2,800 people per square mile (1,081/km²). There were 621,763 housing units at an average density of 1,346 per square mile (520/km²). The racial makeup of the county was 63.6% White, 29.7% African American, 0.2% Native American, 2.6% Asian (0.9% Indian, 0.7% Chinese, 0.3% Filipino, 0.2% Korean, 0.2% Vietnamese, 0.1% Japanese), 0.02% Pacific Islander, 1.8% from other races, and 2.1% from two or more races. 4.8% of the population were Hispanic or Latino of any race (3.1% Puerto Rican, 0.7% Mexican, 0.1% Dominican, 0.1% Guatemalan).[18] 16.5% were of German, 12.8% Irish, 8.8% Italian, 8.1% Polish, 5.9% English, 3.7% Slovak and 3.1% Hungarian, ancestries.
There are also sizable numbers of Russians (1.7%), French, (1.4%), Arabs (1.4%), Ukrainians (1.2%), and Greeks (0.7%). 88.4% spoke English, 3.7% Spanish, and 4.9% some other Indo-European language.[19] 7.3% of the population were foreign-born (of which 44.4% were born in Europe, 36.3% Asia, and 12.1% Latin America).[19][20]
There were 571,457 households out of which 28.50% had children under the age of 18 living with them, 42.40% were married couples living together, 15.70% had a female householder with no husband present, and 37.90% were non-families. 32.80% of all households were made up of individuals and 12.10% had someone living alone who was 65 years of age or older. The average household size was 2.39 and the average family size was 3.06.
In the county, the population was spread out with 25.00% under the age of 18, 8.00% from 18 to 24, 29.30% from 25 to 44, 22.20% from 45 to 64, and 15.60% who were 65 years of age or older. The median age was 37 years. For every 100 females there were 89.50 males. For every 100 females age 18 and over, there were 85.20 males.
The median income for a household in the county was $43,603, and the median income for a family was $58,631. The per capita income for the county was $26,263. About 10.30% of families and 13.10% of the population were below the poverty line, including 19.40% of those under age 18 and 9.30% of those age 65 or over.[21]
2010 census
| Largest ancestries (2010) | Percent |
|---|---|
| German | 17.4% |
| Irish | 13.0% |
| Italian | 9.2% |
| Polish | 8.6% |
| English | 6.3% |
| Slovak | 3.3% |
As of the 2010 United States Census, there were 1,280,122 people, 545,056 households, and 319,996 families residing in the county.[22] The population density was 2,800.0 inhabitants per square mile (1,081.1/km2). There were 621,763 housing units at an average density of 1,360.0 per square mile (525.1/km2).[23] The racial makeup of the county was 63.6% white, 29.7% black or African American, 2.6% Asian, 0.2% American Indian, 1.8% from other races, and 2.1% from two or more races. Those of Hispanic or Latino origin made up 4.8% of the population.[22] In terms of ancestry, 17.4% were German, 13.0% were Irish, 9.2% were Italian, 8.6% were Polish, 6.3% were English, and 2.8% were American.[24]
Of the 545,056 households, 28.4% had children under the age of 18 living with them, 37.5% were married couples living together, 16.7% had a female householder with no husband present, 41.3% were non-families, and 35.5% of all households were made up of individuals. The average household size was 2.29 and the average family size was 3.01. The median age was 40.2 years.[22]
The median income for a household in the county was $43,603 and the median income for a family was $58,064. Males had a median income of $47,182 versus $36,683 for females. The per capita income for the county was $26,263. About 12.4% of families and 16.4% of the population were below the poverty line, including 24.7% of those under age 18 and 10.9% of those age 65 or over.[25]
Government
The Cuyahoga County Council and Executive exercise direct government over unincorporated areas of Cuyahoga County. As of 2012, this consisted of two small areas: Chagrin Falls Township and Olmsted Township.[26]
Cuyahoga County had long been led by a three-member Board of County Commissioners. In July 2008, Federal Bureau of Investigation agents began raiding the offices of Cuyahoga County Commissioners and those of a wide range of cities, towns, and villages across Cuyahoga County. The investigation revealed extensive bribery and corruption across the area, affecting hundreds of millions of dollars in county contracts and business. The investigation led to the arrest of county commissioner Jimmy Dimora; county auditor Frank Russo; MetroHealth vice president John J. Carroll; former Strongsville councilman Patrick Coyne; former Ohio District Courts of Appeals judge Anthony O. Calabrese III; former Cuyahoga County Court of Common Pleas judge Bridget McCafferty; Cuyahoga County Sheriff Gerald McFaul; former Cleveland City Council member Sabra Pierce Scott; Cuyahoga County Court of Common Pleas judge Steven Terry; and a wide range of attorneys, building inspectors, consultants, contractors, school district employees, and mid and low level county workers.[27]
On November 3, 2009, county voters overwhelmingly approved the adoption of a new county charter which replaced the three-commissioner form of county government with an elected county executive and county prosecutor, and an 11-member county council. Each council member represents a single geographic district; there are no at-large districts. The elected offices of auditor, clerk of courts, coroner, engineer, recorder, sheriff, and treasurer were abolished. The county executive was given authority to appoint individuals to these offices, which became part of the executive branch of the county. Summit County is the only other Ohio county with this form of government.[28]
In the November 2, 2010, election, Lakewood mayor Ed FitzGerald (D) defeated Matt Dolan (R) to become the first Cuyahoga County Executive.[29] The first Cuyahoga County Council was also elected, with Democrats winning eight seats, while Republicans won three.[30]
Politics
Cuyahoga County is heavily Democratic in voter registration, having voted for the Democratic presidential candidate in every election since 1960 except 1972.
| Year | Republican | Democratic | Third parties |
|---|---|---|---|
| 2016 | 30.3% 184,212 | 65.4% 398,276 | 4.3% 26,391 |
| 2012 | 29.6% 190,660 | 69.3% 447,273 | 1.1% 7,329 |
| 2008 | 30.0% 199,880 | 68.7% 458,422 | 1.4% 8,997 |
| 2004 | 32.9% 221,600 | 66.6% 448,503 | 0.6% 3,674 |
| 2000 | 33.4% 192,099 | 62.6% 359,913 | 4.0% 22,770 |
| 1996 | 29.2% 163,770 | 60.8% 341,357 | 10.1% 56,765 |
| 1992 | 29.2% 187,186 | 52.7% 337,548 | 18.0% 115,507 |
| 1988 | 40.3% 242,439 | 58.8% 353,401 | 0.9% 5,277 |
| 1984 | 43.6% 284,094 | 55.7% 362,626 | 0.8% 4,913 |
| 1980 | 41.5% 254,883 | 50.0% 307,448 | 8.5% 52,351 |
| 1976 | 41.0% 255,594 | 56.0% 349,186 | 3.0% 18,442 |
| 1972 | 49.9% 329,493 | 48.2% 317,670 | 1.9% 12,588 |
| 1968 | 35.4% 238,791 | 54.0% 363,540 | 10.6% 71,508 |
| 1964 | 28.5% 196,436 | 71.5% 492,911 | |
| 1960 | 40.2% 288,056 | 59.8% 429,030 | |
| 1956 | 53.7% 353,474 | 46.3% 304,558 | |
| 1952 | 50.3% 329,465 | 49.7% 324,962 | |
| 1948 | 43.8% 214,889 | 52.6% 257,958 | 3.6% 17,781 |
| 1944 | 39.7% 217,824 | 60.3% 330,659 | |
| 1940 | 37.6% 209,070 | 62.4% 347,118 | |
| 1936 | 27.1% 128,947 | 65.4% 311,117 | 7.4% 35,354 |
| 1932 | 44.9% 166,337 | 50.1% 185,731 | 5.0% 18,510 |
| 1928 | 53.4% 194,508 | 45.6% 166,188 | 0.9% 3,412 |
| 1924 | 49.3% 130,169 | 9.1% 24,000 | 41.6% 109,897 |
| 1920 | 64.4% 148,857 | 30.5% 70,518 | 5.2% 11,904 |
| 1916 | 39.8% 51,287 | 55.5% 71,533 | 4.7% 6,080 |
| 1912 | 13.8% 14,176 | 42.5% 43,610 | 43.7% 44,838[32] |
| 1908 | 55.4% 56,344 | 39.3% 39,954 | 5.3% 5,431 |
| 1904 | 62.9% 57,367 | 26.5% 24,202 | 10.6% 9,687 |
| 1900 | 50.6% 45,299 | 47.4% 42,440 | 2.1% 1,870 |
| 1896 | 52.8% 42,993 | 46.1% 37,542 | 1.2% 955 |
| 1892 | 45.6% 26,657 | 50.6% 29,543 | 3.8% 2,214 |
| 1888 | 50.9% 25,994 | 46.9% 23,949 | 2.2% 1,103 |
| 1884 | 55.2% 24,052 | 43.0% 18,764 | 1.8% 797 |
| 1880 | 58.7% 22,123 | 40.1% 15,130 | 1.2% 463 |
| 1876 | 55.2% 18,198 | 43.8% 14,425 | 1.0% 340 |
| 1872 | 63.8% 14,451 | 35.4% 8,033 | 0.8% 184 |
Education
Colleges and universities
Cuyahoga County is home to a number of higher education institutions, including:
Bryant & Stratton College Parma
- Cleveland Bartending School Cleveland Heights
- Case Western Reserve University (Cleveland)
- Cleveland Institute of Art (Cleveland)
- Cleveland Institute of Music (Cleveland)
- Cleveland State University (Cleveland)
- Cuyahoga Community College (Cleveland, Highland Hills, Westlake and Parma)
- DeVry University (Seven Hills)
- John Carroll University (University Heights)
- Notre Dame College (South Euclid)
- Kent State University College of Podiatric Medicine (Independence)
- Stautzenberger College (Brecksville)
- Ursuline College (Pepper Pike)
Health
In 2014, Cuyahoga County ranked 65 out of 88 counties in Ohio for health outcomes. This ranking was based on multiple factors including: premature death (7,975 years per 100,000 population, of potential life lost), adults who reported having poor or fair health (15%), average number of poor physical health days reported in a 30-day period (3.3), average number of poor mental health days reported in a 30-day period (4.1), and the percentage of births with low birth-weight (10.4%). Among these factors Cuyahoga did worse than the Ohio average in premature death, poor mental health days, and low birth-weight. Possible explanations as for why Cuyahoga County is lower in health outcomes than the average Ohio county include behavioral factors, access to clinical care, social and economic factors, and environmental factors.[33]
The leading causes of death and disability in Cuyahoga County are chronic diseases such as cancer, heart disease, obesity and diabetes.[34] The cancer mortality rate for Cuyahoga is 192.7 per 100,000 people, the mortality rate due to heart disease is 204.2 per 100,000 people, and the percentage of adult residents that are obese is 26.2%.[35]
Community Comparison of Disparities
According to The Fox Chase Cancer Center, a health disparity can be defined as the existence of inequalities that prevent certain members of a population group from benefiting from the same health status as other groups.[36] Within Cuyahoga County there are many health disparities when comparing cities and demographics. The Hough neighborhood in Cleveland and Lyndhurst can be compared to illustrate some of the disparities. The communities are both in Cuyahoga County and are less than 10 miles apart. They also have similar populations, but a different racial breakdown according to the 2010 US Census. The Hough neighborhood's population was 16,359 (96.1% Black or African American and 2.1% White American) and the Lyndhurst's population was 14,001 (6.4% Black or African American and 90.3% White American). There is a 24-year disparity in life expectancy between the communities.[37] Hough neighborhood residents have a life expectancy of 64 years and residents in Lyndhurst have a life expectancy of 88.5 years.[38] The annual median income in the Hough neighborhood is $13,630[37] while it is $52,272 in Lyndhurst. Data collected from the Center for Community Solutions indicated from 1990 to 2001 the rate of heart disease for residents of the Hough neighborhood was around four times the frequency of Lyndhurst residents. The rate of accidental deaths were nine times higher than the Hough neighborhood.[38]
Health facilities
- University Hospitals Ahuja Medical Center - Beachwood
- University Hospitals Bedford Medical Center - Bedford
- Cleveland Clinic - Cleveland
- Euclid Hospital - Euclid
- Fairview Hospital - Cleveland
- Hillcrest Hospital - Mayfield Heights
- Huron Hospital - East Cleveland
- University Hospitals Seidman Cancer Center - Cleveland
- Lakewood Hospital - Lakewood
- Lutheran Hospital - Cleveland
- University Hospitals MacDonald Women's Hospital - Cleveland
- Marymount Hospital - Garfield Heights
- MetroHealth Medical Center - Cleveland
- University Hospitals Parma Medical Center - Parma
- Rainbow Babies & Children's Hospital - Cleveland
- University Hospitals Richmond Medical Center - Richmond Heights
- South Pointe Hospital - Warrensville Heights
- Southwest General Health Center - Middleburg Heights
- St. Anne's Hospital, historical facility in Cleveland
- St. John Medical Center - Westlake
- St. Vincent Charity Medical Center - Cleveland
- University Hospitals Case Medical Center - University Circle, Cleveland
- Healthspan (formerly Kaiser Permanente of Northeast Ohio) - Bedford, Cleveland, Cleveland Heights, & Parma
Transportation
Airports
Cuyahoga County is served by international, regional and county airports, including:
Major highways
Rail
Cuyahoga County receives intercity passenger service by Amtrak by way of Lakefront Station in Cleveland, with destinations such as Chicago, New York, Boston, Washington, DC and many more.
The Cuyahoga Valley Scenic Railroad offers scenic excursion service through the Cuyahoga Valley National Park by way of their Rockside Station in Independence.
Freight rail service is provided by Norfolk Southern, CSX Transportation, Wheeling and Lake Erie Railroad, Cleveland Commercial Railroad and several other small companies. Norfolk Southern has the largest presence in the county, operating three different lines and several terminal yards.
Public Transportation
The Greater Cleveland Regional Transit Authority, better known as RTA, provides public transportation to Cuyahoga county through a combination of conventional bus, bus rapid transit and rail transit services as well as on demand services. Several other county agencies also serve Cuyahoga County, mostly through downtown Cleveland.
Greyhound, Barons Bus Lines and Megabus provide public transportation beyond Cuyahoga County to destinations across the United States.
Recreation
The Cleveland Metroparks system serves Cuyahoga County. Its 16 reservations provide more than 21,000 acres (8,500 ha) of green space and recreational amenities.[39] The county is home to part of Cuyahoga Valley National Park, which extends southward into Summit County.
Culture
Theaters
- Beck Center (Lakewood)[40]
- Cabaret Dada (Cleveland)[41]
- Cassidy Theater (Parma Heights)[42]
- Cleveland Play House (Cleveland)[43]
- Cleveland Public Theater (Cleveland)[44]
- Dobama Theater (Cleveland Heights)[45]
- East Cleveland Theater (East Cleveland)[46]
- Huntington Playhouse (Bay Village)[47]
- Karamu House (Cleveland)[48]
- Near West Theatre (Cleveland)[49]
- Playhouse Square Center (Cleveland)[50]
Classical Music
- Cleveland Orchestra performs in Severance Hall
Museums
Retail
Cuyahoga County has many options for shopping. Some of the well known shopping areas include:
- In Strongsville, SouthPark Mall: stores include Dillard's, Macy's, JC Penney, Kohl's, Sears, Dicks Sporting Goods, Aldo, Banana Republic, Chico's, Forever 21, H&M, Swarovski, Williams-Sonoma.[53]
- In Beachwood, Beachwood Place: stores include Saks Fifth Avenue, Nordstrom, Dillard's, Coach, True Religion, Lacoste, H&M, ZARA.[54]
- In Woodmere, Eton Square: stores include Anthropologie, Apple Store, Brooks Brothers, Tiffany & Co., The North Face, Orvis, Sur La Table, Trader Joe's.[55]
- In Lyndhurst, Legacy Village: stores include Crate & Barrel, Arhaus Furniture, Ethan Allen, Restoration Hardware, Nordstrom Rack, Z Gallerie, The Cheesecake Factory.[56]
- In Westlake, Crocker Park: stores include Apple Store, Banana Republic, Nordstrom Rack, Guess, Lucky Brand Jeans, Arhaus Furniture.[57]
- In North Olmsted, Great Northern Mall: stores include Dillard's, Macy's, Dicks Sporting Goods, JC Penney, Sears, H&M, Disney Store, Forever 21.
- In Orange, Ohio, Pinecrest opening Spring 2018: stores include Whole Foods, REI, West Elm, Pottery Barn, Williams Sonoma, Orangetheory Fitness[58]
- In University Heights, Ohio, University Square Shopping Center: stores include Macy's, Target, T.J. Maxx, Pier 1 Imports[59]
Communities
Cities
- Bay Village
- Beachwood
- Bedford
- Bedford Heights
- Berea
- Brecksville
- Broadview Heights
- Brook Park
- Brooklyn
- Cleveland (county seat)
- Cleveland Heights
- East Cleveland
- Euclid
- Fairview Park
- Garfield Heights
- Highland Heights
- Independence
- Lakewood
- Lyndhurst
- Maple Heights
- Mayfield Heights
- Middleburg Heights
- North Olmsted
- North Royalton
- Olmsted Falls
- Parma
- Parma Heights
- Pepper Pike
- Richmond Heights
- Rocky River
- Seven Hills
- Shaker Heights
- Solon
- South Euclid
- Strongsville
- University Heights
- Warrensville Heights
- Westlake
Villages
Townships
See also
References
- ↑ Feran, Tom (2004-02-13). "Shooing the hog out of Cuyahoga". The Plain Dealer.
- ↑ Feran, Tom (2006-06-02). "It's a Cleveland thing, so to speak". The Plain Dealer.
- ↑ Siegel, Robert; Block, Melissa (2009-06-23). "Letters: Cuyahoga River". All Things Considered. National Public Radio. Retrieved 2009-06-23.
- ↑ McIntyre, Michael K. (2009-06-28). "How to pronounce 'Cuyahoga' turns into a national debate: Tipoff". The Plain Dealer. Retrieved 2009-06-29.
- ↑ "Franklin County now tops Cuyahoga County in population, census estimates say".
- ↑ "Find a County". National Association of Counties. Archived from the original on 2011-05-31. Retrieved 2011-06-07.
- ↑ "Cuyahoga County data". Ohio State University Extension Data Center. Archived from the original on November 6, 2007. Retrieved 2007-04-28.
- ↑ "Federal Roster: Counties of Ohio, Derivation of Name and Date of Erection". Archived from the original on December 7, 2006. Retrieved February 12, 2015.
- ↑ "Ohio: Individual County Chronologies". Ohio Atlas of Historical County Boundaries. The Newberry Library. 2007. Retrieved February 12, 2015.
- ↑ "Ohio Genealogy Clickable County Map". Archived from the original on 2007-11-18. Retrieved 2007-07-25.
- ↑ "2010 Census Gazetteer Files". United States Census Bureau. August 22, 2012. Archived from the original on May 4, 2014. Retrieved February 7, 2015.
- ↑ "Population and Housing Unit Estimates". Retrieved June 9, 2017.
- ↑ "U.S. Decennial Census". United States Census Bureau. Archived from the original on May 12, 2015. Retrieved February 7, 2015.
- ↑ "Historical Census Browser". University of Virginia Library. Retrieved February 7, 2015.
- ↑ Forstall, Richard L., ed. (March 27, 1995). "Population of Counties by Decennial Census: 1900 to 1990". United States Census Bureau. Retrieved February 7, 2015.
- ↑ "Census 2000 PHC-T-4. Ranking Tables for Counties: 1990 and 2000" (PDF). United States Census Bureau. April 2, 2001. Retrieved February 7, 2015.
- ↑ "State & County QuickFacts". United States Census Bureau. Retrieved February 7, 2015.
- ↑ Bureau, U.S. Census. "American FactFinder - Results". Archived from the original on 2014-03-05.
- 1 2 Bureau, U.S. Census. "American FactFinder - Results".
- ↑ Bureau, U.S. Census. "American FactFinder - Results".
- ↑ Bureau, U.S. Census. "American FactFinder - Results".
- 1 2 3 "DP-1 Profile of General Population and Housing Characteristics: 2010 Demographic Profile Data". United States Census Bureau. Retrieved 2015-12-27.
- ↑ "Population, Housing Units, Area, and Density: 2010 - County". United States Census Bureau. Retrieved 2015-12-27.
- ↑ "DP02 SELECTED SOCIAL CHARACTERISTICS IN THE UNITED STATES – 2006-2010 American Community Survey 5-Year Estimates". United States Census Bureau. Retrieved 2015-12-27.
- ↑ "DP03 SELECTED ECONOMIC CHARACTERISTICS – 2006-2010 American Community Survey 5-Year Estimates". United States Census Bureau. Retrieved 2015-12-27.
- ↑ Johnston, Laura (February 10, 2012). "Cuyahoga County Council could consider charging for plastic bags, in first general law proposal". The Plain Dealer. Retrieved April 9, 2016.
- ↑ Caniglia, John (January 14, 2013). "Cuyahoga County corruption investigation winds down to the finish as bulk of case completed". The Plain Dealer. Retrieved April 9, 2016 ; Dissell, Rachel (December 30, 2011). "The Cuyahoga County corruption case: a who's who". The Plain Dealer. Retrieved April 9, 2016.
- ↑ Johnston, Laura (November 9, 2009). "Cuyahoga County's new government structure will likely bring gradual change, experts say". The Plain Dealer. Retrieved April 9, 2016.
- ↑ Byrne, Brian (November 3, 2010). "Ed FitzGerald is first Cuyahoga County executive". The Plain Dealer. Cleveland, Ohio. Retrieved November 16, 2010.
- ↑ Garrett, Amanda (November 2, 2010). "Three Republicans heading toward victory on Cuyahoga County Council; Dems likely to take other 8 seats". The Plain Dealer. Cleveland, Ohio. Retrieved November 16, 2010.
- ↑ Leip, David. "Dave Leip's Atlas of U.S. Presidential Elections". uselectionatlas.org. Retrieved 2018-05-01.
- ↑ The leading "other" candidate, Progressive Theodore Roosevelt, received 33,824 votes, while Socialist candidate Eugene Debs received 10,096 votes, Prohibition candidate Eugene Chafin received 545 votes, and Socialist Labor candidate Arthur Reimer received 373 votes.
- ↑ "How Healthy is your County? | County Health Rankings". County Health Rankings & Roadmaps. Retrieved 2015-11-04.
- ↑ "Cuyahoga County Health Alliance". wellness.cuyahogacounty.us. Retrieved 2015-11-04.
- ↑ "Community Health Status Assessment for Cuyahoga County, Ohio" (PDF). National Association of County & City Health Officials. Health Improvement Partnership-Cuyahoga. March 2013. Retrieved November 3, 2015.
- ↑ "Fox Chase Cancer Center: Comprehensive Care". www.fccc.edu. Retrieved 2015-11-12.
- 1 2 "County health rankings in Northeast Ohio tell tale of haves and have nots". cleveland.com. Retrieved 2015-11-12.
- 1 2 "HBO documentary explores 24-year difference in life expectancy between Lyndhurst and Cleveland's Hough neighborhood". cleveland.com. Retrieved 2015-11-12.
- ↑ "Cleveland Metroparks: Plan Your Visit". Archived from the original on September 27, 2011. Retrieved July 5, 2011.
- ↑ "Beck Center for the Arts". Lkwdpl.org. 2010-01-03. Archived from the original on 2010-03-16. Retrieved 2010-08-01.
- ↑ "Something Dada Improvisational Comedy". Cabaretdada.com. Retrieved 2010-08-01.
- ↑ Archived February 7, 2015, at the Wayback Machine.
- ↑ "Cleveland Play House". Cleveland Play House. Retrieved 2010-08-01.
- ↑ Pavlish Group: Jason Maxwell / Don Pavlish. "Cleveland Public Theatre ~ Home". Cptonline.org. Retrieved 2010-08-01.
- ↑ "Dobama Theatre - Cleveland's Contemporary Stage". Dobama.org. 2010-06-05. Retrieved 2010-08-01.
- ↑ "EAST CLEVELAND THEATER, Home". www.eastclevelandtheater.org. Retrieved 2016-09-23.
- ↑ "Bay Village, Ohio". Huntington Playhouse. 2010-07-14. Retrieved 2010-08-01.
- ↑ "KARAMU HOUSE – A Joyful Gathering Place".
- ↑ "Near West Theatre". Near West Theatre. Retrieved 2010-08-01.
- ↑ "Home". PlayhouseSquare. Retrieved 2010-08-01.
- ↑ greatscience.com/
- ↑ "International Women Air & Space Museum". www.iwasm.org.
- ↑ "SouthPark Mall Directory - Greater Cleveland's Largest Retail Destination Center". Retrieved 2016-02-20.
- ↑ "Beachwood Place Directory - Top Stores, Shops, Brands in Cleveland, Ohio". Beachwoodplace.com. 2013-01-04. Retrieved 2013-04-20.
- ↑ "E T O N : Chagrin Boulevard : Stores". Etonchagrinblvd.com. Retrieved 2013-04-20.
- ↑ "Directory". Legacy Village. Archived from the original on 2013-02-13. Retrieved 2013-04-20.
- ↑ "Retail Stores – Westlake, Ohio". Crocker Park. Retrieved 2013-04-20.
- ↑ Pinecrest. "About - Pinecrest". Pinecrest.
- ↑
External links
| Wikimedia Commons has media related to Cuyahoga County, Ohio. |

- Cuyahoga County Home Page
- Cuyahoga County Planning Commission
Places adjacent to Cuyahoga County, Ohio | ||||||||||
|---|---|---|---|---|---|---|---|---|---|---|
| ||||||||||
Municipalities and communities of Cuyahoga County, Ohio, United States | ||
|---|---|---|
| Cities |
| |
| Villages | ||
| Townships | ||
| Footnotes | ‡This populated place also has portions in an adjacent county or counties | |