Lebanon County, Pennsylvania
| Lebanon County, Pennsylvania | |
|---|---|
 | |
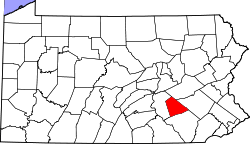 Location in the U.S. state of Pennsylvania | |
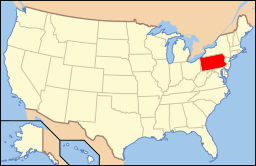 Pennsylvania's location in the U.S. | |
| Founded | February 16, 1813 |
| Seat | Lebanon |
| Largest city | Lebanon |
| Area | |
| • Total | 362 sq mi (938 km2) |
| • Land | 362 sq mi (938 km2) |
| • Water | 0.7 sq mi (2 km2), 0.2% |
| Population (est.) | |
| • (2017) | 139,754 |
| • Density | 379/sq mi (146/km2) |
| Congressional districts | 6th, 15th |
| Time zone | Eastern: UTC−5/−4 |
| Website |
www |
Lebanon (/ˈlɛbənən/) County is a county located in the U.S. state of Pennsylvania. As of the 2010 census, the population was 133,568.[1] Its county seat is Lebanon.[2] The county was formed from portions of Dauphin and Lancaster counties in 1813, with minor boundary revisions in 1814 and 1821.[3] Lebanon County comprises the Lebanon, Pennsylvania, Metropolitan Statistical Area, which is also included in the Harrisburg-York-Lebanon, Pennsylvania Combined Statistical Area.
Geography
According to the U.S. Census Bureau, the county has a total area of 362 square miles (940 km2), of which 362 square miles (940 km2) is land and 0.7 square miles (1.8 km2) (0.2%) is water.[4] Most of it is drained by the Swatara Creek into the Susquehanna River while some eastern portions are drained by the Tulpehocken Creek (which originates in the county near Myerstown) eastward into the Schuylkill River. It consists in large part of a valley.[5]
Adjacent counties
- Schuylkill County, Pennsylvania (northeast)
- Berks County, Pennsylvania (east)
- Lancaster County, Pennsylvania (south)
- Dauphin County, Pennsylvania (west)
Major Highways
Demographics
| Historical population | |||
|---|---|---|---|
| Census | Pop. | %± | |
| 1820 | 16,988 | — | |
| 1830 | 20,557 | 21.0% | |
| 1840 | 21,872 | 6.4% | |
| 1850 | 26,071 | 19.2% | |
| 1860 | 31,831 | 22.1% | |
| 1870 | 34,096 | 7.1% | |
| 1880 | 38,476 | 12.8% | |
| 1890 | 48,131 | 25.1% | |
| 1900 | 53,827 | 11.8% | |
| 1910 | 59,565 | 10.7% | |
| 1920 | 63,152 | 6.0% | |
| 1930 | 67,103 | 6.3% | |
| 1940 | 72,641 | 8.3% | |
| 1950 | 81,683 | 12.4% | |
| 1960 | 90,853 | 11.2% | |
| 1970 | 99,665 | 9.7% | |
| 1980 | 108,582 | 8.9% | |
| 1990 | 113,744 | 4.8% | |
| 2000 | 120,327 | 5.8% | |
| 2010 | 133,568 | 11.0% | |
| Est. 2017 | 139,754 | [6] | 4.6% |
| U.S. Decennial Census[7] 1790-1960[8] 1900-1990[9] 1990-2000[10] 2010-2017[1] | |||
As of the census[11] of 2000, there were 120,327 people and 32,771 families residing in the county. The population density was 332 people per square mile (128/km²). There were 49,320 housing units at an average density of 136 per square mile (53/km²). The racial makeup of the county was 94.46% White, 1.29% Black or African American, 0.13% Native American, 0.89% Asian, 0.04% Pacific Islander, 2.26% from other races, and 0.94% from two or more races. 4.96% of the population were Hispanic or Latino of any race. 45.6% were of German, 11.8% American and 6.1% Irish ancestry. 92.5% spoke English, 4.2% Spanish and 1.1% Pennsylvania Dutch as their first language.
There were 46,551 households out of which 30.40% had children under the age of 18 living with them, 57.40% were married couples living together, 9.20% had a female householder with no husband present, and 29.60% were non-families. 25.20% of all households were made up of individuals and 11.10% had someone living alone who was 65 years of age or older. The average household size was 2.49 and the average family size was 2.98.
In the county, the population was spread out with 23.70% under the age of 18, 8.20% from 18 to 24, 28.00% from 25 to 44, 23.70% from 45 to 64, and 16.40% who were 65 years of age or older. The median age was 39 years. For every 100 females there were 95.00 males. For every 100 females age 18 and over, there were 91.70 males.
Metropolitan Statistical Area
The United States Office of Management and Budget[12] has designated Lebanon County as the Lebanon, PA Metropolitan Statistical Area (MSA). As of the 2010 U.S. Census[13] the metropolitan area ranked 16th most populous in the State of Pennsylvania and the 296th most populous in the United States with a population of 133,568. Lebanon County is also a part of the larger Harrisburg-York-Lebanon, PA Combined Statistical Area (CSA), which combines the populations of Lebanon County as well as Adams, Cumberland, Dauphin, Perry and York Counties in Pennsylvania. The Combined Statistical Area ranked 5th in the State of Pennsylvania and 43rd most populous in the United States with a population of 1,219,422.
Politics and government
| Year | Republican | Democratic | Third Parties |
|---|---|---|---|
| 2016 | 64.8% 40,525 | 30.3% 18,953 | 4.8% 3,025 |
| 2012 | 63.2% 35,872 | 35.1% 19,900 | 1.8% 1,005 |
| 2008 | 58.6% 34,314 | 39.8% 23,310 | 1.6% 939 |
| 2004 | 66.6% 37,089 | 32.5% 18,109 | 0.8% 467 |
| 2000 | 62.2% 28,534 | 35.1% 16,093 | 2.8% 1,270 |
| 1996 | 53.7% 21,885 | 34.8% 14,187 | 11.5% 4,663 |
| 1992 | 50.0% 21,512 | 28.7% 12,350 | 21.3% 9,159 |
| 1988 | 66.7% 24,415 | 32.5% 11,912 | 0.8% 281 |
| 1984 | 71.6% 27,008 | 27.9% 10,520 | 0.5% 188 |
| 1980 | 69.0% 24,495 | 23.3% 8,281 | 7.7% 2,731 |
| 1976 | 62.7% 20,880 | 35.4% 11,785 | 2.0% 665 |
| 1972 | 77.4% 25,008 | 20.7% 6,683 | 2.0% 629 |
| 1968 | 64.2% 21,832 | 28.0% 9,529 | 7.8% 2,664 |
| 1964 | 52.9% 17,891 | 46.9% 15,882 | 0.2% 72 |
| 1960 | 68.3% 25,525 | 31.5% 11,761 | 0.2% 67 |
| 1956 | 68.4% 22,556 | 31.5% 10,406 | 0.1% 41 |
| 1952 | 63.8% 20,726 | 35.8% 11,611 | 0.4% 135 |
| 1948 | 61.6% 15,553 | 37.3% 9,418 | 1.1% 270 |
| 1944 | 56.0% 15,206 | 43.5% 11,818 | 0.5% 129 |
| 1940 | 50.1% 13,449 | 49.6% 13,315 | 0.4% 93 |
| 1936 | 48.1% 13,213 | 50.2% 13,800 | 1.7% 463 |
| 1932 | 59.0% 10,487 | 33.3% 5,924 | 7.7% 1,373 |
| 1928 | 82.3% 16,841 | 16.0% 3,278 | 1.7% 345 |
| 1924 | 74.3% 9,494 | 19.3% 2,464 | 6.5% 825 |
| 1920 | 70.8% 8,778 | 24.3% 3,016 | 4.9% 608 |
| 1916 | 57.5% 5,876 | 37.4% 3,821 | 5.2% 531 |
| 1912 | 22.5% 2,378 | 28.1% 2,972 | 49.4% 5,230 |
| 1908 | 67.1% 6,874 | 27.9% 2,858 | 5.0% 515 |
| 1904 | 70.2% 6,938 | 24.8% 2,449 | 5.0% 497 |
| 1900 | 66.8% 7,089 | 28.7% 3,050 | 4.5% 479 |
| 1896 | 70.6% 7,288 | 27.3% 2,819 | 2.1% 216 |
| 1892 | 59.1% 5,403 | 37.3% 3,409 | 3.6% 329 |
| 1888 | 61.6% 6,096 | 37.1% 3,670 | 1.3% 129 |
United States House of Representatives
The county is divided into the 6th congressional district, represented by Ryan Costello, Republican, and the 15th congressional district, represented by Charlie Dent, Republican.
State Senate
All of the county falls within the 48th Pennsylvania Senatorial District. The seat is currently held by State Sen. Mike Folmer, a Republican.
State House of Representatives
The county is divided into the 101st, 102nd and 104th Pennsylvania House Districts.
101st District
- The 101st District, served by Republican Mauree Gingrich, whose term expires in 2015, includes:
102nd District
- The 102nd District, served by Republican Russ Diamond, whose term expires in 2017, includes:
104th District
The 104th District, which includes North Annville Twp. and East Hanover Twp., is represented by Republican Sue Helm, whose term expires 2015.
County government
The county is governed by three commissioners, who are elected every four years from a slate of four candidates (two Democrats and two Republicans). Other elected officials include County Controller, Sheriff, Coroner, Prothonotary and Clerk of Court, Recorder of Deeds, County Treasurer, and Jury Commissioners.
Voter registration
As of November 2008, there are 82,394 registered voters in Lebanon County.[15]
- Republican: 44,228 (53.68%)
- Democratic: 27,646 (33.55%)
- Other Parties: 10,520 (12.77%)
Electoral history
The county has a history of being one of the most Republican counties in Pennsylvania. No Democratic Presidential candidate has won Lebanon County since 1936, when Franklin Delano Roosevelt narrowly carried it even as he won re-election in a landslide nationally. The only other time in the 20th century that the county didn't support a Republican was in 1912, when Theodore Roosevelt carried it on the Bull Moose ticket.
Republicans are no less dominant at the state and local level. The row offices and all but one county commission seat are held by Republicans, and there are no elected Democrats above the county level.
Lebanon County was one of only four counties in the state to vote for Barry Goldwater in 1964, along with Snyder, Union, and Wayne counties.
In the 2006 election for U.S. Senate, the county cast 21,756 votes (55.1%) for Republican Rick Santorum and 17,737 (44.9%) for Democrat Bob Casey, Jr., who won the race. In that year's gubernatorial election, the county cast 22,775 votes (57.5%) for Republican Lynn Swann and 16,813 (42.5%) for Democrat Ed Rendell, who won the race.[16]
In the 2004 presidential election, the county cast 37,089 votes (66.6%) for Republican George W. Bush and 18,109 (32.5%) for Democrat John Kerry. In that same year's election for U.S. Senate, the county cast 35,336 votes (66.8%) for Republican Arlen Specter, 13,182 for Democrat Joe Hoeffel, 3,320 (6.3%) for Constitution Party candidate Jim Clymer, and 1,083 (2.0%) for Libertarian Betsy Summers.[17] In the 2008 presidential election the county cast 34,314 votes (58.59%) for Republican John McCain and 23,310 votes (39.8%) for Barack Obama.[18] In the 2016 presidential election, the county cast 38,804 votes (65,9 %) for Republican Donald Trump and 17,860 votes (30,3 %) for Democrat Hillary Clinton.[19]
In the 2002 gubernatorial election, the county cast 22,659 votes (62.7%) for Republican Mike Fisher and 12,712 (35.2%) for Democrat Ed Rendell, who won the race. In the 2002 race for the U.S. House of Representatives, Republican George Gekas received 21,733 votes (60.9%) from the county while Democrat Tim Holden received 13,945 (39.1%); Holden won.[20]
Education
Colleges and universities
- Harrisburg Area Community College (Lebanon Campus)
- Lebanon Valley College
- Evangelical Seminary
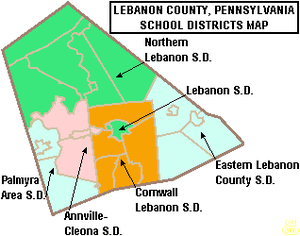
Public school districts
Communities
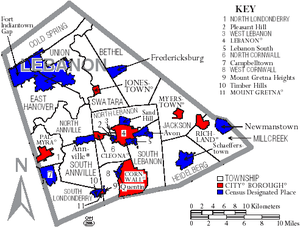
Under Pennsylvania law, there are four types of incorporated municipalities: cities, boroughs, townships, and, in at most two cases, towns. The following cities, boroughs and townships are located in Lebanon County:
City
- Lebanon (county seat)
Boroughs
Townships
Census-designated places
Census-designated places are geographical areas designated by the U.S. Census Bureau for the purposes of compiling demographic data. They are not actual jurisdictions under Pennsylvania law.
Other unincorporated communities
- Greenpoint
- McGillstown
- Ono
Population ranking
The population ranking of the following table is based on the 2010 census of Lebanon County.[13]
† county seat
| Rank | City/Town/etc. | Municipal type | Population (2010 Census)
|
|---|---|---|---|
| 1 | † Lebanon | City | 25,477 |
| 2 | Palmyra | Borough | 7,320 |
| 3 | Annville (township) | CDP | 4,767 |
| 4 | Cornwall | Borough | 4,112 |
| 5 | Campbelltown | CDP | 3,616 |
| 6 | Myerstown | Borough | 3,062 |
| 7 | Pleasant Hill | CDP | 2,643 |
| 8 | Sand Hill | CDP | 2,496 |
| 9 | Newmanstown | CDP | 2,478 |
| 10 | Lebanon South | CDP | 2,270 |
| 11 | Cleona | Borough | 2,080 |
| 12 | Jonestown | Borough | 1,905 |
| 13 | Avon | CDP | 1,667 |
| 14 | Richland | Borough | 1,519 |
| 15 | Fredericksburg | CDP | 1,357 |
| 16 | Hebron | CDP | 1,305 |
| 17 | Schaefferstown | CDP | 941 |
| 18 | Quentin | CDP | 594 |
| 19 | Timber Hills | CDP | 360 |
| 20 | Mount Gretna Heights | CDP | 323 |
| 21 | Mount Gretna | Borough | 196 |
| 22 | Fort Indiantown Gap | CDP | 143 |
See also
Parks & Recreational Places to Visit
References
- 1 2 "State & County QuickFacts". United States Census Bureau. Archived from the original on July 13, 2011. Retrieved November 17, 2013.
- ↑ "Find a County". National Association of Counties. Archived from the original on May 31, 2011. Retrieved June 7, 2011.
- ↑ Our County Archived July 9, 2013, at the Wayback Machine.. Lebanon County Historical Society. Retrieved on July 23, 2013.
- ↑ "2010 Census Gazetteer Files". United States Census Bureau. August 22, 2012. Retrieved March 9, 2015.
- ↑

- ↑ "Population and Housing Unit Estimates". Retrieved October 14, 2018.
- ↑ "U.S. Decennial Census". United States Census Bureau. Archived from the original on May 12, 2015. Retrieved March 9, 2015.
- ↑ "Historical Census Browser". University of Virginia Library. Archived from the original on August 16, 2012. Retrieved March 9, 2015.
- ↑ Forstall, Richard L., ed. (March 24, 1995). "Population of Counties by Decennial Census: 1900 to 1990". United States Census Bureau. Archived from the original on March 20, 2015. Retrieved March 9, 2015.
- ↑ "Census 2000 PHC-T-4. Ranking Tables for Counties: 1990 and 2000" (PDF). United States Census Bureau. April 2, 2001. Archived (PDF) from the original on December 18, 2014. Retrieved March 9, 2015.
- ↑ "American FactFinder". United States Census Bureau. Archived from the original on 2013-09-11. Retrieved 2008-01-31.
- ↑ "Office of Management and Budget". whitehouse.gov. Archived from the original on 29 April 2018. Retrieved 4 May 2018.
- 1 2 "Archived copy". Archived from the original on 2013-12-21. Retrieved 2016-07-10.
- ↑ Leip, David. "Dave Leip's Atlas of U.S. Presidential Elections". uselectionatlas.org. Archived from the original on 23 March 2018. Retrieved 4 May 2018.
- ↑ Commonwealth of Pennsylvania Department of State. "November 2008 Voter Registration Statistics". Archived from the original (XLS) on 2008-11-26. Retrieved 2008-11-03.
- ↑ "Archived copy". Archived from the original on 2008-05-29. Retrieved 2009-03-10.
- ↑ "Archived copy". Archived from the original on 2008-11-27. Retrieved 2009-03-10.
- ↑ "Archived copy". Archived from the original on 2008-12-01. Retrieved 2009-01-05.
- ↑ "Pennsylvania Election Results 2016: President Live Map by County, Real-Time Voting Updates". Election Hub. Archived from the original on 7 November 2017. Retrieved 4 May 2018.
- ↑ "Archived copy". Archived from the original on 2008-05-15. Retrieved 2008-05-16.
External links

- County of Lebanon (official website)
- Lebanon County Pages
- Lebanon County Historical Society
- Lebanon County Tourism Promotion Agency
- Lebanon Valley Exposition Center and Fairgrounds
Municipalities and communities of Lebanon County, Pennsylvania, United States | ||
|---|---|---|
| City | | |
| Boroughs | ||
| Townships | ||
| CDPs | ||
| Unincorporated communities | ||