Erie County, Ohio
| Erie County, Ohio | ||
|---|---|---|
 | ||
| ||
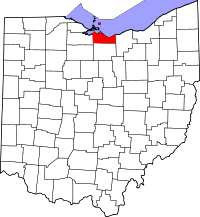 Location in the U.S. state of Ohio | ||
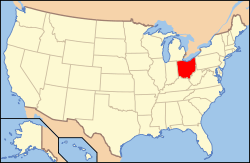 Ohio's location in the U.S. | ||
| Founded | March 16, 1838[1] | |
| Named for | Erie tribe | |
| Seat | Sandusky | |
| Largest city | Sandusky | |
| Area | ||
| • Total | 626 sq mi (1,621 km2) | |
| • Land | 252 sq mi (653 km2) | |
| • Water | 374 sq mi (969 km2), 60% | |
| Population | ||
| • (2010) | 77,079 | |
| • Density | 306/sq mi (118/km2) | |
| Congressional districts | 4th, 9th | |
| Time zone | Eastern: UTC−5/−4 | |
| Website |
www | |

Erie County is a county located in the U.S. state of Ohio. As of the 2010 census, the population was 77,079.[2] Its county seat is Sandusky.[3] The county is named for the Erie tribe, whose name was their word for "wildcat".[4] It was formed in 1838 from the northern third of Huron County and a portion of Sandusky County.
Erie County comprises the Sandusky, OH Micropolitan Statistical Area, which is also included in the Cleveland-Akron-Canton, OH Combined Statistical Area.[5]
It is home to the Cedar Fair entertainment company and their flagship amusement park Cedar Point.
History
Erie County was initially created about 1838, and formed from a portion of Huron County. A few subsequent changes to Erie County's boundaries occurred shortly after its initial formation.[6]
Geography
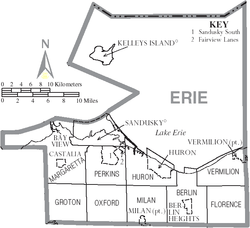
According to the U.S. Census Bureau, the county has a total area of 626 square miles (1,620 km2), of which 252 square miles (650 km2) is land and 374 square miles (970 km2) (60%) is water.[7] It is the second-smallest county in Ohio by land area after Lake County . The county is bordered on the north by Lake Erie; the opposite shore is made up of two counties in Ontario, Canada.
It is drained by the Huron and Vermilion rivers. Near the Huron River are several ancient earthwork mounds and enclosures constructed by early indigenous peoples. Sandusky has extensive quarries of valuable limestone. The surface is generally level, and the soil alluvial and exceedingly fertile.[8]
Adjacent counties and municipalities
- Essex County, Ontario (north, across Lake Erie)
- Chatham-Kent municipality, Ontario (north, across Lake Erie)
- Lorain County (east)
- Huron County (south)
- Sandusky County (west)
- Ottawa County (northwest)
Major highways
Demographics
| Historical population | |||
|---|---|---|---|
| Census | Pop. | %± | |
| 1840 | 12,599 | — | |
| 1850 | 18,568 | 47.4% | |
| 1860 | 24,474 | 31.8% | |
| 1870 | 28,188 | 15.2% | |
| 1880 | 32,640 | 15.8% | |
| 1890 | 35,462 | 8.6% | |
| 1900 | 37,650 | 6.2% | |
| 1910 | 38,327 | 1.8% | |
| 1920 | 39,789 | 3.8% | |
| 1930 | 42,133 | 5.9% | |
| 1940 | 43,201 | 2.5% | |
| 1950 | 52,565 | 21.7% | |
| 1960 | 68,000 | 29.4% | |
| 1970 | 75,909 | 11.6% | |
| 1980 | 79,655 | 4.9% | |
| 1990 | 76,779 | −3.6% | |
| 2000 | 79,551 | 3.6% | |
| 2010 | 77,079 | −3.1% | |
| Est. 2017 | 74,817 | [9] | −2.9% |
| U.S. Decennial Census[10] 1790-1960[11] 1900-1990[12] 1990-2000[13] 2010-2017[2] | |||
2000 census
As of the census[14] of 2000, there were 79,551 people, 31,727 households, and 21,764 families residing in the county. The population density was 312 people per square mile (121/km²). There were 35,909 housing units at an average density of 141 per square mile (54/km²). The racial makeup of the county was 88.64% White, 8.64% Black or African American, 0.21% Native American, 0.37% Asian, 0.01% Pacific Islander, 0.53% from other races, and 1.60% from two or more races. 2.09% of the population were Hispanic or Latino of any race. 35.7% were of German, 9.2% Irish, 8.2% English, 8.1% Italian, and 7.8% American ancestry according to Census 2000.
There were 31,727 households out of which 30.40% had children under the age of 18 living with them, 53.70% were married couples living together, 11.20% had a female householder with no husband present, and 31.40% were non-families. 27.00% of all households were made up of individuals and 10.80% had someone living alone who was 65 years of age or older. The average household size was 2.45 and the average family size was 2.97.
In the county, the population was spread out with 24.70% under the age of 18, 7.20% from 18 to 24, 27.00% from 25 to 44, 25.50% from 45 to 64, and 15.60% who were 65 years of age or older. The median age was 40 years. For every 100 females there were 95.00 males. For every 100 females age 18 and over, there were 92.40 males.
The median income for a household in the county was $42,746, and the median income for a family was $51,756. Males had a median income of $39,249 versus $23,697 for females. The per capita income for the county was $21,530. About 6.00% of families and 8.30% of the population were below the poverty line, including 11.60% of those under age 18 and 6.80% of those age 65 or over.
In 2008, the Census Bureau announced that the county's population had declined to an estimated 77,323 by July 1, 2007.[15]
2010 census
As of the 2010 United States Census, there were 77,079 people, 31,860 households, and 21,011 families residing in the county.[16] The population density was 306.4 inhabitants per square mile (118.3/km2). There were 37,845 housing units at an average density of 150.4 per square mile (58.1/km2).[17] The racial makeup of the county was 87.0% white, 8.6% black or African American, 0.6% Asian, 0.3% American Indian, 0.7% from other races, and 2.8% from two or more races. Those of Hispanic or Latino origin made up 3.4% of the population.[16] In terms of ancestry, 38.8% were German, 15.2% were Irish, 11.7% were English, 8.5% were Italian, and 4.6% were American.[18]
Of the 31,860 households, 29.1% had children under the age of 18 living with them, 48.5% were married couples living together, 12.9% had a female householder with no husband present, 34.1% were non-families, and 28.6% of all households were made up of individuals. The average household size was 2.37 and the average family size was 2.89. The median age was 43.4 years.[16]
The median income for a household in the county was $46,593 and the median income for a family was $61,247. Males had a median income of $46,211 versus $32,621 for females. The per capita income for the county was $25,290. About 8.5% of families and 12.5% of the population were below the poverty line, including 17.1% of those under age 18 and 8.5% of those age 65 or over.[19]
Government and politics
From 1992 to 2012, Erie County had been reliably Democratic. In 2016, however, Donald Trump won the county by a reasonably comfortable 9.5%.
| Year | Republican | Democratic | Third parties |
|---|---|---|---|
| 2016 | 51.9% 19,648 | 42.4% 16,057 | 5.7% 2,157 |
| 2012 | 42.9% 16,952 | 55.2% 21,793 | 1.9% 755 |
| 2008 | 42.1% 17,432 | 56.0% 23,148 | 1.9% 795 |
| 2004 | 46.4% 18,597 | 53.4% 21,421 | 0.2% 67 |
| 2000 | 46.0% 16,105 | 50.6% 17,732 | 3.4% 1,178 |
| 1996 | 36.5% 12,204 | 50.0% 16,730 | 13.5% 4,515 |
| 1992 | 34.8% 12,459 | 40.6% 14,531 | 24.7% 8,838 |
| 1988 | 51.8% 16,670 | 46.9% 15,097 | 1.3% 431 |
| 1984 | 57.8% 19,174 | 40.7% 13,508 | 1.4% 472 |
| 1980 | 51.3% 15,628 | 40.5% 12,343 | 8.2% 2,499 |
| 1976 | 50.0% 14,742 | 47.0% 13,843 | 3.0% 893 |
| 1972 | 58.5% 16,714 | 38.1% 10,889 | 3.5% 988 |
| 1968 | 48.5% 13,023 | 42.4% 11,388 | 9.1% 2,438 |
| 1964 | 38.5% 9,981 | 61.5% 15,968 | |
| 1960 | 57.9% 15,092 | 42.1% 10,954 | |
| 1956 | 70.2% 14,771 | 29.8% 6,276 | |
| 1952 | 65.4% 14,245 | 34.6% 7,549 | |
| 1948 | 52.3% 9,568 | 47.2% 8,644 | 0.5% 90 |
| 1944 | 57.9% 10,663 | 42.1% 7,753 | |
| 1940 | 54.9% 11,267 | 45.1% 9,254 | |
| 1936 | 36.7% 6,869 | 55.4% 10,376 | 7.9% 1,475 |
| 1932 | 40.7% 7,666 | 57.1% 10,765 | 2.2% 412 |
| 1928 | 57.7% 10,380 | 42.1% 7,570 | 0.3% 46 |
| 1924 | 54.3% 7,689 | 21.0% 2,968 | 24.7% 3,494 |
| 1920 | 62.4% 8,755 | 34.4% 4,831 | 3.2% 453 |
| 1916 | 43.1% 4,170 | 53.3% 5,152 | 3.6% 349 |
| 1912 | 30.2% 2,695 | 39.3% 3,504 | 30.5% 2,720 |
| 1908 | 50.1% 5,366 | 46.6% 4,983 | 3.3% 353 |
| 1904 | 58.7% 5,764 | 37.1% 3,648 | 4.2% 413 |
| 1900 | 52.1% 5,353 | 47.1% 4,837 | 0.8% 82 |
| 1896 | 53.2% 5,442 | 45.4% 4,641 | 1.5% 150 |
| 1892 | 47.3% 3,979 | 49.9% 4,195 | 2.9% 242 |
| 1888 | 45.5% 3,721 | 52.8% 4,322 | 1.7% 136 |
| 1884 | 45.5% 3,507 | 52.5% 4,044 | 2.0% 155 |
| 1880 | 51.5% 3,661 | 46.5% 3,305 | 2.0% 141 |
| 1876 | 49.4% 3,158 | 48.7% 3,112 | 1.9% 123 |
| 1872 | 55.8% 2,905 | 43.9% 2,287 | 0.4% 19 |
County officials
| Office | Name | Party |
|---|---|---|
| Commissioner | Bill Monaghan | Democrat |
| Commissioner | Matt Old | Republican |
| Commissioner | Patrick J. Shenigo | Democrat |
| Prosecutor | Kevin J. Baxter | Democrat |
| Sheriff | Paul A. Sigsworth | Democrat |
| Clerk of Courts | Luvada S. Wilson | Democrat |
| Recorder | Barbara A. Sessler | Democrat |
| Treasurer | Pamela S. Ferrell | Democrat |
| Engineer | John "Jack" D. Farschman | Democrat |
| Coroner | Brian A. Baxter | Republican |
| Auditor | Richard H. Jeffrey | Republican |
| Common Pleas Court Judge | Tygh M. Tone | Democrat |
| Common Pleas Court Judge | Roger E. Binette | Republican |
| Common Pleas Court Judge | Beverly K. McGookey | Democrat |
| Juvenile Court Judge | Robert C. DeLamatre | Republican |
Education
All or part of eleven school districts serve Erie County and its residents:
- Bellevue City School District: includes parts of Bellevue and Groton Township.
- Berlin-Milan Local School District: includes parts of Berlin Heights and Milan, and Berlin, Florence, Huron, Milan, Oxford, Perkins, and Vermilion Townships.
- Firelands Local School District: includes parts of Florence Township.
- Huron City School District: includes parts of Huron and Berlin, Huron, and Milan Townships.
- Kelleys Island Local School District: includes all of Kelleys Island.
- Margaretta Local School District: includes parts of Bay View and Castalia, and Groton and Margaretta Townships.
- Monroeville Local School District: includes parts of Oxford Township.
- Perkins Local School District: includes parts of Groton, Huron, Margaretta, Milan, Oxford, and Perkins Townships.
- Sandusky Central Catholic Schools: includes Sandusky's three Parishes (St. Mary, Ss. Peter & Paul, and Holy Angels).
- St. Peter's School: a private catholic elementary school in Huron
- Sandusky City School District: includes all of Sandusky.
- Vermilion Local School District: includes parts of Vermilion and Florence and Vermilion Townships.
- Western Reserve Local School District: including parts of Florence Township.
Communities
Cities
Villages
Townships
https://web.archive.org/web/20160715023447/http://www.ohiotownships.org/township-websites
Census-designated places
Unincorporated communities
- Avery
- Axtel
- Bay Bridge
- Berlinville
- Birmingham
- Bloomingville
- Bogart
- Ceylon
- Columbus Park
- Fairview Lanes
- Florence
- Heidelberg Beach
- Kimball
- Oberlin Beach
- Ogontz
- Orchard Beach
- Parkertown
- Prout
- Ruggles Beach
- Sand Hill
- Sandusky South
- Shinrock
- Springbrook
- Volunteer Bay
- Weyers
- Wilmer
Places of interest
See also
References
- ↑ "Ohio County Profiles: Erie County" (PDF). Ohio Department of Development. Archived from the original (PDF) on June 21, 2007. Retrieved April 28, 2007.
- 1 2 "State & County QuickFacts". United States Census Bureau. Archived from the original on July 10, 2011. Retrieved February 7, 2015.
- ↑ "Find a County". National Association of Counties. Archived from the original on May 31, 2011. Retrieved June 7, 2011.
- ↑ "Erie County data". Ohio State University Extension Data Center. Retrieved April 28, 2007.
- ↑ "Revised Delineations of Metropolitan Statistical Areas, Micropolitan Statistical Areas, and Combined Statistical Areas, and Guidance on Uses of the Delineations of These Areas" (PDF). Office Of Management and Budget. February 28, 2013. Retrieved February 8, 2015.
- ↑ Standard History of Erie County, Ohio; Peeke, 1916
- ↑ "2010 Census Gazetteer Files". United States Census Bureau. August 22, 2012. Archived from the original on May 4, 2014. Retrieved February 7, 2015.
- ↑

- ↑ "Population and Housing Unit Estimates". Retrieved June 9, 2017.
- ↑ "U.S. Decennial Census". United States Census Bureau. Archived from the original on May 12, 2015. Retrieved February 7, 2015.
- ↑ "Historical Census Browser". University of Virginia Library. Retrieved February 7, 2015.
- ↑ Forstall, Richard L., ed. (March 27, 1995). "Population of Counties by Decennial Census: 1900 to 1990". United States Census Bureau. Retrieved February 7, 2015.
- ↑ "Census 2000 PHC-T-4. Ranking Tables for Counties: 1990 and 2000" (PDF). United States Census Bureau. April 2, 2001. Retrieved February 7, 2015.
- ↑ "American FactFinder". United States Census Bureau. Archived from the original on September 11, 2013. Retrieved January 31, 2008.
- ↑ "Annual Estimates of the Population of Metropolitan and Micropolitan Statistical Areas: April 1, 2000 to July 1, 2007 (CBSA-EST2007-01)". 2007 Population Estimates. United States Census Bureau, Population Division. March 27, 2008. Archived from the original (CSV) on September 5, 2008. Retrieved February 7, 2009.
- 1 2 3 "DP-1 Profile of General Population and Housing Characteristics: 2010 Demographic Profile Data". United States Census Bureau. Retrieved December 27, 2015.
- ↑ "Population, Housing Units, Area, and Density: 2010 - County". United States Census Bureau. Retrieved December 27, 2015.
- ↑ "DP02 SELECTED SOCIAL CHARACTERISTICS IN THE UNITED STATES – 2006-2010 American Community Survey 5-Year Estimates". United States Census Bureau. Retrieved December 27, 2015.
- ↑ "DP03 SELECTED ECONOMIC CHARACTERISTICS – 2006-2010 American Community Survey 5-Year Estimates". United States Census Bureau. Retrieved December 27, 2015.
- ↑ Leip, David. "Dave Leip's Atlas of U.S. Presidential Elections". uselectionatlas.org. Retrieved 2018-05-01.
- ↑ Erie County Departments & Agencies
- ↑ Erie County Democratic Party elected officials
- ↑ Erie County Republican Party elected officials
Further reading
- William W. Williams, History of the Fire Lands, Comprising Huron and Erie Counties, Ohio: With Illustrations and Biographical Sketches of Some of the Prominent Men and Pioneers. Cleveland, OH: Press of Leader Printing Company, 1879.
External links
Places adjacent to Erie County, Ohio | ||||||||||
|---|---|---|---|---|---|---|---|---|---|---|
| ||||||||||
Municipalities and communities of Erie County, Ohio, United States | ||
|---|---|---|
| Cities | | |
| Villages | ||
| Townships | ||
| CDPs | ||
| Unincorporated communities | ||
| Footnotes | ‡This populated place also has portions in an adjacent county or counties | |