Mingo County, West Virginia
| Mingo County, West Virginia | |
|---|---|
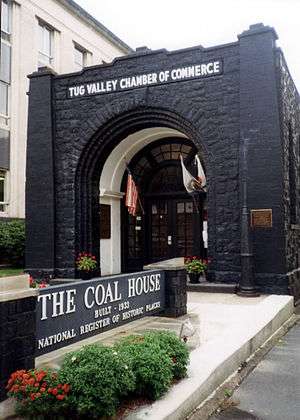 The Coal House museum in Williamson. | |
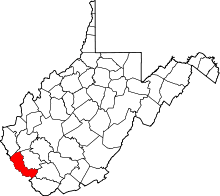 Location in the U.S. state of West Virginia | |
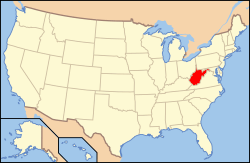 West Virginia's location in the U.S. | |
| Founded | January 30, 1895 |
| Named for | Mingo people |
| Seat | Williamson |
| Largest city | Williamson |
| Area | |
| • Total | 424 sq mi (1,098 km2) |
| • Land | 423 sq mi (1,096 km2) |
| • Water | 0.9 sq mi (2 km2), 0.2% |
| Population (est.) | |
| • (2017) | 24,127 |
| • Density | 61/sq mi (24/km2) |
| Congressional district | 3rd |
| Time zone | Eastern: UTC−5/−4 |
| Website |
www |
Mingo County is a county in the U.S. state of West Virginia. As of the 2010 census, the population was 26,839.[1] Its county seat is Williamson.[2] Created in 1895,[3] Mingo is West Virginia's newest county, named for the historic Iroquoian Mingo people.[4]
History
Mingo County is the newest county in the state, formed by an act of the state legislature in 1895 from parts of Logan County. The county was named for the Mingo Indians.[4]
The attempt to unionize coal miners in the county in the 1920s led to the Battle of Blair Mountain in neighboring Logan County.
Politically, Mingo County is well known for its opposition to former President Barack Obama. In 2008, Obama netted only 8% of the vote in the Democratic primary, one of his worst performances. In 2012, Mingo County Democrats voted for Keith Russell Judd, a convicted felon who was the only other candidate on the ballot, over Obama.[5]
In 2014, Mingo County native Jeremy T. K. Farley published The Ghosts of Mingo County, based on the real life story of Timmy Barker, a history of what he described as "the bloodiest county in America." The book met with mixed reviews; some residents stated that publication portrayed the county as being too lawless, while others believed the book told the county's history accurately.[6]
In 2016, Mingo County was "one of the places in America most touched by opioids."[7]
Geography
According to the U.S. Census Bureau, the county has a total area of 424 square miles (1,100 km2), of which 423 square miles (1,100 km2) is land and 0.9 square miles (2.3 km2) (0.2%) is water.[8]
Major highways
Adjacent counties
- Lincoln County (north)
- Logan County (northeast)
- Wyoming County (east)
- McDowell County (southeast)
- Pike County, Kentucky (west)
- Martin County, Kentucky (west)
- Wayne County (northwest)
- Buchanan County, Virginia (southeast)
Demographics
| Historical population | |||
|---|---|---|---|
| Census | Pop. | %± | |
| 1900 | 11,359 | — | |
| 1910 | 19,431 | 71.1% | |
| 1920 | 26,384 | 35.8% | |
| 1930 | 38,319 | 45.2% | |
| 1940 | 40,802 | 6.5% | |
| 1950 | 47,409 | 16.2% | |
| 1960 | 39,742 | −16.2% | |
| 1970 | 32,780 | −17.5% | |
| 1980 | 37,336 | 13.9% | |
| 1990 | 33,739 | −9.6% | |
| 2000 | 28,253 | −16.3% | |
| 2010 | 26,839 | −5.0% | |
| Est. 2017 | 24,127 | [9] | −10.1% |
| U.S. Decennial Census[10] 1790–1960[11] 1900–1990[12] 1990–2000[13] 2010–2015[1] | |||
2000 census
As of the census[14] of 2000, there were 28,253 people, 11,303 households, and 8,217 families residing in the county. The population density was 67 people per square mile (26/km²). There were 12,898 housing units at an average density of 30 per square mile (12/km²). The racial makeup of the county was 96.39% White, 2.34% Black or African American, 0.24% Native American, 0.21% Asian, 0.02% Pacific Islander, 0.06% from other races, and 0.74% from two or more races. 0.48% of the population were Hispanic or Latino of any race.
There were 11,303 households out of which 33.50% had children under the age of 18 living with them, 56.20% were married couples living together, 12.70% had a female householder with no husband present, and 27.30% were non-families. 25.20% of all households were made up of individuals and 10.40% had someone living alone who was 65 years of age or older. The average household size was 2.49 and the average family size was 2.98.
In the county, the population was spread out with 24.20% under the age of 18, 9.20% from 18 to 24, 29.10% from 25 to 44, 25.00% from 45 to 64, and 12.40% who were 65 years of age or older. The median age was 37 years. For every 100 females there were 93.70 males. For every 100 females age 18 and over, there were 90.20 males.
The median income for a household in the county was $21,347, and the median income for a family was $26,581. Males had a median income of $31,660 versus $18,038 for females. The per capita income for the county was $12,445. About 25.90% of families and 29.70% of the population were below the poverty line, including 38.90% of those under age 18 and 18.60% of those age 65 or over.
2010 census
As of the 2010 United States Census, there were 26,839 people, 11,125 households, and 7,707 families residing in the county.[15] The population density was 63.4 inhabitants per square mile (24.5/km2). There were 12,699 housing units at an average density of 30.0 per square mile (11.6/km2).[16] The racial makeup of the county was 97.1% white, 1.8% black or African American, 0.2% Asian, 0.1% American Indian, 0.0% from other races, and 0.9% from two or more races. Those of Hispanic or Latino origin made up 0.4% of the population.[15] In terms of ancestry, 12.6% were Irish, 11.9% were American, 7.0% were German, and 6.9% were English.[17]
Of the 11,125 households, 30.8% had children under the age of 18 living with them, 52.6% were married couples living together, 11.8% had a female householder with no husband present, 30.7% were non-families, and 27.7% of all households were made up of individuals. The average household size was 2.40 and the average family size was 2.91. The median age was 40.9 years.[15]
The median income for a household in the county was $32,902 and the median income for a family was $40,199. Males had a median income of $46,917 versus $27,168 for females. The per capita income for the county was $17,629. About 16.9% of families and 21.6% of the population were below the poverty line, including 30.1% of those under age 18 and 10.8% of those age 65 or over.[18]
Politics
The youngest of West Virginia’s 55 counties, Mingo was created entirely from powerfully secessionist Logan County.[19] Consequently, for the 110 years following its creation, Mingo County was powerfully Democratic, voting for Walter Mondale – who came within 3,819 votes of losing all 50 states – by a two-to-one margin in 1984, and voting Republican only for William Howard Taft in 1908, Herbert Hoover in 1928 due to powerful anti-Catholic sentiment against Al Smith, and Richard Nixon against the left-wing George McGovern in 1972. Like all of West Virginia, since 2000 a combination of declining unionization[20] and differences with the Democratic Party’s liberal views on social issues[21] has produced a dramatic swing to the Republican Party. In 2016, this historically heavily Democratic county voted only eight percentage points less Republican than historically Unionist and rock-ribbed GOP Grant County.
| Year | Republican | Democratic | Third parties |
|---|---|---|---|
| 2016 | 83.2% 7,911 | 14.4% 1,370 | 2.4% 231 |
| 2012 | 69.9% 6,191 | 27.4% 2,428 | 2.7% 236 |
| 2008 | 55.0% 4,587 | 43.0% 3,582 | 2.0% 169 |
| 2004 | 43.3% 4,612 | 56.2% 5,983 | 0.6% 60 |
| 2000 | 38.5% 3,866 | 60.2% 6,049 | 1.3% 128 |
| 1996 | 20.5% 2,229 | 69.7% 7,584 | 9.8% 1,062 |
| 1992 | 23.8% 2,584 | 67.5% 7,342 | 8.7% 947 |
| 1988 | 28.0% 2,896 | 71.8% 7,429 | 0.2% 25 |
| 1984 | 33.6% 4,275 | 66.3% 8,434 | 0.1% 17 |
| 1980 | 28.0% 3,716 | 70.2% 9,328 | 1.8% 236 |
| 1976 | 25.8% 3,010 | 74.2% 8,655 | |
| 1972 | 57.3% 7,484 | 42.7% 5,585 | |
| 1968 | 28.9% 3,988 | 62.9% 8,677 | 8.2% 1,133 |
| 1964 | 20.5% 3,154 | 79.6% 12,266 | |
| 1960 | 30.3% 4,903 | 69.7% 11,259 | |
| 1956 | 44.2% 7,916 | 55.9% 10,014 | |
| 1952 | 34.8% 6,852 | 65.2% 12,856 | |
| 1948 | 32.0% 4,896 | 67.8% 10,362 | 0.2% 34 |
| 1944 | 33.0% 4,711 | 67.0% 9,550 | |
| 1940 | 33.2% 5,776 | 66.8% 11,619 | |
| 1936 | 33.8% 5,771 | 66.1% 11,278 | 0.1% 15 |
| 1932 | 47.3% 7,801 | 52.5% 8,657 | 0.3% 43 |
| 1928 | 50.3% 6,904 | 49.5% 6,801 | 0.2% 27 |
| 1924 | 42.1% 4,656 | 48.0% 5,313 | 10.0% 1,101 |
| 1920 | 44.6% 3,972 | 55.4% 4,934 | |
| 1916 | 47.3% 2,223 | 52.5% 2,472 | 0.2% 10 |
| 1912 | 36.0% 1,569 | 42.1% 1,832 | 21.9% 956 |
Communities
City
- Williamson (county seat)
Towns
Census-designated places
Unincorporated communities
Magisterial Districts
- Beech Ben Mate District
- Kermit Harvey District
- Lee District
- Magnolia District
- Stafford District
- Tug Hardee District
- Williamson District
Historical Magisterial Districts
- Hardee Magisterial District
- Harvey Magisterial District
- Kermit Magisterial District
- Tug River Magisterial District
Notable people
- Don Blankenship, former president and CEO of Massey Energy, 2018 Senate candidate, convicted criminal
- H. Truman Chafin, former and longest-serving state senator
- Doc Edwards, former Major League Baseball catcher and manager
- Robert H. "Doc" Foglesong, four-star general in the United States Air Force, president of Mississippi State University from 2006 to 2008
- James H. "Buck" Harless, timber and coal operator, former president and CEO of International Industries
- Sid Hatfield, Matewan chief of police and hero of the Battle of Matewan, murdered by Baldwin-Felts "detectives"
- Anse Hatfield, patriarch of Hatfield family involved in Hatfield–McCoy feud
See also
References
- 1 2 "State & County QuickFacts". United States Census Bureau. Archived from the original on July 14, 2011. Retrieved January 10, 2014.
- ↑ "Find a County". National Association of Counties. Retrieved 2011-06-07.
- ↑ "Archived copy". Archived from the original on 2015-02-05. Retrieved 2015-10-06.
- 1 2 "West Virginia Counties". West Virginia Division of Culture and History. Archived from the original on September 23, 2001. Retrieved February 24, 2014. (WV County Etymology)
- ↑ Mathesian, Charles. How the felon won. The Politico. Retrieved May 9, 2012.
- ↑ Wytheville Enterprise Wythe County official pens history of coalfields struggle.
- ↑ Snyder, Timothy (2018). The Road to Unfreedom: Russia, Europe, America. London, U.K.: The Bodley Head. p. 266. ISBN 978-1-847-92526-8.
Mingo County, West Virginia, was one of the places in America most touched by opioids. A town in Mingo County with a population of 3,200 was shipped about two million opioid pills per year.
- ↑ "2010 Census Gazetteer Files". United States Census Bureau. August 22, 2012. Retrieved July 30, 2015.
- ↑ "Population and Housing Unit Estimates". Retrieved Apr 7, 2018.
- ↑ "U.S. Decennial Census". United States Census Bureau. Retrieved January 10, 2014.
- ↑ "Historical Census Browser". University of Virginia Library. Retrieved January 10, 2014.
- ↑ "Population of Counties by Decennial Census: 1900 to 1990". United States Census Bureau. Retrieved January 10, 2014.
- ↑ "Census 2000 PHC-T-4. Ranking Tables for Counties: 1990 and 2000" (PDF). United States Census Bureau. Retrieved January 10, 2014.
- ↑ "American FactFinder". United States Census Bureau. Retrieved 2011-05-14.
- 1 2 3 "DP-1 Profile of General Population and Housing Characteristics: 2010 Demographic Profile Data". United States Census Bureau. Retrieved 2016-04-03.
- ↑ "Population, Housing Units, Area, and Density: 2010 - County". United States Census Bureau. Retrieved 2016-04-03.
- ↑ "DP02 SELECTED SOCIAL CHARACTERISTICS IN THE UNITED STATES – 2006-2010 American Community Survey 5-Year Estimates". United States Census Bureau. Retrieved 2016-04-03.
- ↑ "DP03 SELECTED ECONOMIC CHARACTERISTICS – 2006-2010 American Community Survey 5-Year Estimates". United States Census Bureau. Retrieved 2016-04-03.
- ↑ Hinkle, Harlan H.; Grayback Mountaineers: The Confederate Face of Western Virginia, pp. 189-190, 194 ISBN 0595268404
- ↑ Schwartzman, Gabe; ‘How Central Appalachia Went Right’; Daily Yonder, January 13, 2015
- ↑ Cohn, Nate; ‘Demographic Shift: Southern Whites’ Loyalty to G.O.P. Nearing That of Blacks to Democrats’, New York Times, April 24, 2014
- ↑ Leip, David. "Dave Leip's Atlas of U.S. Presidential Elections". uselectionatlas.org. Retrieved 2018-03-28.
External links
- Mingo County official website
- Mingo County Board of Education
- Mingo County History
- East Fork VFD at Dingess, WV
- West Virginia Mine Wars Museum independent history museum covering the Mine Wars Era in Matewan, WV.
Places adjacent to Mingo County, West Virginia | ||||||||||
|---|---|---|---|---|---|---|---|---|---|---|
| ||||||||||
Municipalities and communities of Mingo County, West Virginia, United States | ||
|---|---|---|
| City | | |
| Towns | ||
| CDPs | ||
| Other communities |
| |
| Footnotes | ‡This populated place also has portions in an adjacent county or counties | |