Braxton County, West Virginia
| Braxton County, West Virginia | |
|---|---|
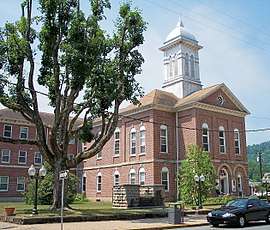 The Braxton County Courthouse in Sutton West Virginia in 2007 | |
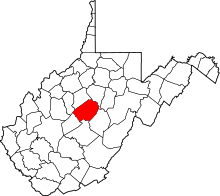 Location in the U.S. state of West Virginia | |
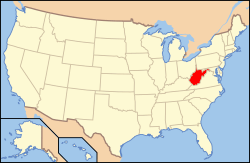 West Virginia's location in the U.S. | |
| Founded | January 15, 1836 |
| Named for | Carter Braxton |
| Seat | Sutton |
| Largest town | Sutton |
| Area | |
| • Total | 516 sq mi (1,336 km2) |
| • Land | 511 sq mi (1,323 km2) |
| • Water | 5.5 sq mi (14 km2), 1.1% |
| Population (est.) | |
| • (2015) | 14,415 |
| • Density | 28/sq mi (11/km2) |
| Congressional district | 2nd |
| Time zone | Eastern: UTC−5/−4 |
| Website | |
Braxton County is a county in the central part of the U.S. state of West Virginia. As of the 2010 census, the population was 14,523.[1] The county seat is Sutton.[2] The county was formed in 1836[3] from parts of Lewis, Kanawha, and Nicholas counties and named for Carter Braxton, a Virginia statesman and signer of the Declaration of Independence.
In 2010, the center of population of West Virginia was in northern Braxton County.[4]
Important salt works were located at Bulltown and here, in 1772, Captain Bull and his family and friendly indigenous Americans, also known as Delaware Indians, were massacred by descendants of European immigrants or frontiersmen.[5] Jesse Hughes helped Jeremiah Carpenter and track and kill the indigenous Americans responsible for the Carpenter massacre. Jeremiah was a notable fiddle player who wrote a song, Shelvin’ Rock, about the experience of escaping to rock shelter.
Geography
According to the U.S. Census Bureau, the county has a total area of 516 square miles (1,340 km2), of which 511 square miles (1,320 km2) is land and 5.5 square miles (14 km2) (1.1%) is water.[6]
Major highways
Adjacent counties
- Lewis County (northeast)
- Webster County (southeast)
- Nicholas County (south)
- Clay County (southwest)
- Calhoun County (west)
- Gilmer County (northwest)
Demographics
| Historical population | |||
|---|---|---|---|
| Census | Pop. | %± | |
| 1840 | 2,575 | — | |
| 1850 | 4,212 | 63.6% | |
| 1860 | 4,992 | 18.5% | |
| 1870 | 6,480 | 29.8% | |
| 1880 | 9,787 | 51.0% | |
| 1890 | 13,928 | 42.3% | |
| 1900 | 18,904 | 35.7% | |
| 1910 | 23,023 | 21.8% | |
| 1920 | 23,973 | 4.1% | |
| 1930 | 22,579 | −5.8% | |
| 1940 | 21,658 | −4.1% | |
| 1950 | 18,082 | −16.5% | |
| 1960 | 15,152 | −16.2% | |
| 1970 | 12,666 | −16.4% | |
| 1980 | 13,894 | 9.7% | |
| 1990 | 12,998 | −6.4% | |
| 2000 | 14,702 | 13.1% | |
| 2010 | 14,523 | −1.2% | |
| Est. 2016 | 14,471 | [7] | −0.4% |
| U.S. Decennial Census[8] 1790–1960[9] 1900–1990[10] 1990–2000[11] 2010–2015[1] | |||
2000 census
As of the census[12] of 2000, there were 14,702 people, 5,771 households, and 4,097 families residing in the county. The population density was 29 people per square mile (11/km²). There were 7,374 housing units at an average density of 14 per square mile (6/km²). The racial makeup of the county was 98.02% White, 0.69% Black or African American, 0.35% Native American, 0.11% Asian, 0.05% Pacific Islander, 0.08% from other races, and 0.71% from two or more races. 0.44% of the population were Hispanic or Latino of any race.
There were 5,771 households out of which 30.30% had children under the age of 18 living with them, 57.30% were married couples living together, 9.20% had a female householder with no husband present, and 29.00% were non-families. 25.20% of all households were made up of individuals and 12.40% had someone living alone who was 65 years of age or older. The average household size was 2.46 and the average family size was 2.92.
In the county, the population was spread out with 22.80% under the age of 18, 7.50% from 18 to 24, 28.10% from 25 to 44, 25.80% from 45 to 64, and 15.80% who were 65 years of age or older. The median age was 40 years. For every 100 females there were 102.60 males. For every 100 females age 18 and over, there were 103.00 males.
The median income for a household in the county was $24,412, and the median income for a family was $29,133. Males had a median income of $27,560 versus $17,778 for females. The per capita income for the county was $13,349. About 17.90% of families and 22.00% of the population were below the poverty line, including 27.90% of those under age 18 and 13.70% of those age 65 or over.
2010 census
As of the 2010 United States Census, there were 14,523 people, 6,000 households, and 4,043 families residing in the county.[13] The population density was 28.4 inhabitants per square mile (11.0/km2). There were 7,415 housing units at an average density of 14.5 per square mile (5.6/km2).[14] The racial makeup of the county was 98.2% white, 0.4% black or African American, 0.3% American Indian, 0.2% Asian, 0.0% from other races, and 0.9% from two or more races. Those of Hispanic or Latino origin made up 0.5% of the population.[13] In terms of ancestry, 19.7% were German, 15.0% were Irish, 11.7% were English, and 8.0% were American.[15]
Of the 6,000 households, 28.0% had children under the age of 18 living with them, 52.8% were married couples living together, 9.5% had a female householder with no husband present, 32.6% were non-families, and 27.9% of all households were made up of individuals. The average household size was 2.36 and the average family size was 2.86. The median age was 43.8 years.[13]
The median income for a household in the county was $32,158 and the median income for a family was $40,421. Males had a median income of $42,355 versus $22,557 for females. The per capita income for the county was $17,469. About 17.0% of families and 21.0% of the population were below the poverty line, including 30.4% of those under age 18 and 13.0% of those age 65 or over.[16]
Politics
Braxton County, although initially opposed to secession during the first session of the Virginia Secession Convention, later became supportive. Consequently, up until the decline of coal mining unionization,[17] and growing opposition to socially controversial issues,[18] Braxton County was overwhelmingly Democratic. Like all of West Virginia, it has seen an extremely rapid shift to the Republicans over the past five elections.
| Year | Republican | Democratic | Third parties |
|---|---|---|---|
| 2016 | 69.4% 3,537 | 25.9% 1,321 | 4.8% 242 |
| 2012 | 56.7% 2,725 | 41.5% 1,998 | 1.8% 87 |
| 2008 | 48.6% 2,629 | 49.9% 2,704 | 1.5% 82 |
| 2004 | 49.4% 2,986 | 50.2% 3,035 | 0.5% 30 |
| 2000 | 47.5% 2,529 | 51.0% 2,719 | 1.5% 80 |
| 1996 | 28.8% 1,441 | 60.1% 3,001 | 11.1% 554 |
| 1992 | 26.6% 1,535 | 58.9% 3,396 | 14.5% 834 |
| 1988 | 37.3% 2,024 | 62.3% 3,377 | 0.4% 22 |
| 1984 | 46.3% 2,902 | 53.5% 3,350 | 0.2% 13 |
| 1980 | 37.5% 2,403 | 59.2% 3,795 | 3.3% 210 |
| 1976 | 32.3% 1,913 | 67.7% 4,012 | |
| 1972 | 53.2% 3,155 | 46.8% 2,771 | |
| 1968 | 40.4% 2,441 | 54.0% 3,268 | 5.6% 341 |
| 1964 | 28.1% 1,867 | 71.9% 4,787 | |
| 1960 | 41.6% 2,977 | 58.4% 4,185 | |
| 1956 | 46.8% 3,441 | 53.2% 3,913 | |
| 1952 | 44.3% 3,382 | 55.7% 4,259 | |
| 1948 | 40.0% 2,864 | 59.9% 4,287 | 0.1% 7 |
| 1944 | 41.2% 3,023 | 58.8% 4,313 | |
| 1940 | 41.5% 4,056 | 58.5% 5,709 | |
| 1936 | 39.5% 3,709 | 60.3% 5,667 | 0.2% 16 |
| 1932 | 36.9% 3,560 | 62.6% 6,043 | 0.6% 58 |
| 1928 | 46.6% 4,028 | 53.0% 4,582 | 0.5% 41 |
| 1924 | 44.2% 4,192 | 54.5% 5,168 | 1.4% 130 |
| 1920 | 49.9% 4,274 | 49.9% 4,269 | 0.2% 20 |
| 1916 | 44.0% 2,332 | 55.8% 2,957 | 0.2% 9 |
| 1912 | 11.5% 580 | 51.7% 2,611 | 36.8% 1,855 |
Communities
Towns
- Burnsville
- Flatwoods
- Gassaway
- Sutton (county seat)
Unincorporated communities
See also
References
- 1 2 "State & County QuickFacts". United States Census Bureau. Retrieved January 9, 2014.
- ↑ "Find a County". National Association of Counties. Archived from the original on 2011-05-31. Retrieved 2011-06-07.
- ↑ "Archived copy". Archived from the original on 2001-09-23. Retrieved 2013-07-23.
- ↑ "Centers of Population by State: 2010". United States Census Bureau. Archived from the original on January 3, 2014. Retrieved May 11, 2014.
- ↑ The Border Settlers of Northwestern Virginia from 1768 to 1795 1915 The Republican Puublishing Company Hamilton, OH
- ↑ "2010 Census Gazetteer Files". United States Census Bureau. August 22, 2012. Retrieved July 23, 2015.
- ↑ "Population and Housing Unit Estimates". Retrieved June 9, 2017.
- ↑ "U.S. Decennial Census". United States Census Bureau. Archived from the original on May 12, 2015. Retrieved January 9, 2014.
- ↑ "Historical Census Browser". University of Virginia Library. Retrieved January 9, 2014.
- ↑ "Population of Counties by Decennial Census: 1900 to 1990". United States Census Bureau. Retrieved January 9, 2014.
- ↑ "Census 2000 PHC-T-4. Ranking Tables for Counties: 1990 and 2000" (PDF). United States Census Bureau. Retrieved January 9, 2014.
- ↑ "American FactFinder". United States Census Bureau. Archived from the original on 2013-09-11. Retrieved 2011-05-14.
- 1 2 3 "DP-1 Profile of General Population and Housing Characteristics: 2010 Demographic Profile Data". United States Census Bureau. Retrieved 2016-04-03.
- ↑ "Population, Housing Units, Area, and Density: 2010 – County". United States Census Bureau. Retrieved 2016-04-03.
- ↑ "DP02 SELECTED SOCIAL CHARACTERISTICS IN THE UNITED STATES – 2006–2010 American Community Survey 5-Year Estimates". United States Census Bureau. Retrieved 2016-04-03.
- ↑ "DP03 SELECTED ECONOMIC CHARACTERISTICS – 2006–2010 American Community Survey 5-Year Estimates". United States Census Bureau. Retrieved 2016-04-03.
- ↑ Schwartzman, Gabe; ‘How Central Appalachia Went Right’; Daily Yonder, January 13, 2015
- ↑ Cohn, Nate; ‘Demographic Shift: Southern Whites’ Loyalty to G.O.P. Nearing That of Blacks to Democrats’, The New York Times, April 24, 2014
- ↑ Leip, David. "Dave Leip's Atlas of U.S. Presidential Elections". uselectionatlas.org. Retrieved 2018-03-27.
Places adjacent to Braxton County, West Virginia | ||||||||||
|---|---|---|---|---|---|---|---|---|---|---|
| ||||||||||
Municipalities and communities of Braxton County, West Virginia, United States | ||
|---|---|---|
| Towns | | |
| Unincorporated communities |
| |
| Ghost towns | ||
| Footnotes | ‡This populated place also has portions in an adjacent county or counties | |