Carroll County, Ohio
| Carroll County, Ohio | ||
|---|---|---|
 | ||
| ||
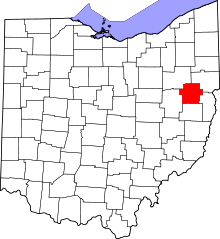 Location in the U.S. state of Ohio | ||
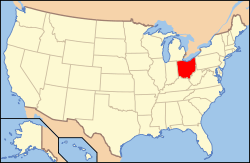 Ohio's location in the U.S. | ||
| Founded | January 1, 1833 | |
| Named for | Charles Carroll of Carrollton | |
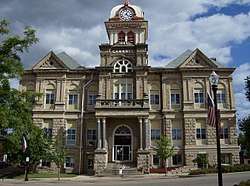
| Seat | Carrollton | |
| Largest village | Carrollton* | |
| Area | ||
| • Total | 399 sq mi (1,033 km2) | |
| • Land | 395 sq mi (1,023 km2) | |
| • Water | 4.3 sq mi (11 km2), 1.1% | |
| Population | ||
| • (2010) | 28,836 | |
| • Density | 73/sq mi (28/km2) | |
| Congressional district | 6th | |
| Time zone | Eastern: UTC−5/−4 | |
| Website |
www | |
|
Footnotes: *Based on population just within the county.[1] | ||

Carroll County is a county located in the state of Ohio. As of the 2010 census, the population was 28,836.[2] Its county seat is Carrollton.[3] It is named for Charles Carroll of Carrollton, the last surviving signer of the Declaration of Independence.[4][5]
Carroll County is part of the Canton-Massillon, OH Metropolitan Statistical Area, which is also included in the Cleveland-Akron-Canton, OH Combined Statistical Area. It is in the Appalachian Ohio region.[6]
History
Carroll County was formed on December 25, 1832 from portions of Columbiana, Harrison, Jefferson, Stark, and Tuscarawas counties.[7]
Carroll County lies upon an ancient trail known as the Great Trail,[8][9] connecting the forks of the Ohio with Lake Erie and the inland plains.
Geography
According to the U.S. Census Bureau, the county has a total area of 399 square miles (1,030 km2), of which 395 square miles (1,020 km2) is land and 4.3 square miles (11 km2) (1.1%) is water.[10] It is the fifth smallest county in Ohio in land area and smallest in total area.
Adjacent counties
- Columbiana County (northeast)
- Jefferson County (southeast)
- Harrison County (south)
- Tuscarawas County (southwest)
- Stark County (northwest)
Major Highways
Demographics
| Historical population | |||
|---|---|---|---|
| Census | Pop. | %± | |
| 1840 | 18,108 | — | |
| 1850 | 17,685 | −2.3% | |
| 1860 | 15,738 | −11.0% | |
| 1870 | 14,491 | −7.9% | |
| 1880 | 16,416 | 13.3% | |
| 1890 | 17,566 | 7.0% | |
| 1900 | 16,811 | −4.3% | |
| 1910 | 15,761 | −6.2% | |
| 1920 | 15,942 | 1.1% | |
| 1930 | 16,057 | 0.7% | |
| 1940 | 17,449 | 8.7% | |
| 1950 | 19,039 | 9.1% | |
| 1960 | 20,857 | 9.5% | |
| 1970 | 21,579 | 3.5% | |
| 1980 | 25,598 | 18.6% | |
| 1990 | 26,521 | 3.6% | |
| 2000 | 28,836 | 8.7% | |
| 2010 | 28,836 | 0.0% | |
| Est. 2017 | 27,385 | [11] | −5.0% |
| U.S. Decennial Census[12] 1790-1960[13] 1900-1990[14] 1990-2000[15] 2010-2017[2] | |||
2000 census
As of the census[16] of 2000, there were 28,836 people, 11,126 households, and 8,155 families residing in the county. The population density was 73 people per square mile (28/km²). There were 13,016 housing units at an average density of 33 per square mile (13/km²). The racial makeup of the county was 98.20% White, 0.54% Black or African American, 0.32% Native American, 0.11% Asian, 0.02% Pacific Islander, 0.09% from other races, and 0.71% from two or more races. 0.55% of the population were Hispanic or Latino of any race. 30.1% were of German, 13.5% American, 13.3% Irish, 9.8% English, and 6.6% Italian ancestry according to Census 2000.
There were 11,126 households out of which 31.90% had children under the age of 18 living with them, 61.90% were married couples living together, 7.70% had a female householder with no husband present, and 26.70% were non-families. 22.90% of all households were made up of individuals and 10.40% had someone living alone who was 65 years of age or older. The average household size was 2.56 and the average family size was 3.00.
In the county, the population was spread out with 25.10% under the age of 18, 7.50% from 18 to 24, 27.50% from 25 to 44, 25.70% from 45 to 64, and 14.20% who were 65 years of age or older. The median age was 39 years. For every 100 females there were 98.00 males. For every 100 females age 18 and over, there were 95.40 males.
The median income for a household in the county was $35,509, and the median income for a family was $41,114. Males had a median income of $31,611 versus $21,285 for females. The per capita income for the county was $16,701. About 8.50% of families and 11.40% of the population were below the poverty line, including 17.20% of those under age 18 and 11.10% of those age 65 or over.
2010 census
As of the 2010 United States Census, there were 28,836 people, 11,385 households, and 8,067 families residing in the county.[17] The population density was 73.1 inhabitants per square mile (28.2/km2). There were 13,698 housing units at an average density of 34.7 per square mile (13.4/km2).[18] The racial makeup of the county was 97.8% white, 0.5% black or African American, 0.3% American Indian, 0.2% Asian, 0.2% from other races, and 1.1% from two or more races. Those of Hispanic or Latino origin made up 0.8% of the population.[17] In terms of ancestry, 29.2% were German, 14.4% were Irish, 11.3% were American, 9.8% were English, and 6.1% were Italian.[19]
Of the 11,385 households, 29.8% had children under the age of 18 living with them, 57.4% were married couples living together, 8.8% had a female householder with no husband present, 29.1% were non-families, and 24.3% of all households were made up of individuals. The average household size was 2.50 and the average family size was 2.95. The median age was 43.1 years.[17]
The median income for a household in the county was $43,148 and the median income for a family was $51,700. Males had a median income of $42,481 versus $26,587 for females. The per capita income for the county was $21,575. About 9.0% of families and 12.6% of the population were below the poverty line, including 18.7% of those under age 18 and 7.1% of those age 65 or over.[20]
Politics
| Year | Republican | Democratic | Third parties |
|---|---|---|---|
| 2016 | 70.4% 9,254 | 24.0% 3,154 | 5.6% 740 |
| 2012 | 55.1% 7,315 | 41.7% 5,543 | 3.2% 426 |
| 2008 | 50.8% 7,097 | 45.9% 6,423 | 3.3% 465 |
| 2004 | 54.5% 7,695 | 44.6% 6,300 | 0.8% 117 |
| 2000 | 54.9% 6,732 | 40.5% 4,960 | 4.6% 569 |
| 1996 | 37.7% 4,449 | 40.6% 4,792 | 21.6% 2,549 |
| 1992 | 33.9% 4,224 | 38.0% 4,731 | 28.1% 3,508 |
| 1988 | 56.2% 6,179 | 42.5% 4,667 | 1.4% 148 |
| 1984 | 63.3% 6,703 | 35.6% 3,771 | 1.0% 110 |
| 1980 | 58.9% 5,806 | 35.3% 3,476 | 5.8% 569 |
| 1976 | 49.3% 5,091 | 48.5% 5,006 | 2.2% 228 |
| 1972 | 66.4% 5,984 | 30.6% 2,755 | 3.1% 275 |
| 1968 | 52.4% 4,634 | 35.3% 3,119 | 12.4% 1,093 |
| 1964 | 42.0% 3,655 | 58.0% 5,050 | |
| 1960 | 63.6% 6,095 | 36.4% 3,488 | |
| 1956 | 69.6% 5,916 | 30.5% 2,590 | |
| 1952 | 64.6% 5,707 | 35.5% 3,134 | |
| 1948 | 58.6% 4,283 | 41.0% 2,996 | 0.5% 34 |
| 1944 | 62.8% 4,898 | 37.3% 2,907 | |
| 1940 | 59.0% 5,160 | 41.0% 3,589 | |
| 1936 | 53.3% 4,440 | 45.6% 3,801 | 1.2% 96 |
| 1932 | 59.8% 4,487 | 37.3% 2,802 | 2.9% 221 |
| 1928 | 80.3% 5,572 | 19.0% 1,321 | 0.6% 44 |
| 1924 | 70.8% 4,369 | 23.2% 1,430 | 6.1% 374 |
| 1920 | 70.2% 4,392 | 28.0% 1,755 | 1.8% 111 |
| 1916 | 53.7% 2,086 | 43.0% 1,672 | 3.3% 127 |
| 1912 | 29.5% 1,096 | 34.7% 1,293 | 35.8% 1,333[22] |
| 1908 | 59.4% 2,517 | 37.5% 1,590 | 3.1% 129 |
| 1904 | 65.1% 2,695 | 30.9% 1,278 | 4.1% 170 |
| 1900 | 59.6% 2,668 | 38.4% 1,720 | 1.9% 86 |
| 1896 | 57.1% 2,668 | 41.8% 1,955 | 1.1% 52 |
| 1892 | 54.0% 2,261 | 40.0% 1,677 | 6.0% 251 |
| 1888 | 55.8% 2,405 | 40.5% 1,746 | 3.7% 158 |
| 1884 | 55.9% 2,314 | 40.2% 1,665 | 3.9% 162 |
| 1880 | 58.0% 2,241 | 40.6% 1,569 | 1.4% 54 |
| 1876 | 56.9% 2,060 | 43.0% 1,554 | 0.1% 4 |
| 1872 | 58.6% 1,817 | 41.4% 1,283 |
Government
Office holders
With date of end of term[23][24]
- Clerk of Courts William R. Wohlwend December 31, 2020
- Commissioner Jeffrey L Ohler December 31, 2018,
- Commissioner Robert E Wirkner January 1, 2021,
- Commissioner Lewis A Mickley January 2, 2021
- Coroner Mandel B. Haas December 31, 2020
- Engineer Brian J. Wise December 31, 2020
- Prosecutor Steven D Barnett December 31, 2020
- Recorder Patricia J. Oyer December 31, 2020
- Sheriff Dale R. Williams December 31, 2020
- Treasurer Jeff Yeager September 5, 2021
- Auditor Lynn A Fairclough March 11, 2019
- Municipal Court Judge Gary L. Willen December 31, 2021
- Common Pleas Judge General Division Dominick E. Olivito Jr December 31, 2018
- Common Pleas Judge Probate Division John S. Campbell February 8, 2021
Economy
Latest USDA data, (2007), show Carroll County led the state in nursery stock production, and was number ten among counties in the United States.[25]
Carroll County leads the state in number of Utica Shale Oil Wells permitted or drilled.[26]
Listed as the most polluted county in Ohio. .[27]
Culture
The Great Trail Festival, a festival of old fashioned music, arts and crafts, is held near the village of Malvern each year at the end of August and the beginning of September. A celebration of Ohio's colonial history, the event focuses particularly on the region's Native American and French heritage, complete with a small herd of buffalo and battle reenactment.
The Algonquin Mill Fest is another local festival. Held 4 miles south of Carrollton on SR 332 at the Algonquin Mill - a pioneer village with one room schoolhouse, steam-powered saw and flour mills, as well as several other historic buildings. Hand made arts and crafts are sold, along with flour milled during the festival, a pancake breakfast and chicken barbecue dinners.
Flight Fest in Malvern Ohio. This is remote control Airplane competition.
Education
Public school districts
High schools
Communities

Villages
- Carrollton (county seat)
- Dellroy
- Leesville
- Magnolia
- Malvern
- Minerva
- Sherrodsville
Townships
https://web.archive.org/web/20160715023447/http://www.ohiotownships.org/township-websites
Census-designated place
Unincorporated communities
See also
References
- ↑ "Carroll County data (population)". Ohio State University Extension Data Center. Retrieved May 10, 2007.
- 1 2 "State & County QuickFacts". United States Census Bureau. Retrieved February 7, 2015.
- ↑ "Find a County". National Association of Counties. Archived from the original on May 31, 2011. Retrieved June 7, 2011.
- ↑ Taylor, William Alexander (1899). Ohio Statesmen and Annals of Progress. Press of the Westbote Company. p. 243.
- ↑ Knepper, George W. (2002). The Official Ohio Lands Book (PDF). Ohio State Auditor. p. 75.
- ↑ Appalachian Regional Commission Archived September 17, 2008, at the Wayback Machine.
- ↑ "Ohio: Individual County Chronologies". Ohio Atlas of Historical County Boundaries. The Newberry Library. 2007. Retrieved February 12, 2015.
- ↑ Ohio Historical Marker
- ↑ Carroll County Historical Marker
- ↑ "2010 Census Gazetteer Files". United States Census Bureau. August 22, 2012. Archived from the original on May 4, 2014. Retrieved February 7, 2015.
- ↑ "Population and Housing Unit Estimates". Retrieved June 9, 2017.
- ↑ "U.S. Decennial Census". United States Census Bureau. Archived from the original on May 12, 2015. Retrieved February 7, 2015.
- ↑ "Historical Census Browser". University of Virginia Library. Retrieved February 7, 2015.
- ↑ Forstall, Richard L., ed. (March 27, 1995). "Population of Counties by Decennial Census: 1900 to 1990". United States Census Bureau. Retrieved February 7, 2015.
- ↑ "Census 2000 PHC-T-4. Ranking Tables for Counties: 1990 and 2000" (PDF). United States Census Bureau. April 2, 2001. Retrieved February 7, 2015.
- ↑ "American FactFinder". United States Census Bureau. Archived from the original on September 11, 2013. Retrieved January 31, 2008.
- 1 2 3 "DP-1 Profile of General Population and Housing Characteristics: 2010 Demographic Profile Data". United States Census Bureau. Retrieved December 27, 2015.
- ↑ "Population, Housing Units, Area, and Density: 2010 - County". United States Census Bureau. Retrieved December 27, 2015.
- ↑ "DP02 SELECTED SOCIAL CHARACTERISTICS IN THE UNITED STATES – 2006-2010 American Community Survey 5-Year Estimates". United States Census Bureau. Retrieved December 27, 2015.
- ↑ "DP03 SELECTED ECONOMIC CHARACTERISTICS – 2006-2010 American Community Survey 5-Year Estimates". United States Census Bureau. Retrieved December 27, 2015.
- ↑ Leip, David. "Dave Leip's Atlas of U.S. Presidential Elections". uselectionatlas.org. Retrieved 2018-05-01.
- ↑ The leading "other" candidate, Progressive Theodore Roosevelt, received 1,089 votes, while Socialist candidate Eugene Debs received 128 votes, Prohibition candidate Eugene Chafin received 108 votes, and Socialist Labor candidate Arthur Reimer received 8 votes.
- ↑ County Website
- ↑ "Archived copy". Archived from the original on May 28, 2010. Retrieved January 7, 2010. Mr. Thrifty 3, November 12, 2009, page 3
- ↑ "2007 census of agriculture" (PDF). USDA. Retrieved May 18, 2012.
- ↑ "Utica/Point Pleasant Shale Wells" (PDF). Ohio DNR. Archived from the original (PDF) on June 12, 2012. Retrieved May 18, 2012.
- ↑ "The Most Polluted County in Every State". MSN. Archived from the original on March 4, 2016. Retrieved January 13, 2016.
External links
| Wikimedia Commons has media related to Carroll County, Ohio. |
Places adjacent to Carroll County, Ohio | ||||||||||
|---|---|---|---|---|---|---|---|---|---|---|
| ||||||||||
Municipalities and communities of Carroll County, Ohio, United States | ||
|---|---|---|
| Villages | | |
| Townships | ||
| CDP | ||
| Unincorporated communities | ||
| Footnotes | ‡This populated place also has portions in an adjacent county or counties | |