Hancock County, Ohio
| Hancock County, Ohio | |||
|---|---|---|---|
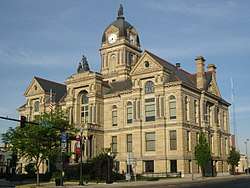 The Hancock County Courthouse in Findlay | |||
| |||
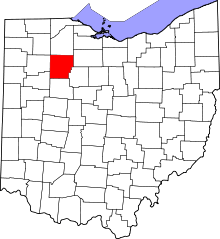 Location in the U.S. state of Ohio | |||
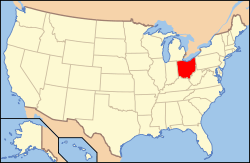 Ohio's location in the U.S. | |||
| Founded | March 1, 1828 | ||
| Named for | John Hancock | ||
| Seat | Findlay | ||
| Largest city | Findlay | ||
| Area | |||
| • Total | 534 sq mi (1,383 km2) | ||
| • Land | 531 sq mi (1,375 km2) | ||
| • Water | 2.3 sq mi (6 km2), 0.4% | ||
| Population | |||
| • (2010) | 74,782 | ||
| • Density | 141/sq mi (54/km2) | ||
| Congressional district | 5th | ||
| Time zone | Eastern: UTC−5/−4 | ||
| Website |
www | ||

.svg.png)
Hancock County is a county located in the U.S. state of Ohio. As of the 2010 census, the population was 74,782.[1] Its county seat is Findlay.[2] The county was created in 1820 and later organized in 1828.[3] It was named for John Hancock, the first signer of the Declaration of Independence.[4]
Hancock County comprises the Findlay, OH Micropolitan Statistical Area.
History
Hancock County was established on January 21, 1828, by the Ohio General Assembly from the southern portions of Wood County. Originally containing only Findlay Township, the county would add Amanda and Welfare (now Delaware) townships later in April of that year. Additional townships were laid out as follows: Jackson in 1829; Liberty and Marion in December 1830; Big Lick, Blanchard and Van Buren in 1831; Washington, Union, and Eagle in 1832; Cass and Portage in 1833; Pleasant in 1835; Orange in 1836; Madison in 1840, and finally Allen in 1850. Originally nearly 24 miles square, Hancock County would lose some of its southeast portion in 1845 to the new Wyandot County.[5]
Geography
According to the U.S. Census Bureau, the county has a total area of 534 square miles (1,380 km2), of which 531 square miles (1,380 km2) is land and 2.3 square miles (6.0 km2) (0.4%) is water.[6]
Adjacent counties
- Wood County (north)
- Seneca County (northeast)
- Wyandot County (southeast)
- Hardin County (south)
- Allen County (southwest)
- Putnam County (west)
- Henry County (northwest)
Demographics
| Historical population | |||
|---|---|---|---|
| Census | Pop. | %± | |
| 1830 | 813 | — | |
| 1840 | 9,986 | 1,128.3% | |
| 1850 | 16,751 | 67.7% | |
| 1860 | 22,886 | 36.6% | |
| 1870 | 23,847 | 4.2% | |
| 1880 | 27,784 | 16.5% | |
| 1890 | 42,563 | 53.2% | |
| 1900 | 41,993 | −1.3% | |
| 1910 | 37,860 | −9.8% | |
| 1920 | 38,394 | 1.4% | |
| 1930 | 40,404 | 5.2% | |
| 1940 | 40,793 | 1.0% | |
| 1950 | 44,280 | 8.5% | |
| 1960 | 53,686 | 21.2% | |
| 1970 | 61,217 | 14.0% | |
| 1980 | 64,581 | 5.5% | |
| 1990 | 65,536 | 1.5% | |
| 2000 | 71,295 | 8.8% | |
| 2010 | 74,782 | 4.9% | |
| Est. 2017 | 75,754 | [7] | 1.3% |
| U.S. Decennial Census[8] 1790-1960[9] 1900-1990[10] 1990-2000[11] 2010-2017[1] | |||
2000 census
As of the census[12] of 2000, there were 71,295 people, 27,898 households, and 19,138 families residing in the county. The population density was 134 people per square mile (52/km²). There were 29,785 housing units at an average density of 56 per square mile (22/km²). The racial makeup of the county was 95.14% White, 1.11% Black or African American, 0.18% Native American, 1.22% Asian, 0.02% Pacific Islander, 1.22% from other races, and 1.12% from two or more races. 3.07% of the population were Hispanic or Latino of any race.
There were 27,898 households out of which 32.60% had children under the age of 18 living with them, 56.40% were married couples living together, 8.70% had a female householder with no husband present, and 31.40% were non-families. 26.00% of all households were made up of individuals and 9.80% had someone living alone who was 65 years of age or older. The average household size was 2.49 and the average family size was 3.01.
In the county, the population was spread out with 25.70% under the age of 18, 9.70% from 18 to 24, 28.70% from 25 to 44, 22.60% from 45 to 64, and 13.20% who were 65 years of age or older. The median age was 36 years. For every 100 females there were 94.30 males. For every 100 females age 18 and over, there were 91.20 males.
The median income for a household in the county was $43,856, and the median income for a family was $51,490. Males had a median income of $37,139 versus $24,374 for females. The per capita income for the county was $20,991. About 5.20% of families and 7.50% of the population were below the poverty line, including 8.80% of those under age 18 and 6.10% of those age 65 or over.
2010 census
As of the 2010 United States Census, there were 74,782 people, 30,197 households, and 19,884 families residing in the county.[13] The population density was 140.7 inhabitants per square mile (54.3/km2). There were 33,174 housing units at an average density of 62.4 per square mile (24.1/km2).[14] The racial makeup of the county was 93.4% white, 1.7% Asian, 1.5% black or African American, 0.2% American Indian, 1.4% from other races, and 1.8% from two or more races. Those of Hispanic or Latino origin made up 4.5% of the population.[13] In terms of ancestry, 43.1% were German, 11.0% were Irish, 10.3% were English, and 6.6% were American.[15]
Of the 30,197 households, 30.7% had children under the age of 18 living with them, 51.3% were married couples living together, 10.0% had a female householder with no husband present, 34.2% were non-families, and 27.9% of all households were made up of individuals. The average household size was 2.42 and the average family size was 2.94. The median age was 38.5 years.[13]
The median income for a household in the county was $49,070 and the median income for a family was $59,600. Males had a median income of $42,479 versus $31,631 for females. The per capita income for the county was $25,158. About 8.5% of families and 11.4% of the population were below the poverty line, including 15.2% of those under age 18 and 5.7% of those age 65 or over.[16]
Politics
| Year | Republican | Democratic | Third parties |
|---|---|---|---|
| 2016 | 66.7% 24,183 | 26.5% 9,609 | 6.7% 2,442 |
| 2012 | 62.7% 22,443 | 35.1% 12,564 | 2.2% 776 |
| 2008 | 60.5% 22,420 | 37.4% 13,870 | 2.1% 765 |
| 2004 | 70.5% 25,105 | 29.1% 10,352 | 0.5% 162 |
| 2000 | 68.5% 20,985 | 28.7% 8,798 | 2.7% 834 |
| 1996 | 57.7% 17,252 | 31.2% 9,334 | 11.1% 3,322 |
| 1992 | 52.6% 16,821 | 24.9% 7,944 | 22.5% 7,198 |
| 1988 | 72.0% 19,896 | 26.9% 7,435 | 1.1% 312 |
| 1984 | 78.3% 22,169 | 20.4% 5,758 | 1.3% 370 |
| 1980 | 67.6% 18,264 | 25.3% 6,843 | 7.0% 1,903 |
| 1976 | 63.1% 15,983 | 33.7% 8,548 | 3.2% 802 |
| 1972 | 70.7% 18,111 | 23.7% 6,084 | 5.6% 1,429 |
| 1968 | 61.1% 15,032 | 28.1% 6,918 | 10.8% 2,659 |
| 1964 | 50.1% 11,610 | 49.9% 11,547 | |
| 1960 | 71.8% 17,059 | 28.2% 6,712 | |
| 1956 | 74.8% 15,713 | 25.2% 5,289 | |
| 1952 | 73.7% 14,999 | 26.4% 5,366 | |
| 1948 | 63.2% 11,427 | 36.5% 6,598 | 0.3% 54 |
| 1944 | 68.3% 13,450 | 31.7% 6,252 | |
| 1940 | 64.6% 14,174 | 35.4% 7,755 | |
| 1936 | 47.2% 9,816 | 47.8% 9,929 | 5.0% 1,039 |
| 1932 | 48.6% 9,260 | 49.2% 9,370 | 2.3% 431 |
| 1928 | 75.5% 13,151 | 23.9% 4,158 | 0.6% 101 |
| 1924 | 57.0% 9,167 | 31.8% 5,111 | 11.2% 1,796 |
| 1920 | 59.5% 9,746 | 39.0% 6,386 | 1.6% 258 |
| 1916 | 42.8% 4,268 | 54.3% 5,416 | 2.9% 292 |
| 1912 | 24.8% 2,241 | 47.7% 4,309 | 27.6% 2,491 |
| 1908 | 45.4% 4,899 | 50.3% 5,420 | 4.3% 462 |
| 1904 | 55.3% 5,766 | 39.8% 4,148 | 4.9% 512 |
| 1900 | 50.1% 5,559 | 48.0% 5,322 | 1.8% 205 |
| 1896 | 49.7% 5,591 | 49.3% 5,546 | 1.1% 121 |
| 1892 | 46.4% 4,780 | 47.9% 4,931 | 5.7% 582 |
| 1888 | 48.5% 4,634 | 47.5% 4,539 | 4.0% 384 |
| 1884 | 47.3% 3,245 | 51.0% 3,497 | 1.7% 116 |
| 1880 | 47.9% 3,124 | 51.4% 3,350 | 0.6% 42 |
| 1876 | 46.6% 2,811 | 53.3% 3,215 | 0.1% 8 |
| 1872 | 48.5% 2,311 | 51.4% 2,449 | 0.1% 3 |
Government
_Auditor.svg.png)
Communities

Cities
Villages
Townships
https://web.archive.org/web/20160715023447/http://www.ohiotownships.org/township-websites
Unincorporated communities
- Butlers Mill
- Cannonsburg
- Chase
- Cordelia
- Deweyville
- Hancock
- Houcktown
- Mortimer
- New Stark
- Portage Center
- Pratts
- Shawtown
- West Independence
- Williamstown
See also
References
- 1 2 "State & County QuickFacts". United States Census Bureau. Archived from the original on July 11, 2011. Retrieved February 8, 2015.
- ↑ "Find a County". National Association of Counties. Retrieved 2011-06-07.
- ↑ "Ohio: Individual County Chronologies". Ohio Atlas of Historical County Boundaries. The Newberry Library. 2007. Retrieved February 14, 2015.
- ↑ Gannett, Henry (1905). The Origin of Certain Place Names in the United States. Govt. Print. Off. p. 148.
- ↑ Brown 1886: Brown, R.C. (1886). History of Hancock County, Ohio. 3. Chicago: Warner. Beers & Co. Retrieved 2009-03-27.
- ↑ "2010 Census Gazetteer Files". United States Census Bureau. August 22, 2012. Archived from the original on May 4, 2014. Retrieved February 8, 2015.
- ↑ "Population and Housing Unit Estimates". Retrieved June 9, 2017.
- ↑ "U.S. Decennial Census". United States Census Bureau. Retrieved February 8, 2015.
- ↑ "Historical Census Browser". University of Virginia Library. Retrieved February 8, 2015.
- ↑ Forstall, Richard L., ed. (March 27, 1995). "Population of Counties by Decennial Census: 1900 to 1990". United States Census Bureau. Retrieved February 8, 2015.
- ↑ "Census 2000 PHC-T-4. Ranking Tables for Counties: 1990 and 2000" (PDF). United States Census Bureau. April 2, 2001. Retrieved February 8, 2015.
- ↑ "American FactFinder". United States Census Bureau. Retrieved 2008-01-31.
- 1 2 3 "DP-1 Profile of General Population and Housing Characteristics: 2010 Demographic Profile Data". United States Census Bureau. Retrieved 2015-12-27.
- ↑ "Population, Housing Units, Area, and Density: 2010 - County". United States Census Bureau. Retrieved 2015-12-27.
- ↑ "DP02 SELECTED SOCIAL CHARACTERISTICS IN THE UNITED STATES – 2006-2010 American Community Survey 5-Year Estimates". United States Census Bureau. Retrieved 2015-12-27.
- ↑ "DP03 SELECTED ECONOMIC CHARACTERISTICS – 2006-2010 American Community Survey 5-Year Estimates". United States Census Bureau. Retrieved 2015-12-27.
- ↑ Leip, David. "Dave Leip's Atlas of U.S. Presidential Elections". uselectionatlas.org. Retrieved 2018-05-02.
External links
| Wikivoyage has a travel guide for Hancock County. |
Municipalities and communities of Hancock County, Ohio, United States | ||
|---|---|---|
| Cities | | |
| Villages | ||
| Townships | ||
| Unincorporated communities | ||
| Footnotes | ‡This populated place also has portions in an adjacent county or counties | |