Columbiana County, Ohio
| Columbiana County, Ohio | |||
|---|---|---|---|
 | |||
| |||
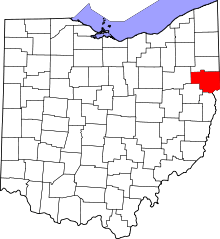 Location in the U.S. state of Ohio | |||
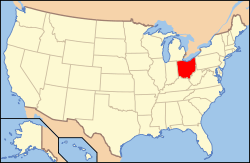 Ohio's location in the U.S. | |||
| Founded | May 1, 1803[1] | ||
| Named for | Christopher Columbus | ||
| Seat | Lisbon | ||
| Largest city | Salem | ||
| Area | |||
| • Total | 535 sq mi (1,386 km2) | ||
| • Land | 532 sq mi (1,378 km2) | ||
| • Water | 2.8 sq mi (7 km2), 0.5% | ||
| Population | |||
| • (2010) | 107,841 | ||
| • Density | 203/sq mi (78/km2) | ||
| Congressional district | 6th | ||
| Time zone | Eastern: UTC−5/−4 | ||
| Website |
www | ||

.svg.png)
Columbiana County is a county located in the U.S. state of Ohio. As of the 2010 census, the population was 107,841.[2] The county seat is Lisbon.[3] The county name is derived from the explorer of the Americas, Christopher Columbus.[4]
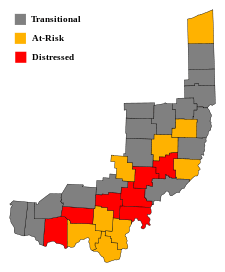
Columbiana County comprises the Salem, OH Micropolitan Statistical Area, which is also included in the larger Youngstown-Warren, OH-PA Combined Statistical Area. Due to its location, Columbiana County is traditionally considered part of East Ohio as southern communities generally share more in common culturally with Greater Pittsburgh, while northern communities are more associated with Northeast Ohio.
Officially considered part of the Youngstown media market, the Steubenville market media stations regularly report in the area as well.
History
The principal historic Indian tribes in the area were the Wyandots, Mingoes, and Delawares. Throughout the second half of the 18th century white explorers, starting with Christopher Gist in 1750, came to the area. George Washington, while engaged in land examinations, camped in the area of present-day East Liverpool in 1774.
Columbiana County was founded in 1803 and named in honor of Christopher Columbus, combining his surname with the suffix -iana. The county was the scene of one of the northern-most action fought during the American Civil War; on July 26, 1863 Confederate raiders under John Morgan were surrounded and captured by Union forces at Salineville.
The county was home to the largest pottery industry in the world, in East Liverpool & surrounding communities, which produced more than half of the United States' annual ceramics output. Throughout East Liverpool's ceramics history, there were more than 300 potteries.[5][6]
Geography
According to the U.S. Census Bureau, the county has a total area of 535 square miles (1,390 km2), of which 532 square miles (1,380 km2) is land and 2.8 square miles (7.3 km2) (0.5%) is water.[7]
Adjacent counties
- Mahoning County (north)
- Lawrence County, Pennsylvania (northeast)
- Beaver County, Pennsylvania (east)
- Hancock County, West Virginia (southeast)
- Jefferson County (south)
- Carroll County (southwest)
- Stark County (west)
Major Highways
Demographics
| Historical population | |||
|---|---|---|---|
| Census | Pop. | %± | |
| 1810 | 10,878 | — | |
| 1820 | 22,033 | 102.5% | |
| 1830 | 35,592 | 61.5% | |
| 1840 | 40,378 | 13.4% | |
| 1850 | 33,621 | −16.7% | |
| 1860 | 32,836 | −2.3% | |
| 1870 | 38,299 | 16.6% | |
| 1880 | 48,602 | 26.9% | |
| 1890 | 59,029 | 21.5% | |
| 1900 | 68,590 | 16.2% | |
| 1910 | 76,619 | 11.7% | |
| 1920 | 83,131 | 8.5% | |
| 1930 | 86,484 | 4.0% | |
| 1940 | 90,121 | 4.2% | |
| 1950 | 98,920 | 9.8% | |
| 1960 | 107,004 | 8.2% | |
| 1970 | 108,310 | 1.2% | |
| 1980 | 113,572 | 4.9% | |
| 1990 | 108,276 | −4.7% | |
| 2000 | 112,075 | 3.5% | |
| 2010 | 107,841 | −3.8% | |
| Est. 2017 | 103,077 | [8] | −4.4% |
| U.S. Decennial Census[9] 1790-1960[10] 1900-1990[11] 1990-2000[12] 2010-2017[2] | |||
2000 census
As of the census[13] of 2000, there were 112,075 people, 42,973 households, and 30,682 families residing in the county. The population density was 210 people per square mile (81/km²). There were 46,083 housing units at an average density of 86 per square mile (33/km²). The racial makeup of the county was 96.43% White, 2.20% Black or African American, 0.18% Native American, 0.23% Asian, 0.02% Pacific Islander, 0.15% from other races, and 0.79% from two or more races. 1.17% of the population were Hispanic or Latino of any race. 24.0% were of German, 12.9% English, 12.8% American, 12.3% Irish and 9.3% Italian ancestry according to Census 2000.
There were 42,973 households out of which 31.70% had children under the age of 18 living with them, 57.10% were married couples living together, 10.30% had a female householder with no husband present, and 28.60% were non-families. 24.80% of all households were made up of individuals and 11.90% had someone living alone who was 65 years of age or older. The average household size was 2.52 and the average family size was 3.00.
In the county, the population was spread out with 24.30% under the age of 18, 7.80% from 18 to 24, 28.60% from 25 to 44, 24.20% from 45 to 64, and 15.00% who were 65 years of age or older. The median age was 38 years. For every 100 females there were 98.80 males. For every 100 females age 18 and over, there were 96.60 males.
The median income for a household in the county was $34,226, and the median income for a family was $40,486. Males had a median income of $32,134 versus $20,331 for females. The per capita income for the county was $16,655. About 9.00% of families and 11.50% of the population were below the poverty line, including 16.20% of those under age 18 and 8.40% of those age 65 or over.
2010 census
As of the 2010 United States Census, there were 107,841 people, 42,683 households, and 29,101 families residing in the county.[14] The population density was 202.7 inhabitants per square mile (78.3/km2). There were 47,088 housing units at an average density of 88.5 per square mile (34.2/km2).[15] The racial makeup of the county was 95.5% white, 2.2% black or African American, 0.3% Asian, 0.2% American Indian, 0.5% from other races, and 1.3% from two or more races. Those of Hispanic or Latino origin made up 1.2% of the population.[14] In terms of ancestry, 29.2% were German, 17.7% were Irish, 14.6% were English, 9.1% were Italian, and 7.6% were American.[16]
Of the 42,683 households, 29.8% had children under the age of 18 living with them, 51.4% were married couples living together, 11.5% had a female householder with no husband present, 31.8% were non-families, and 26.8% of all households were made up of individuals. The average household size was 2.43 and the average family size was 2.92. The median age was 42.3 years.[14]
The median income for a household in the county was $39,502 and the median income for a family was $48,948. Males had a median income of $39,614 versus $27,179 for females. The per capita income for the county was $19,635. About 12.1% of families and 16.0% of the population were below the poverty line, including 25.6% of those under age 18 and 6.4% of those age 65 or over.[17]
Politics
| Year | Republican | Democratic | Third parties |
|---|---|---|---|
| 2016 | 68.1% 31,676 | 26.7% 12,432 | 5.1% 2,384 |
| 2012 | 54.7% 25,251 | 42.9% 19,821 | 2.4% 1,127 |
| 2008 | 52.5% 25,585 | 44.9% 21,882 | 2.5% 1,232 |
| 2004 | 52.1% 25,753 | 47.4% 23,429 | 0.6% 283 |
| 2000 | 49.1% 21,804 | 46.5% 20,657 | 4.4% 1,966 |
| 1996 | 35.3% 15,386 | 47.5% 20,716 | 17.3% 7,527 |
| 1992 | 31.6% 15,016 | 41.6% 19,765 | 26.9% 12,773 |
| 1988 | 49.1% 21,175 | 50.0% 21,581 | 0.9% 384 |
| 1984 | 54.4% 24,552 | 44.7% 20,155 | 0.9% 403 |
| 1980 | 50.6% 20,798 | 42.4% 17,459 | 7.0% 2,886 |
| 1976 | 48.1% 22,318 | 49.8% 23,096 | 2.1% 953 |
| 1972 | 62.6% 27,308 | 36.0% 15,683 | 1.4% 611 |
| 1968 | 46.2% 19,947 | 44.9% 19,382 | 8.9% 3,841 |
| 1964 | 35.5% 15,827 | 64.5% 28,706 | |
| 1960 | 58.6% 28,414 | 41.4% 20,037 | |
| 1956 | 66.5% 28,783 | 33.5% 14,516 | |
| 1952 | 58.4% 26,707 | 41.6% 19,057 | |
| 1948 | 51.3% 17,724 | 48.0% 16,588 | 0.7% 226 |
| 1944 | 51.5% 19,976 | 48.5% 18,796 | |
| 1940 | 48.7% 21,221 | 51.3% 22,349 | |
| 1936 | 42.3% 16,986 | 56.4% 22,664 | 1.4% 548 |
| 1932 | 55.6% 19,707 | 40.3% 14,284 | 4.1% 1,439 |
| 1928 | 77.3% 26,405 | 21.8% 7,461 | 0.9% 292 |
| 1924 | 70.0% 20,483 | 16.0% 4,685 | 14.0% 4,104 |
| 1920 | 60.1% 16,846 | 34.9% 9,774 | 5.0% 1,403 |
| 1916 | 46.9% 8,118 | 45.0% 7,788 | 8.2% 1,420 |
| 1912 | 28.6% 4,601 | 29.9% 4,816 | 41.5% 6,674[19] |
| 1908 | 53.3% 9,626 | 37.3% 6,736 | 9.5% 1,710 |
| 1904 | 67.2% 11,571 | 24.4% 4,203 | 8.4% 1,439 |
| 1900 | 60.7% 10,255 | 35.5% 5,997 | 3.8% 648 |
| 1896 | 57.8% 9,487 | 40.2% 6,598 | 2.0% 329 |
| 1892 | 52.0% 7,232 | 40.1% 5,573 | 8.0% 1,111 |
| 1888 | 57.1% 7,700 | 38.2% 5,154 | 4.7% 636 |
| 1884 | 57.9% 6,995 | 37.0% 4,472 | 5.2% 624 |
| 1880 | 58.5% 6,545 | 38.2% 4,273 | 3.4% 379 |
| 1876 | 55.9% 5,417 | 41.3% 4,000 | 2.9% 279 |
| 1872 | 61.8% 4,773 | 37.5% 2,897 | 0.7% 56 |
Government
_Auditor.svg.png) Seal of the Columbiana County Auditor
Seal of the Columbiana County Auditor_Board_of_Commissioners.svg.png) Seal of the Columbiana County Board of Commissioners
Seal of the Columbiana County Board of Commissioners_Board_of_Elections.svg.png) Seal of the Columbiana County Board of Elections
Seal of the Columbiana County Board of Elections_Common_Pleas_Court.svg.png) Seal of the Common Pleas Court of Columbiana County
Seal of the Common Pleas Court of Columbiana County_Court_House.svg.png) Seal of the Columbiana County Court House
Seal of the Columbiana County Court House_Recorder.svg.png) Seal of the Columbiana County Recorder
Seal of the Columbiana County Recorder_Treasurer.svg.png) Seal of the Columbiana County Treasurer
Seal of the Columbiana County Treasurer
Education
Colleges and universities
Community, junior, and technical colleges
- Columbiana County Career and Technical Center
- New Castle School of Trades
- Ohio Valley College of Technology
Public school districts
- Alliance City School District
- Beaver Local School District
- Columbiana Exempted Village School District
- Crestview Local School District
- East Liverpool City School District
- East Palestine City School District
- Leetonia Exempted Village School District
- Lisbon Exempted Village School District
- Minerva Local School District
- Salem City School District
- Southern Local School District
- United Local School District
- Wellsville Local School District
- West Branch Local School District
High schools
- Beaver Local High School
- Columbiana High School
- Crestview High School
- David Anderson Junior/Senior High School
- East Liverpool Junior/Senior High School
- East Palestine High School
- Leetonia High School
- Salem High School
- Southern Local Junior/Senior High School
- United High School
- Wellsville Junior/Senior High School
Private schools
- Heartland Christian School – Columbiana
- East Liverpool Christian School – Glenmoor
- St. Paul Elementary School – Salem
Communities

Cities
Villages
Townships
https://web.archive.org/web/20160715023447/http://www.ohiotownships.org/township-websites
Census-designated places
Unincorporated communities
- Achor
- Bayard
- Cannons Mill
- Chambersburg
- Clarkson
- Dungannon
- East Carmel
- East Fairfield
- Elkton
- Franklin Square
- Fredericktown
- Gavers
- Glasgow
- Guilford
- Highlandtown
- Kensington
- Lynchburg
- Middleton
- Mill Rock
- Millport
- Moultrie
- New Alexander
- New Garden
- New Middleton
- New Salisbury
- North Georgetown
- Reading
- Teegarden
- Unionville
- Unity
- Valley
- West Point
- Williamsport
- Winona
Population ranking
The population ranking of the following table is based on the 2010 census of Columbiana County.[20]
† county seat
| Rank | City/Town/etc. | Population (2010 Census) | Township | Municipal type |
|---|---|---|---|---|
| 1 | Salem | 12,303 | Perry | City |
| 2 | East Liverpool | 11,195 | Liverpool | City |
| 3 | Columbiana | 6,384 | Fairfield | City |
| 4 | East Palestine | 4,721 | Unity | Village |
| 5 | Calcutta | 3,742 | St. Clair | CDP |
| 6 | Minerva | 3,720 | West | Village |
| 7 | Wellsville | 3,541 | Yellow Creek | Village |
| 8 | † Lisbon | 2,821 | Center | Village |
| 9 | Glenmoor | 1,987 | St. Clair | CDP |
| 10 | Leetonia | 1,959 | Salem | Village |
| 11 | Salineville | 1,311 | Washington | Village |
| 12 | New Waterford | 1,238 | Unity | Village |
| 13 | La Croft | 1,144 | Liverpool | CDP |
| 14 | Washingtonville | 801 | Salem | Village |
| 15 | Lake Tomahawk | 485 | Middleton | CDP |
| 16 | Homeworth | 481 | Knox | CDP |
| 17 | Damascus | 443 | Butler | CDP |
| 18 | Hanoverton | 408 | Hanover | Village |
| 19 | Negley | 281 | Middleton | CDP |
| 20 | Rogers | 237 | Middleton | Village |
| 21 | East Rochester | 231 | West | CDP |
| 22 | Summitville | 135 | Franklin | Village |
Notable residents
- Ammon Hennacy - notable Christian anarchist, grew up in Negley
- Harvey Firestone, businessman & founder of the Firestone Tire and Rubber Company,
- William M. Fogo - Wisconsin legislator and newspaper editor
- Mark Hanna - U.S. Senator from Ohio, grew up in Lisbon
- Robert Justice - early Ohio statesman
- William McKinley - 25th President of the United States, grew up in Lisbon
- Almira Park - maternal grandmother of President Richard Nixon & mother of Hannah Milhous Nixon, lived in Clarkson
- Clement Vallandigham - Copperhead leader, born and lived for several years in Lisbon
- Derek Wolfe - NFL Defensive End for the Denver Broncos, grew up in Negley
- Lou Holtz, former collegiate football coach, grew up in East Liverpool
See also
References
- ↑ "Ohio County Profiles: Columbiana County" (PDF). Ohio Department of Development. Archived from the original (PDF) on 2003-10-14. Retrieved 2007-04-28.
- 1 2 "State & County QuickFacts". United States Census Bureau. Retrieved February 7, 2015.
- ↑ "Find a County". National Association of Counties. Archived from the original on 2011-05-31. Retrieved 2011-06-07.
- ↑ "Columbiana County data". Ohio State University Extension Data Center. Archived from the original on 2013-10-29. Retrieved 2007-04-28.
- ↑ Museum of Ceramics
- ↑ City of Easter Liverpool Website
- ↑ "2010 Census Gazetteer Files". United States Census Bureau. August 22, 2012. Archived from the original on May 4, 2014. Retrieved February 7, 2015.
- ↑ "Population and Housing Unit Estimates". Retrieved June 9, 2017.
- ↑ "U.S. Decennial Census". United States Census Bureau. Archived from the original on May 12, 2015. Retrieved February 7, 2015.
- ↑ "Historical Census Browser". University of Virginia Library. Retrieved February 7, 2015.
- ↑ Forstall, Richard L., ed. (March 27, 1995). "Population of Counties by Decennial Census: 1900 to 1990". United States Census Bureau. Retrieved February 7, 2015.
- ↑ "Census 2000 PHC-T-4. Ranking Tables for Counties: 1990 and 2000" (PDF). United States Census Bureau. April 2, 2001. Retrieved February 7, 2015.
- ↑ "American FactFinder". United States Census Bureau. Archived from the original on 2013-09-11. Retrieved 2008-01-31.
- 1 2 3 "DP-1 Profile of General Population and Housing Characteristics: 2010 Demographic Profile Data". United States Census Bureau. Retrieved 2015-12-27.
- ↑ "Population, Housing Units, Area, and Density: 2010 - County". United States Census Bureau. Retrieved 2015-12-27.
- ↑ "DP02 SELECTED SOCIAL CHARACTERISTICS IN THE UNITED STATES – 2006-2010 American Community Survey 5-Year Estimates". United States Census Bureau. Retrieved 2015-12-27.
- ↑ "DP03 SELECTED ECONOMIC CHARACTERISTICS – 2006-2010 American Community Survey 5-Year Estimates". United States Census Bureau. Retrieved 2015-12-27.
- ↑ Leip, David. "Dave Leip's Atlas of U.S. Presidential Elections". uselectionatlas.org. Retrieved 2018-05-01.
- ↑ The leading "other" candidate, Progressive Theodore Roosevelt, received 3,811 votes, while Socialist candidate Eugene Debs received 1,916 votes, Prohibition candidate Eugene Chafin received 915 votes, and Socialist Labor candidate Arthur Reimer received 32 votes.
- ↑ "Archived copy". Archived from the original on 2013-12-21. Retrieved 2016-02-13.
External links
- Official Columbiana County website
- Columbiana County Biographies
- Humane Society of Columbiana County
- Columbiana County Fair
Places adjacent to Columbiana County, Ohio | |
|---|---|
Municipalities and communities of Columbiana County, Ohio, United States | ||
|---|---|---|
| Cities | | |
| Villages | ||
| Townships | ||
| CDPs | ||
| Unincorporated communities |
| |
| Ghost town | ||
| Footnotes | ‡This populated place also has portions in an adjacent county or counties | |