United States presidential election in Illinois, 2016
|
| ||||||||||||||||||||||||||
| ||||||||||||||||||||||||||
| Turnout |
70.56% | |||||||||||||||||||||||||
|---|---|---|---|---|---|---|---|---|---|---|---|---|---|---|---|---|---|---|---|---|---|---|---|---|---|---|
| ||||||||||||||||||||||||||
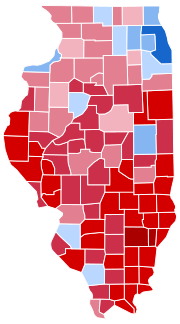 County Results
| ||||||||||||||||||||||||||
 Results by county showing number of votes by size and candidates by color | ||||||||||||||||||||||||||
| ||||||||||||||||||||||||||

.jpg)
| Elections in Illinois | ||||||||
|---|---|---|---|---|---|---|---|---|
 | ||||||||
|
||||||||
|
||||||||
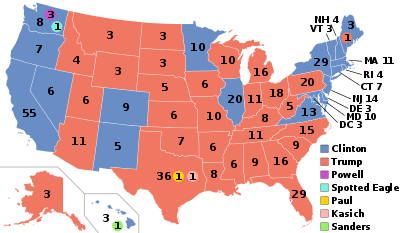
The 2016 United States presidential election in Illinois was held on November 8, 2016, as part of the 2016 General Election in which all 50 states plus The District of Columbia participated. Illinois voters chose 20 electors to represent them in the Electoral College via a popular vote pitting the Republican Party's nominee, businessman Donald Trump, and running mate Indiana Governor Mike Pence against Democratic Party nominee, former Secretary of State Hillary Clinton and her running mate, Virginia Senator Tim Kaine.
Illinois was won by former Secretary of State Hillary Clinton, who garnered 55.83% of votes cast against Donald Trump's 38.76%, winning the state by a margin of 17.07%. Prior to the election, news organizations predicted that the state would be carried by Clinton, who was born in Illinois. Clinton won by a slightly enlarged margin from Barack Obama's 2012 win in his home state, however, her overall percentage was not as large as Obama's in 2008 or 2012.[2] Illinois was among the eleven states in which Hillary Clinton outperformed Barack Obama's margin in 2012.
Primary elections
Presidential primary elections for three parties were held in Illinois. From January 25 to February 17, 2016, the Green Party of the United States held primaries and caucuses, as part of the Green Party presidential primaries, to elect delegates representing a candidate at the 2016 Green National Convention. Physician and activist Jill Stein won a landslide of the popular vote, taking almost all of the state's 23 delegates. On March 15, 2016, both the Democratic and Republican parties held primaries in Illinois as part of a five-state contest being held on the day in both the Democratic and Republican presidential primaries. In the Democratic primaries, 156 pledged delegates to the 2016 Democratic National Convention were elected and awarded to candidates proportionally, according to countywide and statewide vote. In the Republican primaries, 69 delegates to the 2016 Republican National Convention were elected and awarded to the first place candidate, according to statewide vote.
Democratic primary
Forum
March 14, 2016 – Columbus, Ohio, and Springfield, Illinois: The tenth forum was held at 6:00 pm EDT on March 14, 2016, at the campus of Ohio State University in Columbus, Ohio, and at the Old State Capitol State Historic Site (Illinois) in Springfield, Illinois. It aired on MSNBC. The first section of the town hall with Bernie Sanders was moderated by Chuck Todd; the second section of the town hall with Hillary Clinton was moderated by Chris Matthews.
Results
Six candidates appeared on the Democratic presidential primary ballot:[3]
| Illinois Democratic primary, March 15, 2016 | |||||
|---|---|---|---|---|---|
| Candidate | Popular vote | Estimated delegates | |||
| Count | Percentage | Pledged | Unpledged | Total | |
| Hillary Clinton | 1,039,555 | 50.56% | 79 | 24 | 103 |
| Bernie Sanders | 999,494 | 48.61% | 77 | 1 | 78 |
| Willie Wilson | 6,565 | 0.32% | |||
| Martin O'Malley (withdrawn) | 6,197 | 0.30% | 0 | 1 | 1 |
| Lawrence "Larry Joe" Cohen | 2,407 | 0.12% | |||
| Rocky De La Fuente | 1,802 | 0.09% | |||
| Others | 27 | 0.00% | |||
| Uncommitted | N/A | 0 | 1 | 1 | |
| Total | 2,056,047 | 100% | 156 | 27 | 183 |
| Source: The Green Papers, Illinois Board of Elections and Illinois Democratic Party - Official Pledged Delegates Allocation | |||||
Republican primary
Ten candidates appeared on the Republican presidential primary ballot:[3]
| Illinois Republican primary, March 15, 2016 | |||||
|---|---|---|---|---|---|
| Candidate | Votes | Percentage | Actual delegate count | ||
| Bound | Unbound | Total | |||
| 562,464 | 38.80% | 54 | 0 | 54 | |
| Ted Cruz | 438,235 | 30.23% | 9 | 0 | 9 |
| John Kasich | 286,118 | 19.74% | 6 | 0 | 6 |
| Marco Rubio | 126,681 | 8.74% | 0 | 0 | 0 |
| Ben Carson (withdrawn) | 11,469 | 0.79% | 0 | 0 | 0 |
| Jeb Bush (withdrawn) | 11,188 | 0.77% | 0 | 0 | 0 |
| Rand Paul (withdrawn) | 4,718 | 0.33% | 0 | 0 | 0 |
| Chris Christie (withdrawn) | 3,428 | 0.24% | 0 | 0 | 0 |
| Mike Huckabee (withdrawn) | 2,737 | 0.19% | 0 | 0 | 0 |
| Carly Fiorina (withdrawn) | 1,540 | 0.11% | 0 | 0 | 0 |
| Rick Santorum (withdrawn) | 1,154 | 0.08% | 0 | 0 | 0 |
| Unprojected delegates: | 0 | 0 | 0 | ||
| Total: | 1,449,748 | 100.00% | 69 | 0 | 69 |
| Source: The Green Papers | |||||
Green primary
The Green Party of Illinois held the very first primary election for the Green Party of the United States, in their series of presidential primaries. Registered Green party voters could participate in the primary through an online ballot or at select caucus sites in the state on various dates. 23 delegates to the 2016 Green National Convention were up for election in this primary.
Five candidates stood for election, including a sixth "uncommitted" option for the ballot. The candidates included activist and Green nominee in the 2012 presidential election, Jill Stein, singer-songwriter Darryl Cherney, businesswoman Sedinam Moyowasifza-Curry, perennial candidate Kent Mesplay, and professor William "Bill" Kreml. By the end of the primary, 134 votes were cast, with Stein winning a landslide 87% of the vote. 20 delegates from Illinois to the convention were allocated to Stein following the primary, with 1 being allocated to William Kreml and 2 being sent as uncommitted delegates.[4][5]
| Illinois Green Party presidential primary, January 25 - February 17, 2016 | |||
|---|---|---|---|
| Candidate | Votes | Percentage | National delegates |
| 119 | 87% | 20 | |
| William Kreml | 5 | 4% | 1 |
| Kent Mesplay | 2 | 1% | 0 |
| Sedinam Moyowasifza-Curry | 2 | 6% | 0 |
| Darryl Cherney | 0 | 0% | 0 |
| Uncommitted | 10 | 7% | 2 |
| Total | 134 | 100.00% | 23 |
General election
Analysis
Clinton's win in Illinois was largely the result of a lopsided victory in Cook County, the state's most populous county and home of Chicago, the city where Clinton was born and raised. Trump meanwhile won most of the downstate rural counties by large margins. Many of these counties had voted for Clinton's husband in both his 1992 and 1996 presidential runs. This is also the first presidential election in history where a Republican managed to win the White House nationally without carrying any of Chicago's collar counties aside from McHenry County, which is much more Republican-leaning than the other four collar counties. Illinois, along with Minnesota, was one of the only two Midwestern states not won by Donald Trump. The election marked the first time since 1988 in which Illinois did not vote the same as neighboring Wisconsin.
This county, including the collar counties and downstate counties of Champaign and McLean, were the only ones to swing towards Clinton, although Clinton carried the former mentioned. Knowing these statistics, if one were to subtract Cook County's total votes from the rest of Illinois, Donald Trump would have won the state with 1,692,728 votes to Clinton's 1,478,783 votes.[6] This is the first time the Republicans have won Alexander County since Richard Nixon's 1972 landslide.[7] Peoria County matched the national popular vote this year, as it did in the 2012 election.[8]
Had Clinton won the election, she would have become the second president born in Illinois after Ronald Reagan. But like Reagan, both politicians jump started their political careers in elected office elsewhere. Reagan served as Governor of California while Clinton served as a United States Senator from New York.
Polling
Results
| United States presidential election in Illinois, 2016[9] | ||||||
|---|---|---|---|---|---|---|
| Party | Candidate | Running mate | Votes | % | Electoral votes | |
| Democratic | Hillary Clinton | Tim Kaine | 3,090,729 | 55.83% | 20 | |
| Republican | Donald Trump | Mike Pence | 2,146,015 | 38.76% | 0 | |
| Libertarian | Gary Johnson | William Weld | 209,596 | 3.79% | 0 | |
| Green | Jill Stein | Ajamu Baraka | 76,802 | 1.39% | 0 | |
| Total | 5,536,424 | 100.0% | 20 | |||
By congressional district
Clinton won 11 of 18 congressional districts.[10]
| District | Trump | Clinton | Representative |
|---|---|---|---|
| 1st | 22% | 75% | Bobby Rush |
| 2nd | 19% | 79% | Robin Kelly |
| 3rd | 39% | 55% | Dan Lipinski |
| 4th | 13% | 81% | Luis Gutierrez |
| 5th | 24% | 70% | Mike Quigley |
| 6th | 43% | 50% | Peter Roskam |
| 7th | 9% | 87% | Danny K. Davis |
| 8th | 36% | 58% | Tammy Duckworth |
| Raja Krishnamoorthi | |||
| 9th | 25% | 69% | Jan Schakowsky |
| 10th | 32% | 61% | Robert Dold |
| Brad Schneider | |||
| 11th | 35% | 58% | Bill Foster |
| 12th | 55% | 40% | Mike Bost |
| 13th | 50% | 44% | Rodney Davis |
| 14th | 48% | 45% | Randy Hultgren |
| 15th | 71% | 24% | John Shimkus |
| 16th | 55% | 38% | Adam Kinzinger |
| 17th | 47% | 47% | Cheri Bustos |
| 18th | 60% | 33% | Darin LaHood |
By county
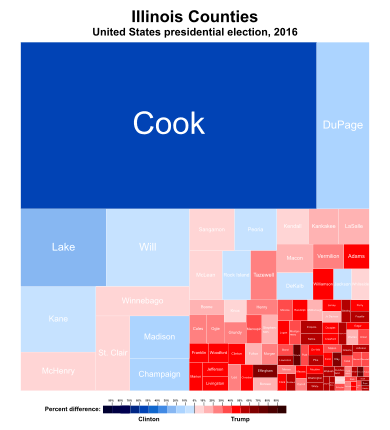
Despite winning the state by 17 points, Hillary Clinton only won 12 counties whilst Donald Trump won 90.
| County | Clinton% | Clinton# | Trump% | Trump# | Others% | Others# | Total |
|---|---|---|---|---|---|---|---|
| Adams County | 24.08% | 7,676 | 71.48% | 22,790 | 04.44% | 1,417 | 31,883 |
| Alexander County | 44.75% | 1,262 | 53.05% | 1,496 | 02.20% | 62 | 2,820 |
| Bond County | 27.68% | 2,068 | 65.43% | 4,888 | 06.89% | 515 | 7,471 |
| Boone County | 39.65% | 8,986 | 54.19% | 12,282 | 06.17% | 1,398 | 22,666 |
| Brown County | 20.18% | 476 | 76.13% | 1,796 | 03.69% | 87 | 2,359 |
| Bureau County | 36.86% | 6,029 | 56.75% | 9,281 | 06.39% | 1,045 | 16,355 |
| Calhoun County | 28.89% | 739 | 67.28% | 1,721 | 03.83% | 98 | 2,558 |
| Carroll County | 33.18% | 2,447 | 60.13% | 4,434 | 06.69% | 493 | 7,374 |
| Cass County | 32.04% | 1,621 | 63.56% | 3,216 | 04.41% | 223 | 5,060 |
| Champaign County | 55.77% | 50,137 | 37.12% | 33,368 | 07.12% | 6,398 | 89,903 |
| Christian County | 26.01% | 3,992 | 68.70% | 10,543 | 05.28% | 811 | 15,346 |
| Clark County | 23.99% | 1,877 | 71.85% | 5,622 | 04.17% | 326 | 7,825 |
| Clay County | 16.20% | 1,020 | 79.72% | 5,021 | 04.08% | 257 | 6,298 |
| Clinton County | 22.81% | 3,945 | 71.77% | 12,412 | 05.42% | 938 | 17,295 |
| Coles County | 33.80% | 7,309 | 60.13% | 13,003 | 06.07% | 1,312 | 21,624 |
| Cook County | 74.75% | 1,611,946 | 21.02% | 453,287 | 04.23% | 91,223 | 2,156,456 |
| Crawford County | 23.00% | 1,992 | 72.47% | 6,277 | 04.54% | 393 | 8,662 |
| Cumberland County | 18.67% | 1,031 | 76.17% | 4,206 | 05.16% | 285 | 5,522 |
| DeKalb County | 47.82% | 20,466 | 44.61% | 19,091 | 07.57% | 3,238 | 42,795 |
| De Witt County | 25.53% | 1,910 | 67.87% | 5,077 | 06.59% | 493 | 7,480 |
| Douglas County | 24.05% | 1,949 | 70.32% | 5,698 | 05.63% | 456 | 8,103 |
| DuPage County | 54.20% | 228,622 | 39.45% | 166,415 | 06.34% | 26,760 | 421,797 |
| Edgar County | 22.94% | 1,793 | 72.21% | 5,645 | 04.85% | 379 | 7,817 |
| Edwards County | 13.09% | 434 | 83.80% | 2,778 | 03.11% | 103 | 3,315 |
| Effingham County | 17.65% | 3,083 | 78.08% | 13,635 | 04.27% | 745 | 17,463 |
| Fayette County | 19.08% | 1,819 | 77.31% | 7,372 | 03.62% | 345 | 9,536 |
| Ford County | 22.43% | 1,414 | 71.07% | 4,480 | 06.50% | 410 | 6,304 |
| Franklin County | 25.46% | 4,727 | 70.64% | 13,116 | 03.90% | 724 | 18,567 |
| Fulton County | 39.20% | 6,133 | 54.28% | 8,492 | 06.51% | 1,019 | 15,644 |
| Gallatin County | 24.38% | 657 | 72.06% | 1,942 | 03.56% | 96 | 2,695 |
| Greene County | 21.70% | 1,205 | 74.64% | 4,145 | 03.66% | 203 | 5,553 |
| Grundy County | 35.09% | 8,065 | 58.54% | 13,454 | 06.37% | 1,463 | 22,982 |
| Hamilton County | 19.34% | 802 | 77.33% | 3,206 | 03.33% | 138 | 4,146 |
| Hancock County | 23.82% | 2,139 | 71.60% | 6,430 | 04.59% | 412 | 8,981 |
| Hardin County | 19.65% | 420 | 77.35% | 1,653 | 02.99% | 64 | 2,137 |
| Henderson County | 33.12% | 1,155 | 61.80% | 2,155 | 05.08% | 177 | 3,487 |
| Henry County | 36.51% | 8,871 | 57.55% | 13,985 | 05.94% | 1,443 | 24,299 |
| Iroquois County | 19.32% | 2,504 | 75.24% | 9,750 | 05.43% | 704 | 12,958 |
| Jackson County | 48.06% | 11,634 | 44.79% | 10,843 | 07.15% | 1,730 | 24,207 |
| Jasper County | 18.10% | 924 | 77.85% | 3,975 | 04.05% | 207 | 5,106 |
| Jefferson County | 26.26% | 4,425 | 69.40% | 11,695 | 04.34% | 731 | 16,851 |
| Jersey County | 24.51% | 2,679 | 70.88% | 7,748 | 04.61% | 504 | 10,931 |
| Jo Daviess County | 39.84% | 4,462 | 54.66% | 6,121 | 05.50% | 616 | 11,199 |
| Johnson County | 18.94% | 1,142 | 77.09% | 4,649 | 03.98% | 240 | 6,031 |
| Kane County | 52.20% | 103,665 | 41.66% | 82,734 | 06.14% | 12,203 | 198,602 |
| Kankakee County | 40.64% | 18,971 | 53.83% | 25,129 | 05.53% | 2,582 | 46,682 |
| Kendall County | 46.71% | 24,884 | 46.86% | 24,961 | 06.43% | 3,423 | 53,268 |
| Knox County | 45.40% | 10,083 | 48.35% | 10,737 | 06.25% | 1,387 | 22,207 |
| Lake County | 57.41% | 171,095 | 36.83% | 109,767 | 05.76% | 17,151 | 298,013 |
| LaSalle County | 39.73% | 19,543 | 54.26% | 26,689 | 06.01% | 2,958 | 49,190 |
| Lawrence County | 21.34% | 1,290 | 74.78% | 4,521 | 03.89% | 235 | 6,046 |
| Lee County | 36.22% | 5,528 | 56.42% | 8,612 | 07.36% | 1,123 | 15,263 |
| Livingston County | 26.58% | 4,023 | 67.43% | 10,208 | 05.99% | 907 | 15,138 |
| Logan County | 27.24% | 3,313 | 67.26% | 8,181 | 05.51% | 670 | 12,164 |
| Macon County | 38.60% | 18,343 | 56.54% | 26,866 | 04.86% | 2,311 | 47,520 |
| Macoupin County | 30.14% | 6,689 | 64.54% | 14,322 | 05.32% | 1,181 | 22,192 |
| Madison County | 39.40% | 50,587 | 54.90% | 70,490 | 05.70% | 7,319 | 128,396 |
| Marion County | 25.79% | 4,369 | 70.00% | 11,859 | 04.21% | 714 | 16,942 |
| Marshall County | 30.23% | 1,789 | 63.96% | 3,785 | 05.81% | 344 | 5,918 |
| Mason County | 31.24% | 2,014 | 62.94% | 4,058 | 05.82% | 375 | 6,447 |
| Massac County | 23.46% | 1,558 | 72.98% | 4,846 | 03.55% | 236 | 6,640 |
| McDonough County | 40.90% | 5,288 | 52.55% | 6,795 | 06.55% | 847 | 12,930 |
| McHenry County | 42.89% | 60,803 | 50.52% | 71,612 | 06.59% | 9,347 | 141,762 |
| McLean County | 45.53% | 36,196 | 46.84% | 37,237 | 07.63% | 6,067 | 79,500 |
| Menard County | 28.22% | 1,817 | 65.71% | 4,231 | 06.07% | 391 | 6,439 |
| Mercer County | 36.41% | 3,071 | 56.99% | 4,807 | 06.60% | 557 | 8,435 |
| Monroe County | 28.97% | 5,535 | 66.10% | 12,629 | 04.93% | 942 | 19,106 |
| Montgomery County | 27.25% | 3,504 | 67.10% | 8,630 | 05.65% | 727 | 12,861 |
| Morgan County | 32.10% | 4,696 | 62.03% | 9,076 | 05.87% | 859 | 14,631 |
| Moultrie County | 23.82% | 1,481 | 71.65% | 4,455 | 04.54% | 282 | 6,218 |
| Ogle County | 33.77% | 8,050 | 60.21% | 14,352 | 06.02% | 1,434 | 23,836 |
| Peoria County | 48.47% | 38,060 | 45.38% | 35,633 | 06.15% | 4,832 | 78,525 |
| Perry County | 25.18% | 2,462 | 70.11% | 6,855 | 04.70% | 460 | 9,777 |
| Piatt County | 29.65% | 2,645 | 63.16% | 5,634 | 07.19% | 641 | 8,920 |
| Pike County | 18.93% | 1,413 | 77.08% | 5,754 | 03.99% | 298 | 7,465 |
| Pope County | 17.58% | 375 | 78.67% | 1,678 | 03.75% | 80 | 2,133 |
| Pulaski County | 35.47% | 962 | 61.76% | 1,675 | 02.77% | 75 | 2,712 |
| Putnam County | 37.18% | 1,147 | 57.28% | 1,767 | 05.54% | 171 | 3,085 |
| Randolph County | 24.41% | 3,439 | 71.15% | 10,023 | 04.44% | 625 | 14,087 |
| Richland County | 20.74% | 1,584 | 75.13% | 5,739 | 04.14% | 316 | 7,639 |
| Rock Island County | 51.23% | 32,298 | 42.82% | 26,998 | 05.95% | 3,748 | 63,044 |
| Saline County | 22.80% | 2,572 | 73.35% | 8,276 | 03.86% | 435 | 11,283 |
| Sangamon County | 42.25% | 40,907 | 51.58% | 49,944 | 06.17% | 5,971 | 96,822 |
| Schuyler County | 28.33% | 1,075 | 66.53% | 2,524 | 05.14% | 195 | 3,794 |
| Scott County | 20.65% | 535 | 75.88% | 1,966 | 03.47% | 90 | 2,591 |
| Shelby County | 20.91% | 2,288 | 75.19% | 8,229 | 03.90% | 427 | 10,944 |
| St. Clair County | 50.51% | 60,756 | 44.78% | 53,857 | 04.71% | 5,661 | 120,274 |
| Stark County | 27.70% | 751 | 65.58% | 1,778 | 06.71% | 182 | 2,711 |
| Stephenson County | 38.76% | 7,768 | 55.31% | 11,083 | 05.93% | 1,188 | 20,039 |
| Tazewell County | 32.53% | 20,685 | 60.87% | 38,707 | 06.60% | 4,196 | 63,588 |
| Union County | 28.13% | 2,402 | 67.81% | 5,790 | 04.05% | 346 | 8,538 |
| Vermilion County | 32.89% | 10,039 | 62.54% | 19,087 | 04.57% | 1,394 | 30,520 |
| Wabash County | 21.26% | 1,151 | 74.74% | 4,047 | 04.01% | 217 | 5,415 |
| Warren County | 38.73% | 2,987 | 55.43% | 4,275 | 05.85% | 451 | 7,713 |
| Washington County | 19.61% | 1,448 | 75.45% | 5,571 | 04.94% | 365 | 7,384 |
| Wayne County | 12.69% | 1,048 | 84.34% | 6,967 | 02.98% | 246 | 8,261 |
| White County | 19.37% | 1,412 | 77.36% | 5,640 | 03.28% | 239 | 7,291 |
| Whiteside County | 43.68% | 11,035 | 49.93% | 12,615 | 06.38% | 1,613 | 25,263 |
| Will County | 50.58% | 151,927 | 44.18% | 132,720 | 05.24% | 15,727 | 300,374 |
| Williamson County | 27.20% | 8,581 | 68.38% | 21,570 | 04.42% | 1,395 | 31,546 |
| Winnebago County | 47.17% | 55,713 | 47.10% | 55,624 | 05.73% | 6,770 | 118,107 |
| Woodford County | 26.17% | 5,092 | 67.86% | 13,207 | 05.97% | 1,162 | 19,461 |
See also
References
- ↑ http://www.elections.il.gov/Downloads/ElectionInformation/VoteTotals/2016GEOfficialVote.pdf
- ↑ http://cookpolitical.com/story/10174. Missing or empty
|title=(help) - 1 2 http://www.chicagoelections.com/en/offices-on-the-ballots.html/
- ↑ Mastrangelo, Vito (February 19, 2016). "Dr. Jill Stein Wins ILGP Presidential Preference Vote!". Illinois Green Party. Green Party of the United States. Archived from the original on March 5, 2016. Retrieved March 8, 2016.
- ↑ Lesiak, Krzysztof (February 21, 2016). "Jill Stein easily wins Illinois Green Party presidential preference vote". American Third Party Report. Independent Political Report. Retrieved March 8, 2016.
- ↑ http://uselectionatlas.org/RESULTS/data.php?year=2016&def=swg&datatype=national&f=0&off=0&elect=0
- ↑ Sullivan, Robert David; ‘How the Red and Blue Map Evolved Over the Past Century’; America Magazine in The National Catholic Review; June 29, 2016,
- ↑ "Illinois Election Results 2016: President Live Map by County, Real-Time Voting Updates". Election Hub.
- ↑ "General Election 11/8/2016 Results". Retrieved December 13, 2016.
- ↑ "Presidential Results by Congressional District, 2000-2008 – Swing State Project". www.swingstateproject.com.
External links
- RNC 2016 Republican Nominating Process
- Green papers for 2016 primaries, caucuses, and conventions
- 2016 Presidential primaries, ElectionProjection.com
- Decision Desk Headquarter Results for Illinois