United States presidential election in Illinois, 2012
|
| ||||||||||||||||||||||||||
| ||||||||||||||||||||||||||
| ||||||||||||||||||||||||||
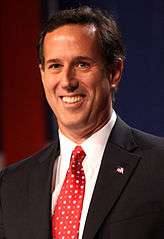
 County Results
| ||||||||||||||||||||||||||
| ||||||||||||||||||||||||||
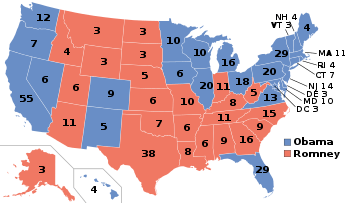
The 2012 United States presidential election in Illinois took place on November 6, 2012, as part of the 2012 General Election in which all 50 states plus The District of Columbia participated. Illinois voters chose 20 electors to represent them in the Electoral College via a popular vote pitting incumbent Democratic President Barack Obama and his running mate, Vice President Joe Biden, against Republican challenger and former Massachusetts Governor Mitt Romney and his running mate, Congressman Paul Ryan. The Obama/Biden ticket won Illinois with 57.60% of the popular vote to Romney/Ryan's 40.73%, thus winning the state's 20 electoral votes by a margin of 16.87%.[1]
Obama's victory in Illinois was due to an overwhelmingly strong vote total in Cook County, which includes Illinois' largest city, Chicago. Obama won Cook County with 74%, receiving 1,488,537 votes, compared to Romney who received only 24.6% of the votes in Cook County, or 495,542 votes.[2] The importance of the vote in Chicago and the rest of Cook County to Obama's victory in Illinois can be illustrated by a hypothetical scenario in which its votes are not included in the overall state total. Many counties in Southern Illinois that had voted for then Senator Obama in 2008, swung back to the GOP due to decreased enthusiasm for the Democratic incumbent. If one were to subtract all of the votes in Cook County from Illinois' total votes cast, Romney would have actually won Illinois, having received 1,629,863 votes (50.62%) in the rest of the state, compared to Obama, who received 1,524,886 votes (47.36%). This, despite Obama's good performance in the suburban collar counties, which are considered swing counties.
Obama's victory continued a Democratic winning streak in the state - the Democratic candidate has carried Illinois through the previous six election cycles. The last Republican to win Illinois in a Presidential Election was George H.W. Bush in 1988.
General Election
Results
While Obama only won 23% of the counties in Illinois, most of the counties he won were heavily populated. His 17-point victory can be largely attributed to his performance in Cook County, which encompasses the Chicago Metropolitan Area. He also won the once Republican favored collar counties. Obama won Dupage County, Will County, and Lake County. He also performed well in the East St. Louis area.
| United States presidential election in Illinois, 2012 | ||||||
|---|---|---|---|---|---|---|
| Party | Candidate | Running mate | Votes | Percentage | Electoral votes | |
| Democratic | Barack Hussein Obama (Incumbent) | Joseph Robinette Biden Jr. (Incumbent) | 3,019,512 | 57.60% | 20 | |
| Republican | Willard Mitt Romney | Paul Davis Ryan | 2,135,216 | 40.73% | 0 | |
| Libertarian | Gary Earl Johnson | Jim Gray | 56,229 | 1.07% | 0 | |
| Green | Jill Stein | Cheri Honkala | 30,222 | 0.58% | 0 | |
| Write-ins | Write-ins | 835 | 0.02% | 0 | ||
| Totals | 5,242,014 | 100.00% | 20 | |||
By county[3]
| County | Obama % | Obama Votes | Romney % | Romney Votes | Others % | Others Votes | Total Votes |
|---|---|---|---|---|---|---|---|
| Adams | 31.5% | 9,648 | 66.7% | 20,416 | 1.8% | 543 | 30,607 |
| Alexander | 56.1% | 1,965 | 42.5% | 1,487 | 1.4% | 49 | 3,501 |
| Bond | 40.9% | 3,020 | 55.5% | 4,095 | 3.5% | 260 | 7,375 |
| Boone | 46.1% | 9,883 | 51.8% | 11,096 | 2.2% | 462 | 21,441 |
| Brown | 33.3% | 787 | 64.0% | 1,513 | 2.7% | 64 | 2,364 |
| Bureau | 48.7% | 8,134 | 48.9% | 8,164 | 2.3% | 388 | 16,686 |
| Calhoun | 41.9% | 1,080 | 55.9% | 1,440 | 2.2% | 56 | 2,576 |
| Carroll | 49.5% | 3,665 | 48.0% | 3,555 | 2.5% | 186 | 7,406 |
| Cass | 42.1% | 2,053 | 55.5% | 2,707 | 2.4% | 118 | 4,878 |
| Champaign | 51.9% | 40,831 | 44.9% | 35,312 | 3.1% | 2,466 | 78,609 |
| Christian | 37.3% | 5,494 | 60.3% | 8,885 | 2.4% | 348 | 14,727 |
| Clark | 32.9% | 2,591 | 65.2% | 5,144 | 1.9% | 151 | 7,886 |
| Clay | 26.8% | 1,584 | 70.9% | 4,190 | 2.3% | 134 | 5,908 |
| Clinton | 34.0% | 5,596 | 63.9% | 10,524 | 2.2% | 361 | 16,481 |
| Coles | 43.2% | 9,262 | 54.3% | 11,631 | 2.5% | 544 | 21,437 |
| Cook | 74.0% | 1,488,537 | 24.6% | 495,542 | 1.4% | 27,519 | 2,011,598 |
| Crawford | 33.1% | 2,858 | 64.7% | 5,585 | 2.2% | 190 | 8,633 |
| Cumberland | 31.0% | 1,641 | 66.3% | 3,509 | 2.7% | 145 | 5,295 |
| DeKalb | 51.6% | 21,207 | 46.1% | 18,934 | 2.3% | 951 | 41,092 |
| De Witt | 35.3% | 2,601 | 62.1% | 4,579 | 2.6% | 188 | 7,368 |
| Douglas | 30.8% | 2,430 | 67.5% | 5,334 | 1.7% | 133 | 7,897 |
| DuPage | 49.7% | 199,460 | 48.6% | 195,046 | 1.6% | 6,575 | 401,081 |
| Edgar | 32.7% | 2,565 | 65.5% | 5,132 | 1.8% | 138 | 7,835 |
| Edwards | 23.4% | 754 | 74.5% | 2,405 | 2.1% | 69 | 3,228 |
| Effingham | 23.2% | 3,861 | 75.2% | 12,501 | 1.5% | 251 | 16,613 |
| Fayette | 31.7% | 2,853 | 66.0% | 5,951 | 2.3% | 208 | 9,012 |
| Ford | 27.5% | 1,656 | 70.2% | 4,229 | 2.3% | 139 | 6,024 |
| Franklin | 40.5% | 7,254 | 57.3% | 10,267 | 2.2% | 393 | 17,914 |
| Fulton | 54.0% | 8,328 | 43.0% | 6,632 | 2.9% | 451 | 15,411 |
| Gallatin | 40.0% | 1,029 | 58.0% | 1,492 | 2.0% | 52 | 2,573 |
| Greene | 35.9% | 2,023 | 61.2% | 3,451 | 2.9% | 163 | 5,637 |
| Grundy | 44.3% | 9,451 | 53.2% | 11,343 | 2.4% | 519 | 21,313 |
| Hamilton | 32.2% | 1,269 | 65.1% | 2,566 | 2.7% | 106 | 3,941 |
| Hancock | 40.1% | 3,650 | 57.9% | 5,271 | 2.1% | 190 | 9,111 |
| Hardin | 31.8% | 742 | 65.9% | 1,535 | 2.3% | 53 | 2,330 |
| Henderson | 55.4% | 1,978 | 43.2% | 1,541 | 1.4% | 49 | 3,568 |
| Henry | 50.5% | 12,332 | 47.5% | 11,583 | 2.0% | 490 | 24,405 |
| Iroquois | 26.7% | 3,413 | 71.3% | 9,120 | 2.0% | 251 | 12,784 |
| Jackson | 55.3% | 13,319 | 40.9% | 9,864 | 3.8% | 921 | 24,104 |
| Jasper | 28.5% | 1,436 | 69.7% | 3,514 | 1.8% | 93 | 5,043 |
| Jefferson | 37.3% | 6,089 | 60.1% | 9,811 | 2.6% | 420 | 16,320 |
| Jersey | 36.8% | 3,667 | 60.6% | 6,039 | 2.5% | 253 | 9,959 |
| Jo Daviess | 49.6% | 5,667 | 48.4% | 5,534 | 2.0% | 228 | 11,429 |
| Johnson | 27.7% | 1,572 | 69.9% | 3,963 | 2.4% | 137 | 5,672 |
| Kane | 49.7% | 90,332 | 48.6% | 88,335 | 1.6% | 2,981 | 181,648 |
| Kankakee | 47.3% | 21,595 | 50.7% | 23,136 | 2.0% | 923 | 45,654 |
| Kendall | 47.4% | 22,471 | 50.7% | 24,047 | 1.9% | 892 | 47,410 |
| Knox | 57.6% | 13,451 | 40.3% | 9,408 | 2.1% | 497 | 23,356 |
| Lake | 53.5% | 153,757 | 45.1% | 129,764 | 1.4% | 3,972 | 287,493 |
| LaSalle | 48.8% | 23,073 | 49.2% | 23,256 | 2.0% | 930 | 47,259 |
| Lawrence | 33.6% | 2,011 | 64.4% | 3,857 | 2.0% | 121 | 5,989 |
| Lee | 45.2% | 6,937 | 52.5% | 8,059 | 2.3% | 352 | 15,348 |
| Livingston | 33.3% | 5,020 | 64.7% | 9,753 | 2.0% | 304 | 15,077 |
| Logan | 33.0% | 3,978 | 65.1% | 7,844 | 1.9% | 231 | 12,053 |
| Macon | 46.5% | 22,780 | 51.6% | 25,309 | 1.9% | 941 | 49,030 |
| Macoupin | 44.9% | 9,464 | 51.9% | 10,946 | 3.2% | 673 | 21,083 |
| Madison | 48.1% | 58,922 | 49.5% | 60,608 | 2.4% | 2,943 | 122,473 |
| Marion | 39.3% | 6,225 | 58.5% | 9,248 | 2.2 | 347 | 15,820 |
| Marshall | 41.8% | 2,455 | 56.1% | 3,290 | 2.1% | 124 | 5,869 |
| Mason | 45.5% | 2,867 | 51.9% | 3,265 | 2.6% | 164 | 6,296 |
| Massac | 32.2% | 2,092 | 65.9% | 4,278 | 1.9% | 125 | 6,495 |
| McDonough | 47.9% | 5,967 | 49.4% | 6,147 | 2.7% | 340 | 12,454 |
| McHenry | 44.5% | 59,797 | 53.3% | 71,598 | 2.1% | 2,842 | 134,237 |
| McLean | 43.4% | 31,883 | 54.4% | 39,947 | 2.2% | 1,639 | 73,469 |
| Menard | 34.1% | 2,100 | 64.2% | 3,948 | 1.7% | 103 | 6,151 |
| Mercer | 52.6% | 4,507 | 45.2% | 3,876 | 2.2% | 185 | 8,568 |
| Monroe | 35.5% | 6,215 | 62.3% | 10,888 | 2.2% | 387 | 17,490 |
| Montgomery | 41.5% | 5,058 | 55.6% | 6,776 | 2.9% | 354 | 12,188 |
| Morgan | 41.1% | 5,806 | 56.4% | 7,972 | 2.6% | 364 | 14,142 |
| Moultrie | 35.3% | 2,144 | 62.3% | 3,784 | 2.4% | 147 | 6,075 |
| Ogle | 40.7% | 9,514 | 57.4% | 13,422 | 1.8% | 431 | 23,367 |
| Peoria | 51.3% | 40,209 | 46.9% | 36,774 | 1.8% | 1,428 | 78,411 |
| Perry | 39.8% | 3,819 | 57.5% | 5,507 | 2.7% | 258 | 9,584 |
| Piatt | 35.5% | 3,090 | 62.2% | 5,413 | 2.3% | 204 | 8,707 |
| Pike | 31.2% | 2,278 | 66.6% | 4,860 | 2.2% | 164 | 7,302 |
| Pope | 29.3% | 650 | 68.0% | 1,512 | 2.7% | 60 | 2,222 |
| Pulaski | 46.1% | 1,389 | 51.9% | 1,564 | 2.0% | 59 | 3,012 |
| Putnam | 49.6% | 1,559 | 47.8% | 1,502 | 2.6% | 82 | 3,143 |
| Randolph | 39.9% | 5,759 | 57.4% | 8,290 | 2.7% | 389 | 14,438 |
| Richland | 32.4% | 2,362 | 65.3% | 4,756 | 2.3% | 164 | 7,282 |
| Rock Island | 60.0% | 39,157 | 38.2% | 24,934 | 1.7% | 1,126 | 65,217 |
| Saline | 34.5% | 3,701 | 63.5% | 6,806 | 2.0% | 213 | 10,720 |
| Sangamon | 44.7% | 42,107 | 53.3% | 50,225 | 2.1% | 1,965 | 94,297 |
| Schuyler | 44.3% | 1,727 | 53.0% | 2,069 | 2.7% | 106 | 3,902 |
| Scott | 35.4% | 910 | 61.8% | 1,587 | 2.8% | 71 | 2,568 |
| Shelby | 32.0% | 3,342 | 65.6% | 6,843 | 2.4% | 254 | 10,439 |
| St. Clair | 56.2% | 67,285 | 41.8% | 50,125 | 2.0% | 2,417 | 119,827 |
| Stark | 41.1% | 1,095 | 57.4% | 1,528 | 1.5% | 39 | 2,662 |
| Stephenson | 48.1% | 10,165 | 49.8% | 10,512 | 2.1% | 451 | 21,128 |
| Tazewell | 39.9% | 24,438 | 57.7% | 35,335 | 2.5% | 1,509 | 61,282 |
| Union | 37.7% | 3,137 | 59.6% | 4,957 | 2.7% | 224 | 8,318 |
| Vermilion | 42.4% | 12,878 | 55.6% | 16,892 | 2.1% | 630 | 30,400 |
| Wabash | 31.0% | 1,590 | 67.7% | 3,478 | 1.3% | 66 | 5,134 |
| Warren | 51.7% | 4,044 | 46.3% | 3,618 | 2.0% | 156 | 7,818 |
| Washington | 33.0% | 2,450 | 64.5% | 4,792 | 2.6% | 193 | 7,435 |
| Wayne | 19.7% | 1,514 | 77.8% | 5,988 | 2.5% | 195 | 7,697 |
| White | 30.9% | 2,188 | 66.8% | 4,731 | 2.3% | 163 | 7,082 |
| Whiteside | 57.4% | 14,833 | 40.5% | 10,448 | 2.1% | 547 | 25,828 |
| Will | 51.9% | 144,229 | 46.4% | 128,969 | 1.8% | 4,964 | 278,162 |
| Williamson | 36.4% | 10,647 | 61.2% | 17,909 | 2.4% | 698 | 29,254 |
| Winnebago | 51.7% | 61,732 | 46.2% | 55,138 | 2.1% | 2,527 | 119,397 |
| Woodford | 29.4% | 5,572 | 68.4% | 12,961 | 2.1% | 405 | 18,938 |
| Illinois Total | 57.61% | 3,013,423 | 40.63% | 2,125,405 | 1.76% | 92,024 | 5,230,852 |
Primaries
Democratic
There was no Democratic Primary election in Illinois as no one in the Democratic party chose to run against the incumbent Democratic President, Barack Obama.
Republican
|
| |||||||||||||||||||||||||||||||||||||||||
| |||||||||||||||||||||||||||||||||||||||||
| |||||||||||||||||||||||||||||||||||||||||
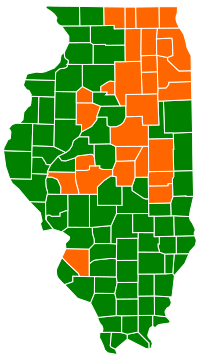 Illinois results by county
Mitt Romney
Rick Santorum | |||||||||||||||||||||||||||||||||||||||||

| Elections in Illinois | ||||||||
|---|---|---|---|---|---|---|---|---|
 | ||||||||
|
||||||||
|
||||||||
Part of a series on the 2012 U.S. presidential election |
|---|
| Democratic Party |
| Republican Party |
| Related races |
The Illinois Republican 2012 primary took place on March 20, 2012.[4][5]
| Illinois Republican primary, 2012[6] | |||||||
|---|---|---|---|---|---|---|---|
| Candidate | Votes | Percentage | Projected delegate count | ||||
| NYT | CNN [7] |
FOX | |||||
| 435,859 | 46.69% | 42 | 41 | 42 | |||
| Rick Santorum | 326,778 | 35.01% | 12 | 10 | 12 | ||
| Ron Paul | 87,044 | 9.32% | 0 | 0 | 0 | ||
| Newt Gingrich | 74,482 | 7.98% | 0 | 0 | 0 | ||
| Rick Perry (withdrawn) | 5,568 | 0.60% | 0 | 0 | 0 | ||
| Buddy Roemer (withdrawn) | 3,723 | 0.40% | 0 | 0 | 0 | ||
| Unprojected delegates: | 0 | 3 | 0 | ||||
| Total: | 933,454 | 100.00% | 54 | 54 | 54 | ||
See also
References
- ↑ "Illinois Board of Elections". Retrieved January 2, 2013.
- ↑ http://www.uselectionatlas.org/RESULTS/datagraph.php?fips=17&year=2012&off=0&elect=0&f=0
- ↑ http://www.uselectionatlas.org/RESULTS/datagraph.php?fips=17&year=2012&off=0&elect=0&f=0
- ↑ "Primary and Caucus Printable Calendar". CNN. Retrieved January 11, 2012.
- ↑ "Presidential Primary Dates" (PDF). Federal Election Commission. Retrieved January 23, 2012.
- ↑ http://www.elections.il.gov/ElectionInformation/VoteTotalsList.aspx?ElectionType=GP&ElectionID=32&SearchType=OfficeSearch&OfficeID=5881&QueryType=Office&
- ↑ Illinois - CNN
External links
- The Green Papers: for Illinois
- The Green Papers: Major state elections in chronological order
State results of the 2012 U.S. presidential election | ||
|---|---|---|
|  | |
| ||