Treemapping
In information visualization and computing, treemapping is a method for displaying hierarchical data using nested figures, usually rectangles.
Main idea
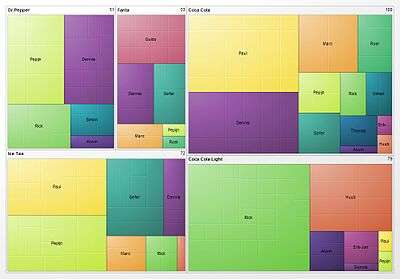
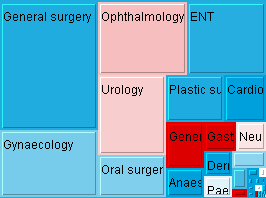
Treemaps display hierarchical (tree-structured) data as a set of nested rectangles. Each branch of the tree is given a rectangle, which is then tiled with smaller rectangles representing sub-branches. A leaf node's rectangle has an area proportional to a specified dimension of the data. Often the leaf nodes are colored to show a separate dimension of the data.
When the color and size dimensions are correlated in some way with the tree structure, one can often easily see patterns that would be difficult to spot in other ways, such as if a certain color is particularly relevant. A second advantage of treemaps is that, by construction, they make efficient use of space. As a result, they can legibly display thousands of items on the screen simultaneously.
Tiling algorithms
To create a treemap, one must define a tiling algorithm, that is, a way to divide a region into sub-regions of specified areas. Ideally, a treemap algorithm would create regions that satisfy the following criteria:
- A small aspect ratio—ideally close to one. Regions with a small aspect ratio (i.e, fat objects) are easier to perceive.[1]
- Preserve some sense of the ordering in the input data.
- Change to reflect changes in the underlying data.
Unfortunately, these properties have an inverse relationship. As the aspect ratio is optimized, the order of placement becomes less predictable. As the order becomes more stable, the aspect ratio is degraded.
Rectangular treemaps
To date, six primary rectangular treemap algorithms have been developed:
| Algorithm | Order | Aspect ratios | Stability |
|---|---|---|---|
| BinaryTree | partially ordered | high | stable |
| Mixed Treemaps[3] | ordered | lowest | stable |
| Ordered and Quantum[4] | partially ordered | medium | medium stability |
| Slice And Dice | ordered | very high | stable |
| Squarified[5] | unordered | lowest | medium stability |
| Strip | ordered | medium | medium stability |
Convex treemaps
Rectangular treemaps have the disadvantage that their aspect ratio might be arbitrarily high in the worst case. As a simple example, if the tree root has only two children, one with weight and one with weight , then the aspect ratio of the smaller child will be , which can be arbitrarily high. To cope with this problem, several algorithms have been proposed that use regions that are general convex polygons, not necessarily rectangular.


Convex treemaps were developed in several steps, each step improved the upper bound on the aspect ratio. The bounds are given as a function of - the total number of nodes in the tree, and - the total depth of the tree.

1. Onak and Sidiropoulos[6] proved an upper bound of .

2. De-Berg and Onak and Sidiropoulos[7] improve the upper bound to , and prove a lower bound of .


3. De-Berg and Speckmann and van-der-Weele[8] improve the upper bound to , matching the theoretical lower bound.

- For the special case where the depth is 1, they present an algorithm that uses only four classes of 45-degree-polygons (rectangles, right-angled triangles, right-angled trapezoids and 45-degree pentagons), and guarantees an aspect ratio of at most 34/7.
The latter two algorithms operate in two steps (greatly simplified for clarity):
- A. The original tree is converted to a binary tree: each node with more than two children is replaced by a sub-tree in which each node has exactly two children.
- B. Each region representing a node (starting from the root) is divided to two, using a line that keeps the angles between edges as large as possible. It is possible to prove that, if all edges of a convex polygon are separated by an angle of at least , then its aspect ratio is . It is possible to ensure that, in a tree of depth , the angle is divided by a factor of at most , hence the aspect ratio guarantee.


Orthoconvex treemaps
In convex treemaps, the aspect ratio cannot be constant - it grows with the depth of the tree. To attain a constant aspect-ratio, Orthoconvex treemaps[8] can be used. There, all regions are orthoconvex rectilinear polygons with aspect ratio at most 64; and the leaves are either rectangles with aspect ratio at most 8, or L-shapes or S-shapes with aspect ratio at most 32.
- For the special case where the depth is 1, they present an algorithm that uses only rectangles and L-shapes, and the aspect ratio is at most ; the internal nodes use only rectangles with aspect ratio at most .


Other treemaps
Voronoi Treemaps[9] - based on Voronoi diagram calculations. The algorithm is iterative and does not give any upper bound on the aspect ratio.
Jigsaw Treemaps[10] - based on the geometry of space-filling curves. They assume that the weights are integers and that their sum is a square number. The regions of the map are rectilinear polygons and highly non-ortho-convex. Their aspect ratio is guaranteed to be at most 4.
GosperMaps[11] - based on the geometry of Gosper curves. It is ordered and stable, but has a very high aspect ratio.
History
Area-based visualizations have existed for decades. For example, mosaic plots (also known as Marimekko diagrams) use rectangular tilings to show joint distributions (i.e., most commonly they are essentially stacked column plots where the columns are of different widths). The main distinguishing feature of a treemap, however, is the recursive construction that allows it to be extended to hierarchical data with any number of levels. This idea was invented by professor Ben Shneiderman at the University of Maryland Human – Computer Interaction Lab in the early 1990s. [12][2] Shneiderman and his collaborators then deepened the idea by introducing a variety of interactive techniques for filtering and adjusting treemaps.
These early treemaps all used the simple "slice-and-dice" tiling algorithm. Despite many desirable properties (it is stable, preserves ordering, and is easy to implement), the slice-and-dice method often produces tilings with many long, skinny rectangles. In 1994 Mountaz Hascoet & Michel Beaudouin-Lafon invented a "squarifying" algorithm, later popularized by Jarke van Wijk, that created tilings whose rectangles were closer to square. In 1999 Martin Wattenberg used a variation of the "squarifying" algorithm that he called "pivot and slice" to create the first Web-based treemap, the SmartMoney Map of the Market, which displayed data on hundreds of companies in the U.S. stock market. Following its launch, treemaps enjoyed a surge of interest, especially in financial contexts.
A third wave of treemap innovation came around 2004, after Marcos Weskamp created the Newsmap, a treemap that displayed news headlines. This example of a non-analytical treemap inspired many imitators, and introduced treemaps to a new, broad audience. In recent years, treemaps have made their way into the mainstream media, including usage by the New York Times.[13][14] The Treemap Art Project produced 12 framed images for the National Academies (United States), shown the Every AlgoRiThm has ART in It exhibit in Washington, DC and another set for the collection of Museum of Modern Art in New York.
See also
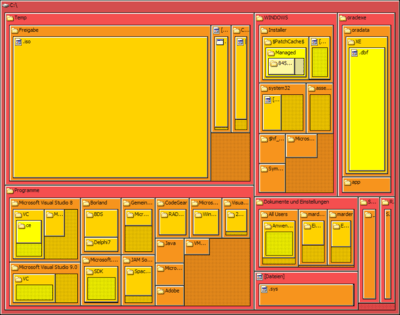
- Disk space analyzer
- Information visualization
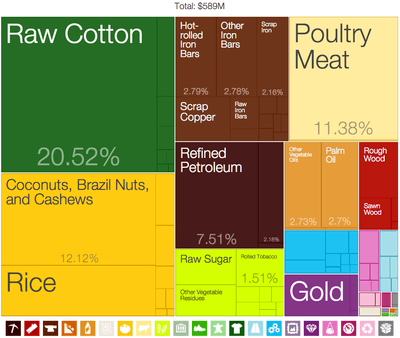
- List of countries by economic complexity, which includes a list of Products Exports Treemaps.
- Marimekko Chart, a similar concept with one level of explicit hierarchy.
References
- ↑ Kong, N; Heer, J; Agrawala, M (2010). "Perceptual Guidelines for Creating Rectangular Treemaps". IEEE Transactions on Visualization and Computer Graphics. 16 (6): 990. doi:10.1109/TVCG.2010.186. PMID 20975136.
- 1 2 Ben Shneiderman; Catherine Plaisant (June 25, 2009). "Treemaps for space-constrained visualization of hierarchies ~ Including the History of Treemap Research at the University of Maryland". Retrieved February 23, 2010.
- ↑ Roel Vliegen; Erik-Jan van der Linden; Jarke J. van Wijk. "Visualizing Business Data with Generalized Treemaps" (PDF). Archived from the original (PDF) on July 24, 2011. Retrieved February 24, 2010.
- ↑ Bederson, Benjamin B.; Shneiderman, Ben; Wattenberg, Martin (2002). "Ordered and quantum treemaps: Making effective use of 2D space to display hierarchies". ACM Transactions on Graphics. 21 (4): 833. doi:10.1145/571647.571649.
- ↑ Bruls, Mark; Huizing, Kees; van Wijk, Jarke J. (2000). "Squarified treemaps". In de Leeuw, W.; van Liere, R. Data Visualization 2000: Proc. Joint Eurographics and IEEE TCVG Symp. on Visualization (PDF). Springer-Verlag. pp. 33–42{{inconsistent citations}} .
- ↑ Krzysztof Onak; Anastasios Sidiropoulos. "Circular Partitions with Applications to Visualization and Embeddings". Retrieved June 26, 2011.
- ↑ Mark de Berg; Onak, Krzysztof; Sidiropoulos, Anastasios (2010). "Fat Polygonal Partitions with Applications to Visualization and Embeddings". arXiv:1009.1866 [cs.CG].
- 1 2 De Berg, Mark; Speckmann, Bettina; Van Der Weele, Vincent (2014). "Treemaps with bounded aspect ratio". Computational Geometry. 47 (6): 683. arXiv:1012.1749. doi:10.1016/j.comgeo.2013.12.008. . Conference version: Convex Treemaps with Bounded Aspect Ratio (PDF). EuroCG. 2011.
- ↑ Balzer, Michael; Deussen, Oliver (2005). "Voronoi Treemaps". In Stasko, John T.; Ward, Matthew O. IEEE Symposium on Information Visualization (InfoVis 2005), 23-25 October 2005, Minneapolis, MN, USA (PDF). IEEE Computer Society. p. 7. .
- ↑ Wattenberg, Martin (2005). "A Note on Space-Filling Visualizations and Space-Filling Curves". In Stasko, John T.; Ward, Matthew O. IEEE Symposium on Information Visualization (InfoVis 2005), 23-25 October 2005, Minneapolis, MN, USA (PDF). IEEE Computer Society. p. 24. .
- ↑ Auber, David; Huet, Charles; Lambert, Antoine; Renoust, Benjamin; Sallaberry, Arnaud; Saulnier, Agnes (2013). "Gosper Map: Using a Gosper Curve for laying out hierarchical data". IEEE Transactions on Visualization and Computer Graphics. 19 (11): 1820–1832. doi:10.1109/TVCG.2013.91. PMID 24029903. .
- ↑ Shneiderman, Ben (1992). "Tree visualization with tree-maps: 2-d space-filling approach". ACM Transactions on Graphics. 11: 92. doi:10.1145/102377.115768.
- ↑ Cox, Amanda; Fairfield, Hannah (February 25, 2007). "The health of the car, van, SUV, and truck market". The New York Times. Retrieved March 12, 2010.
- ↑ Carter, Shan; Cox, Amanda (February 14, 2011). "Obama's 2012 Budget Proposal: How $3.7 Trillion is Spent". The New York Times. Retrieved February 15, 2011.
External links
| Wikimedia Commons has media related to Treemaps. |
- Treemap Art Project produced exhibit for the National Academies in Washington, DC
- An article by Ben Shneiderman on the use of treemaps (as a guest on www.perceptualedge.com )
- Comprehensive survey and bibliography of Tree Visualization techniques
- Generalized treemaps
- History of Treemaps by Ben Shneiderman.
- Hypermedia exploration with interactive dynamic maps Paper by Zizi and Beaudouin-Lafon introducing the squarified treemap layout algorithm (named "improved treemap layout" at the time).
- Indiana University description
- Live interactive treemap based on crowd-sourced discounted deals from Flytail Group
- Treemap sample in English from The Hive Group
- Several treemap examples made with Macrofocus TreeMap
- Visualizations using dynamic treemaps and treemapping software by drasticdata
- Product Exports Treemaps developed by the Harvard-MIT Observartory of Economic Complexity
- newsmap.jp is a treemap of Google news stories