United States presidential election in Illinois, 2008
|
| ||||||||||||||||||||||||||
| ||||||||||||||||||||||||||
| ||||||||||||||||||||||||||
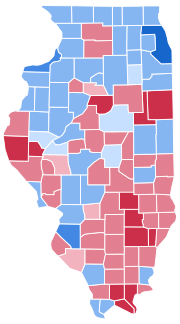 County Results
| ||||||||||||||||||||||||||
| ||||||||||||||||||||||||||
| Elections in Illinois | ||||||||
|---|---|---|---|---|---|---|---|---|
 | ||||||||
|
||||||||
|
||||||||
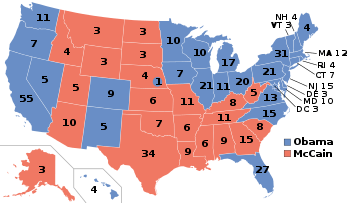
The 2008 United States presidential election in Illinois took place on November 4, 2008, and was part of the 2008 United States presidential election. Voters chose 21 representatives, or electors to the Electoral College, who voted for president and vice president.
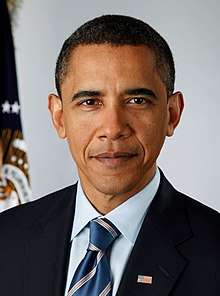
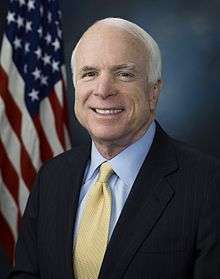
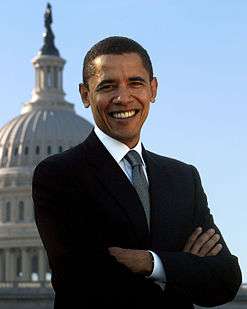
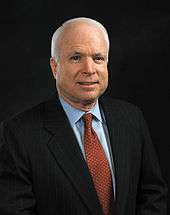
Barack Obama won the race in his home state with a 25.1 percent margin of victory. Prior to the election, every major news organization considered this a state Obama would win, or otherwise considered as a safe blue state. One of the most reliably blue states in the nation, Illinois has not voted for a Republican presidential nominee since 1988, when George H.W. Bush narrowly carried the state. In 2008, continuing that trend, it appeared that a generic Democratic presidential nominee could have easily won Illinois. Thus, it surprised no one that Barack Obama, who represented Illinois in the U.S. Senate, won Illinois in 2008 over Republican John McCain in a landslide victory, clinching near 62 percent of the total vote.
As of the 2016 presidential election, this is the last time a Democrat won the following counties: Boone, Bureau, Cass, Calhoun, Coles, Gallatin, Grundy, Kankakee, Kendall, LaSalle, Macon, Macoupin, Madison, Mason, McDonough, McHenry, McLean, Montgomery, Pulaski, Sangamon, Schuyler, Stephenson, and Vermillion.
Democratic primary
|
| |||||||||||||||||||
| |||||||||||||||||||
| |||||||||||||||||||
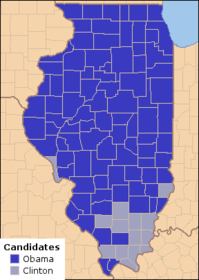 Results of the Illinois Democratic Primary by County. Dark blue counties were won by Obama; gray counties were won by Clinton. | |||||||||||||||||||

| Elections in Illinois | ||||||||
|---|---|---|---|---|---|---|---|---|
| ||||||||
|
||||||||
|
||||||||
The Illinois Democratic Presidential Primary took place on Super Tuesday, February 5, 2008, with 153 delegates at stake. The winner in each of Illinois's 19 congressional districts was awarded all of that district's delegates, totaling 100. Another 53 delegates were awarded to the statewide winner, Barack Obama. The 153 delegates represented Illinois at the Democratic National Convention in Denver, Colorado. Thirty-two other unpledged delegates, known as superdelegates, also attended the convention and cast their votes as well.
Polls
Polls indicated that then-U.S. Senator Barack Obama was leading then-U.S. Senator Hillary Clinton by double digits in the days before the contest in his home state of Illinois.[1]
Results
| Illinois Democratic Presidential Primary Results – 2008 | ||||||
|---|---|---|---|---|---|---|
| Party | Candidate | Votes | Percentage | Delegates | ||
| Democratic | Barack Obama | 1,318,234 | 64.66% | 104 | ||
| Democratic | Hillary Clinton | 667,930 | 32.76% | 49 | ||
| Democratic | John Edwards | 39,719 | 1.95% | 0 | ||
| Democratic | Dennis Kucinich | 4,234 | 0.21% | 0 | ||
| Democratic | Joe Biden | 3,788 | 0.19% | 0 | ||
| Democratic | Bill Richardson | 3,538 | 0.17% | 0 | ||
| Democratic | Christopher Dodd | 1,171 | 0.06% | 0 | ||
| Totals | 2,038,614 | 100.00% | 153 | |||
| Voter turnout | % | — | ||||
Chicago Public Radio reported on March 13, 2008, that the delegate counts were recalculated and Obama won 106 delegates to 47 for Clinton.[2]
During the state by state roll-call at the Democratic National Convention, the Illinois delegation declined to cast their votes.[3]
Analysis
It was no surprise that Barack Obama cruised to a landslide victory in Illinois, the state he had represented in the U.S. Senate since 2005. He enjoyed massive support in his state among all demographics. According to exit polls, 57 percent of voters in the Illinois Democratic Primary were Caucasian and they opted for Obama 57-41; 24 percent of voters were African American and they, too, backed Obama 93-5; and 17 percent of voters in the primary were Hispanic/Latino and they narrowly backed Obama 50-49. Obama won all age groups but tied Clinton among senior citizens aged 65 and over. He won all voters in the state of all educational attainment levels as well as income/socioeconomic classes. He won all ideological groups and voters from both parties as well as self-identified Independents. Regarding religion, Obama won every major denomination except Roman Catholics, who narrowly backed Clinton 50-48 percent. Obama won Protestants by a margin of 58-38, other Christians 79-19, other religions 82-17, and atheists/agnostics 78-21.
Obama performed extremely well statewide and racked up massive victories in his home city of Chicago as well as its suburbs and the metropolitan area. He also won Northern Illinois as well as the collar counties by substantial victories. Clinton’s best performance was in Southern Illinois among the more rural and conservative counties that are majority white, although Obama still won the region as a whole.
Republican primary
|
| |||||||||||||||||||||||||||||
| |||||||||||||||||||||||||||||
| |||||||||||||||||||||||||||||
 | |||||||||||||||||||||||||||||

The Illinois Republican primary, 2008 was held on February 5, 2008. Illinois was one of 24 States holding a primary or caucus on Super Tuesday. Delegates from each of Illinois' 19 congressional districts are selected by direct election. In addition, the primary ballot also contains a preference poll that lists the presidential candidates.
| Candidate | Votes | Percentage | Delegates |
|---|---|---|---|
| John McCain | 426,777 | 47.45% | 54 |
| Mitt Romney | 257,265 | 28.60% | 3 |
| Mike Huckabee | 148,053 | 16.46% | 0 |
| Ron Paul | 45,055 | 5.01% | 0 |
| Rudy Giuliani* | 11,837 | 1.32% | 0 |
| Fred Thompson* | 7,259 | 0.81% | 0 |
| Alan Keyes | 2,318 | 0.26% | 0 |
| Jim Mitchell, Jr. | 483 | 0.05% | 0 |
| Tom Tancredo* | 375 | 0.04% | 0 |
| Total | 899,422 | 100% | 57 |
*Candidate withdrew prior to the primary
Green Party primary
|
| |||||||||||||||||||||||||||||||||||
| |||||||||||||||||||||||||||||||||||
| |||||||||||||||||||||||||||||||||||


The Illinois chapter of the Green Party held a presidential primary on February 5.
_(cropped).jpg)
| Illinois Green Party presidential primary, February 5, 2008[6] | |||
|---|---|---|---|
| Candidate | Votes | Percentage | National delegates |
| Cynthia McKinney | - | 56.62% | - |
| Howie Hawkins | 17.37% | - | |
| Kent Mesplay | - | 14.37% | - |
| Jared A. Ball | - | 11.64% | - |
| Total | - | 100% | - |
General election campaign
Predictions
There were 17 news organizations who made state-by-state predictions of the election. Here are their last predictions before election day:
- D.C. Political Report: Democrat[7]
- Cook Political Report: Solid Democrat[8]
- Takeaway: Solid Obama[9]
- Election Projection: Solid Obama[10]
- Electoral-vote.com: Strong Democrat[11]
- Washington Post: Solid Obama[12]
- Politico: Solid Obama[13]
- Real Clear Politics: Solid Obama[14]
- FiveThirtyEight.com: Solid Obama[12]
- CQ Politics: Safe Democrat[15]
- New York Times: Solid Democrat[16]
- CNN: Safe Democrat[17]
- NPR: Solid Obama[12]
- MSNBC: Solid Obama[12]
- Fox News: Democrat[18]
- Associated Press: Democrat[19]
- Rasmussen Reports: Safe Democrat[20]
Polling
Obama won every single pre-election poll, and each by a double-digit margin and with at least 52% (with the exception of an ARG poll). The final 3 polls averaged Obama leading 60% to 35%.[21]
Fundraising
Obama raised $35,307,625. McCain raised $7,207,428.[22]
Advertising and visits
Obama spent $23,319. McCain and interest groups spent $52,865.[23] The Democratic ticket visited the state 13 times. McCain's ticket visited the state twice.[24]
Analysis
For most of the second half of the 20th century, Illinois was reckoned as a Republican-leaning swing state. It voted Republican in every election from 1952 to 1988, save for 1960 and 1964. However, George H. W. Bush just barely won the state in 1988, and it swung heavily to Bill Clinton and the Democrats in 1992. Since then, Democrats have won the state by fairly comfortable margins, and it is now reckoned as the most solidly Democratic state in the Midwest.
The blue trend in the Land of Lincoln in presidential elections can be largely attributed to Cook County, home to Chicago, which makes up about 41.2% of the state's total population.[25] While Chicago has been a Democratic stronghold for decades, the suburban areas of Cook County have historically tilted Republican. The brand of Republicanism in the suburbs, however, has historically been a moderate one, and these areas swung Democratic as the national party moved more to the right. Democrats also do very well in the Illinois portions of the Quad Cities and St. Louis areas. Additionally, the historically Republican collar counties near Chicago – DuPage, Lake, McHenry, Kane, and Will – have become friendlier to Democrats at the national level.
Barack Obama, the junior U.S. Senator from Illinois at the time of the election, carried the state handily, defeating John McCain of Arizona by a margin of 1.38 million votes. Obama carried his home county, Cook County, with roughly 76 percent of the vote, the highest percentage of any presidential candidate since its incorporation in 1831. He also swept all five collar counties, becoming the first Democratic candidate since Franklin Pierce in 1852 to so, with DuPage, Kendall, Lake and Will giving him double-digit margins. Notably, DuPage and McHenry had not supported a Democrat for president since that election.[26]
Obama also did very well in several rural counties that historically voted Republican. He became the first Democrat to win Carroll County since that county was created in 1839, in the process breaking the last remaining Republican streak stretching from initial GOP candidate John C. Frémont in the 1856 election, and the first Democrat to win Boone County since James K. Polk in 1844. McCain did, however, win several of the more rural counties in Southern Illinois. It was not nearly enough, however, to put a serious dent in Obama’s 25-point margin in the state.[27]
During the same election, senior U.S. Senator and Senate Majority Whip Dick Durbin, a Democrat, was reelected to the U.S. Senate with 67.84% of the vote over Republican Dr. Steve Sauerberg who received 28.53%. At the state level, Democrats picked up three seats in the Illinois House of Representatives.
As of the 2016 presidential election, this is the last presidential election that a Democrat won all of Chicago's collar counties.
Results
| United States presidential election in Illinois, 2008 | ||||||
|---|---|---|---|---|---|---|
| Party | Candidate | Running mate | Votes | Percentage | Electoral votes | |
| Democratic | Barack Obama | Joe Biden | 3,419,348 | 61.85% | 21 | |
| Republican | John McCain | Sarah Palin | 2,031,179 | 36.74% | 0 | |
| Independent | Ralph Nader | Matt Gonzalez | 31,152 | 0.56% | 0 | |
| Libertarian | Bob Barr | Wayne Allyn Root | 19,642 | 0.36% | 0 | |
| Green | Cynthia McKinney | Rosa Clemente | 11,838 | 0.21% | 0 | |
| Constitution | Chuck Baldwin | Darrell Castle | 8,256 | 0.15% | 0 | |
| Write-Ins | Write-ins | 7,084 | 0.13% | 0 | ||
| Totals | 5,528,499 | 100.00% | 21 | |||
| Voter turnout | 58.1% | |||||
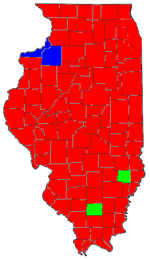
By county
| County | Obama% | Obama# | McCain% | McCain# |
|---|---|---|---|---|
| Adams | 38% | 11,700 | 61% | 18,592 |
| Alexander | 56% | 2,189 | 43% | 1,692 |
| Bond | 48% | 3,832 | 50% | 3,938 |
| Boone | 51% | 11,324 | 47% | 10,396 |
| Brown | 38% | 985 | 60% | 1,541 |
| Bureau | 52% | 8,872 | 46% | 7,902 |
| Calhoun | 53% | 1,421 | 45% | 1,221 |
| Carroll | 52% | 3,956 | 47% | 3,589 |
| Cass | 50% | 2,690 | 48% | 2,617 |
| Champaign | 58% | 48,351 | 40% | 33,748 |
| Christian | 46% | 6,912 | 52% | 7,869 |
| Clark | 45% | 3,737 | 53% | 4,406 |
| Clay | 38% | 2,423 | 61% | 3,924 |
| Clinton | 44% | 7,653 | 54% | 9,348 |
| Coles | 51% | 11,704 | 48% | 10,962 |
| Cook | 76% | 1,608,870 | 23% | 482,395 |
| Crawford | 43% | 3,877 | 56% | 5,067 |
| Cumberland | 39% | 2,052 | 59% | 3,155 |
| DeKalb | 58% | 25,765 | 41% | 18,260 |
| DeWitt | 42% | 3,299 | 56% | 4,345 |
| Douglas | 39% | 3,226 | 60% | 5,001 |
| DuPage | 55% | 227,416 | 44% | 182,860 |
| Edgar | 45% | 3,737 | 53% | 4,393 |
| Edwards | 34% | 1,140 | 64% | 2,136 |
| Effingham | 31% | 5,256 | 67% | 11,313 |
| Fayette | 41% | 3,963 | 57% | 5,493 |
| Ford | 35% | 2,226 | 64% | 4,075 |
| Franklin | 48% | 8,873 | 50% | 9,390 |
| Fulton | 60% | 9,722 | 38% | 6,244 |
| Gallatin | 56% | 1,587 | 42% | 1,211 |
| Greene | 45% | 2,617 | 53% | 3,048 |
| Grundy | 49% | 9,134 | 49% | 9,144 |
| Hamilton | 42% | 1,794 | 55% | 2,353 |
| Hancock | 43% | 3,753 | 55% | 4,778 |
| Hardin | 40% | 892 | 59% | 1,330 |
| Henderson | 58% | 2,213 | 40% | 1,540 |
| Henry | 53% | 13,177 | 45% | 11,247 |
| Iroquois | 34% | 4,640 | 64% | 8,686 |
| Jackson | 60% | 15,199 | 38% | 9,665 |
| Jasper | 40% | 2,063 | 58% | 2,963 |
| Jefferson | 44% | 7,460 | 54% | 9,293 |
| Jersey | 48% | 5,036 | 50% | 5,320 |
| JoDaviess | 54% | 6,392 | 44% | 5,163 |
| Johnson | 31% | 1,477 | 67% | 3,138 |
| Kane | 55% | 105,592 | 44% | 84,223 |
| Kankakee | 52% | 24,719 | 47% | 22,508 |
| Kendall | 53% | 23,529 | 46% | 20,675 |
| Knox | 59% | 14,165 | 39% | 9,396 |
| Lake | 56% | 111,051 | 43% | 85,284 |
| LaSalle | 55% | 27,415 | 44% | 21,855 |
| Lawrence | 46% | 3,013 | 52% | 3,401 |
| Lee | 48% | 7,757 | 51% | 8,243 |
| Livingston | 40% | 6,184 | 59% | 9,180 |
| Logan | 41% | 5,245 | 58% | 7,424 |
| Macon | 50% | 25,419 | 49% | 24,901 |
| Macoupin | 54% | 12,071 | 44% | 9,879 |
| Madison | 54% | 68,836 | 45% | 57,059 |
| Marion | 48% | 8,334 | 50% | 8,687 |
| Marshall | 49% | 3,078 | 50% | 3,142 |
| Mason | 52% | 3,540 | 46% | 3,139 |
| Massac | 37% | 2,693 | 61% | 4,371 |
| McDonough | 52% | 6,780 | 46% | 6,047 |
| McHenry | 52% | 71,976 | 47% | 64,595 |
| McLean | 50% | 37,551 | 49% | 36,657 |
| Menard | 42% | 2,704 | 57% | 3,672 |
| Mercer | 55% | 4,885 | 43% | 3,830 |
| Monroe | 44% | 7,943 | 55% | 9,870 |
| Montgomery | 50% | 6,486 | 48% | 6,141 |
| Morgan | 49% | 7,458 | 49% | 7,585 |
| Moultrie | 43% | 2,663 | 55% | 3,466 |
| Ogle | 45% | 11,247 | 53% | 13,131 |
| Peoria | 56% | 44,396 | 42% | 33,018 |
| Perry | 47% | 4,697 | 51% | 5,077 |
| Piatt | 43% | 3,856 | 55% | 4,988 |
| Pike | 40% | 3,021 | 59% | 4,451 |
| Pope | 38% | 842 | 60% | 1,339 |
| Pulaski | 50% | 1,636 | 49% | 1,592 |
| Putnam | 57% | 1,900 | 41% | 1,376 |
| Randolph | 49% | 7,387 | 50% | 7,536 |
| Richland | 42% | 3,177 | 57% | 4,320 |
| Rock Island | 62% | 42,175 | 37% | 25,338 |
| Saline | 44% | 5,082 | 53% | 6,096 |
| Sangamon | 51% | 51,176 | 47% | 46,857 |
| Schuyler | 50% | 1,896 | 48% | 1,830 |
| Scott | 42% | 1,090 | 56% | 1,453 |
| Shelby | 39% | 4,236 | 59% | 6,390 |
| St. Clair | 62% | 77,896 | 37% | 47,005 |
| Stark | 47% | 1,357 | 52% | 1,513 |
| Stephenson | 52% | 11,010 | 46% | 9,686 |
| Tazewell | 46% | 29,335 | 52% | 33,203 |
| Union | 43% | 3,916 | 55% | 4,999 |
| Vermilion | 49% | 16,228 | 49% | 16,046 |
| Wabash | 43% | 2,462 | 56% | 3,252 |
| Warren | 53% | 4,286 | 45% | 3,637 |
| Washington | 42% | 3,338 | 56% | 4,468 |
| Wayne | 32% | 2,545 | 67% | 5,381 |
| White | 44% | 3,315 | 53% | 3,985 |
| Whiteside | 58% | 15,587 | 40% | 10,867 |
| Will | 56% | 154,691 | 43% | 119,049 |
| Williamson | 42% | 12,893 | 56% | 17,351 |
| Winnebago | 55% | 69,903 | 43% | 53,806 |
| Woodford | 36% | 6,969 | 63% | 12,137 |
By congressional district
Favorite son Barack Obama won 16 of the state’s 19 congressional districts, including all districts held by Democrats and four districts held by Republicans.
| District | McCain | Obama | Representative |
|---|---|---|---|
| 1st | 12.93% | 86.53% | Bobby Rush |
| 2nd | 9.86% | 89.68% | Jesse Jackson Jr. |
| 3rd | 35.08% | 63.60% | Dan Lipinski |
| 4th | 13.22% | 85.44% | Luis Gutierrez |
| 5th | 26.22% | 72.82% | Rahm Emanuel (110th Congress) |
| Mike Quigley (111th Congress) | |||
| 6th | 42.76% | 55.91% | Peter Roskam |
| 7th | 11.57% | 87.77% | Danny K. Davis |
| 8th | 42.86% | 55.74% | Melissa Bean |
| 9th | 26.43% | 72.34% | Jan Schakowsky |
| 10th | 38.13% | 60.92% | Mark Kirk |
| 11th | 45.14% | 53.32% | Jerry Weller (110th Congress) |
| Debbie Halvorson (111th Congress) | |||
| 12th | 42.89% | 55.49% | Jerry Costello |
| 13th | 44.60% | 54.21% | Judy Biggert |
| 14th | 43.77% | 54.83% | Dennis Hastert (110th Congress) |
| Bill Foster (111th Congress) | |||
| 15th | 50.43% | 47.82% | Timothy V. Johnson |
| 16th | 45.52% | 52.78% | Donald Manzullo |
| 17th | 42.15% | 56.39% | Philip Hare |
| 18th | 50.03% | 48.32% | Ray LaHood (110th Congress) |
| Aaron Schock (111th Congress) | |||
| 19th | 54.25% | 43.98% | John Shimkus |
Electors
Technically the voters of Illinois cast their ballots for electors: representatives to the Electoral College. Illinois is allocated 21 electors because it has 19 congressional districts and 2 senators. All candidates who appear on the ballot or qualify to receive write-in votes must submit a list of 21 electors, who pledge to vote for their candidate and his or her running mate. Whoever wins the majority of votes in the state is awarded all 21 electoral votes. Their chosen electors then vote for president and vice president. Although electors are pledged to their candidate and running mate, they are not obligated to vote for them.[28] An elector who votes for someone other than his or her candidate is known as a faithless elector.
The electors of each state and the District of Columbia met on December 15, 2008, to cast their votes for president and vice president. The Electoral College itself never meets as one body. Instead the electors from each state and the District of Columbia met in their respective capitols.
The following were the members of the Electoral College from the state. All 21 were pledged to Barack Obama and Joe Biden:[29]
- Constance A. Howard
- Carrie Austin
- Shirley R. Madigan
- Ricardo Muñoz
- James DeLeo
- Marge Friedman
- Vera Davis
- Nancy Shepardson
- William Marovitz
- Lauren Beth Gash
- Debbie Halvorson
- Molly McKenzie
- Julia Kennedy Beckman
- Mark Guethle
- Lynn Foster
- John M. Nelson
- Mary Boland
- Shirley McCombs
- Don Johnston
- Barbara Flynn Currie
- John P. Daley
See also
References
- ↑ "Illinois Democratic Primary". Real Clear Politics. Retrieved 2008-02-04.
- ↑ "Clinton Loses Two Illinois Delegates". Chicago Public Radio (WBEZ). Archived from the original on 2008-03-14. Retrieved 2008-04-02.
- ↑ "Roll Call Vote - 27 August 2008".
- ↑ "General Primary - 2/5/2008". 2008-02-05. Archived from the original on 2008-10-06. Retrieved 2008-05-24.
- ↑ "Illinois Republican Delegation 2008". Retrieved 2009-07-05.
- ↑ "Major Third Party 2008 Presidential Primary". www.thegreenpapers.com. The Green Papers. 2008. Retrieved February 25, 2017.
- ↑ D.C.'s Political Report: The complete source for campaign summaries
- ↑ Presidential | The Cook Political Report Archived May 5, 2015, at the Wayback Machine.
- ↑ Adnaan (2008-09-20). "Track the Electoral College vote predictions". The Takeaway. Archived from the original on April 22, 2009. Retrieved 2009-11-14.
- ↑ Election Projection: 2008 Elections - Polls, Projections, Results
- ↑ Electoral-vote.com: President, Senate, House Updated Daily
- 1 2 3 4 Based on Takeaway
- ↑ POLITICO's 2008 Swing State Map - POLITICO.com
- ↑ RealClearPolitics - Electoral Map
- ↑ CQ Politics | CQ Presidential Election Maps, 2008 Archived June 14, 2009, at the Wayback Machine.
- ↑ "Electoral College Map". The New York Times. Retrieved 2010-05-26.
- ↑ "October – 2008 – CNN Political Ticker - CNN.com Blogs". CNN. Retrieved 2010-05-26.
- ↑ "Winning the Electoral College". Fox News. 2010-04-27.
- ↑ roadto270
- ↑ Election 2008: Electoral College Update - Rasmussen Reports™
- ↑ Election 2008 Polls - Dave Leip's Atlas of U.S. Presidential Elections
- ↑ Presidential Campaign Finance
- ↑ "Map: Campaign Ad Spending - Election Center 2008 from CNN.com". CNN. Retrieved 2010-05-26.
- ↑ "Map: Campaign Candidate Visits - Election Center 2008 from CNN.com". CNN. Retrieved 2010-05-26.
- ↑ "Cook County QuickFacts from the US Census Bureau". Retrieved 2008-12-13.
- ↑ Todd, Chuck and Gawiser, Sheldon. How Barack Obama Won. New York City: Vintage, 2009.
- ↑ "Illinois State Board of Elections - 2008 General Election - Comma delimited text". Retrieved 2008-12-01.
- ↑ "Electoral College". California Secretary of State. Archived from the original on October 30, 2008. Retrieved 2008-11-01.
- ↑ U. S. Electoral College 2008 Election - Certificates