United States presidential election in Maryland, 2016
|
|
|
| Turnout |
71.98%  |
|---|
|
|

|
Clinton
40-50%
50-60%
60-70%
70-80%
80-90%
|
Trump
40-50%
50-60%
60-70%
70-80%
|
|
|

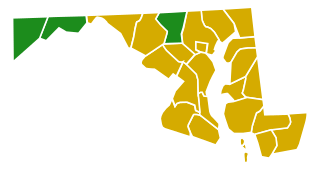
Treemap of the popular vote by county.
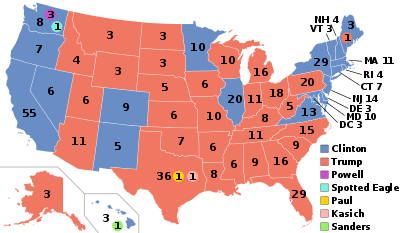
The 2016 United States presidential election in Maryland was held on November 8, 2016, as part of the 2016 General Election in which all 50 states plus The District of Columbia participated. Maryland voters chose electors to represent them in the Electoral College via a popular vote pitting the Republican Party's nominee, businessman Donald Trump, and running mate Indiana Governor Mike Pence against Democratic Party nominee, former Secretary of State Hillary Clinton and her running mate, Virginia Senator Tim Kaine.
On April 26, 2016,[1] in the presidential primaries, Maryland voters expressed their preferences for the Democratic, and Republican parties' respective nominees for president. Registered members of each party only voted in their party's primary, while voters who were unaffiliated only voted in nonpartisan primary elections (e.g. School Board).[2]
Hillary Clinton won Maryland with 60.3% of the vote. Donald Trump received 33.9% of the vote.[3] Maryland was among the eleven states in which Clinton improved on Barack Obama's 2012 performance, winning by a larger margin than any presidential candidate since 1964. [4] Maryland was one of four states in which Clinton received over 60% of the vote, the others being Massachusetts, Hawaii and California. Clinton continued the tradition of Democratic dominance in the state of Maryland, capturing large majorities of the vote in the densely populated and heavily nonwhite Democratic Baltimore–Washington metropolitan area, while Trump easily outperformed her in more white, sparsely-populated regions elsewhere in the state that tend to vote Republican. Clinton became the first Democrat to win Anne Arundel County since Lyndon B. Johnson in 1964.
Background
The incumbent President of the United States, Barack Obama, a Democrat and former U.S. Senator from Illinois, was first elected president in the 2008 election, running with former Senator Joe Biden of Delaware. Defeating the Republican nominee, Senator John McCain of Arizona, with 52.9% of the popular vote and 68% of the electoral vote,[5][6] Obama succeeded two-term Republican President George W. Bush, the former Governor of Texas. Obama and Biden were reelected in the 2012 presidential election, defeating former Massachusetts Governor Mitt Romney with 51.1% of the popular vote and 61.7% of electoral votes.[7] Although Barack Obama's approval rating in the RealClearPolitics poll tracking average remained between 40 and 50 percent for most of his second term, it has experienced a surge in early 2016 and reached its highest point since 2012 during June of that year.[8][9] Analyst Nate Cohn has noted that a strong approval rating for Barack Obama would equate to a strong performance for the Democratic candidate, and vice versa.[10]
Following his second term, President Barack Obama is not eligible for another reelection. In October 2015, Obama's running-mate and two-term Vice President Joe Biden decided not to enter the race for the Democratic presidential nomination either.[11] With their terms expiring on January 20, 2017, the electorate is asked to elect a new president, the 45th president and 48th vice president of the United States, respectively.
General election
By county
| County |
Trump% |
Trump# |
Clinton% |
Clinton# |
Others% |
Other# |
Totals# |
| Allegany | 67.40 | 21,270 | 25.70 | 7,875 | 4.90 | 1,509 | 30,654 |
| Anne Arundel | 45.78 | 118,636 | 49.22 | 122,385 | 7.00 | 18,135 | 259,156 |
| Baltimore (City) | 10.70 | 24,225 | 84.44 | 190,981 | 4.86 | 10,955 | 226,161 |
| Baltimore (County) | 38.62 | 146,469 | 55.58 | 210,771 | 5.80 | 22,013 | 379,253 |
| Calvert | 55.22 | 26,176 | 38.44 | 18,225 | 6.34 | 3,006 | 47,407 |
| Caroline | 66.95 | 9,368 | 28.65 | 4,009 | 4.40 | 615 | 13,992 |
| Carroll | 64.57 | 57,385 | 28.97 | 25,749 | 6.46 | 5,737 | 88,871 |
| Cecil | 62.56 | 28,866 | 29.58 | 13,650 | 7.86 | 3,626 | 46,142 |
| Charles | 32.90 | 25,529 | 63.20 | 49,035 | 3.90 | 2,984 | 77,548 |
| Dorchester | 53.30 | 8,413 | 39.55 | 6,245 | 7.15 | 1,132 | 15,790 |
| Frederick | 47.54 | 58,502 | 44.78 | 55,109 | 7.68 | 9,444 | 123,055 |
| Garrett | 76.91 | 10,775 | 18.32 | 2,566 | 4.77 | 668 | 14,009 |
| Harford | 58.42 | 77,443 | 35.12 | 46,553 | 6.46 | 8,574 | 132,570 |
| Howard | 29.28 | 47,484 | 63.26 | 102,597 | 7.46 | 12,112 | 162,193 |
| Kent | 48.66 | 4,876 | 45.66 | 4,575 | 5.68 | 570 | 10,021 |
| Montgomery | 19.70 | 87,337 | 74.51 | 330,366 | 5.79 | 25,668 | 443,371 |
| Prince George's | 8.42 | 30,998 | 88.17 | 324,411 | 3.41 | 12,513 | 367,922 |
| Queen Anne's | 64.07 | 16,993 | 30.60 | 7,973 | 5.33 | 1,557 | 26,523 |
| St. Mary's | 57.59 | 28,482 | 35.14 | 17,381 | 7.27 | 3,597 | 49,460 |
| Somerset | 53.98 | 5,341 | 42.41 | 4,196 | 3.61 | 357 | 9,894 |
| Talbot | 52.68 | 10,487 | 41.67 | 8,294 | 5.65 | 1,125 | 19,906 |
| Washington | 62.13 | 40,998 | 32.02 | 21,129 | 5.85 | 3,864 | 65,991 |
| Wicomico | 52.40 | 21,994 | 42.20 | 17,727 | 5.40 | 2,256 | 41,977 |
| Worcester | 61.25 | 16,890 | 34.21 | 9,435 | 4.54 | 1,252 | 27,577 |
By congressional district
Clinton won 7 of the state's 8 congressional districts. [12]
Counties that swung from Democratic to Republican
Counties that swung from Republican to Democratic
Primary elections
Democratic primary
Election results by county.
Hillary Clinton
Bernie Sanders
| Maryland Democratic primary, April 26, 2016 |
| Candidate |
Popular vote |
Estimated delegates |
| Count |
Percentage |
Pledged |
Unpledged |
Total |
| Hillary Clinton |
573,242 |
62.53% |
60 |
17 |
77 |
| Bernie Sanders |
309,990 |
33.81% |
35 |
1 |
36 |
| Rocky De La Fuente |
3,582 |
0.39% |
N/A |
| Uncommitted |
29,949 |
3.27% |
0 |
6 |
6 |
| Total |
916,763 |
100% |
95 |
24 |
119 |
Source: The Green Papers, Maryland State Board of Elections - Official Primary Results,
MDP Announces DNC Delegates, Alternates and State DNC Members,
MDP Announces District-Level Delegate Winners |
Republican primary

Election results by county.
Donald Trump
| Maryland Republican primary, April 26, 2016 |
| Candidate |
Votes |
Percentage |
Actual delegate count |
| Bound |
Unbound |
Total |
 Donald Trump Donald Trump |
248,343 |
54.10% |
38 |
0 |
38 |
| John Kasich |
106,614 |
23.22% |
0 |
0 |
0 |
| Ted Cruz |
87,093 |
18.97% |
0 |
0 |
0 |
| Ben Carson (withdrawn) |
5,946 |
1.30% |
0 |
0 |
0 |
| Marco Rubio (withdrawn) |
3,201 |
0.70% |
0 |
0 |
0 |
| Jeb Bush (withdrawn) |
2,770 |
0.60% |
0 |
0 |
0 |
| Rand Paul (withdrawn) |
1,533 |
0.33% |
0 |
0 |
0 |
| Chris Christie (withdrawn) |
1,239 |
0.27% |
0 |
0 |
0 |
| Carly Fiorina (withdrawn) |
1,012 |
0.22% |
0 |
0 |
0 |
| Mike Huckabee (withdrawn) |
837 |
0.18% |
0 |
0 |
0 |
| Rick Santorum (withdrawn) |
478 |
0.10% |
0 |
0 |
0 |
| Unprojected delegates: |
0 |
0 |
0 |
| Total: |
459,066 |
100.00% |
38 |
0 |
38 |
| Source: The Green Papers |
External links
|
|---|
|
| Republican Party | |
|---|
| Democratic Party | |
|---|
| Libertarian Party | |
|---|
| Green Party | |
|---|
| Constitution Party | |
|---|
| Independent | |
|---|
|
|
|---|
| Election timelines | |
|---|
| National polling | |
|---|
| State polling | |
|---|
| Fundraising | |
|---|
| Debates and forums | |
|---|
| Straw polls | |
|---|
| Major events | |
|---|
Caucuses
and primaries | |
|---|
| Results breakdown | |
|---|
National
conventions | |
|---|
| Reforms | |
|---|

.jpg)
.svg.png)