United States presidential election in Wyoming, 2016
|
| November 8, 2016 (2016-11-08) |
|
| Turnout |
57.9%  [1] [1] |
|---|
|
|
 County Results
|
Trump
40-50%
60-70%
70-80%
80-90%
|
Clinton
50-60%
|
|
 Results by county showing number of votes by size and candidates by color |
|

Treemap of the popular vote by county.
| Elections in Wyoming |
|---|
 |
|
|
|
General elections |
|---|
|
|
|
Gubernatorial elections |
|---|
|
|
|
Secretary of State elections |
|---|
|
|
|
State Senate elections |
|---|
|
|
|
|
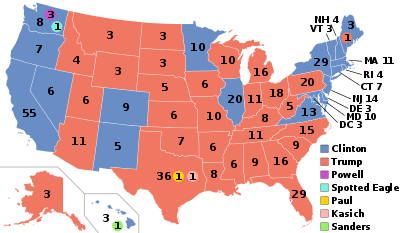
The 2016 United States presidential election in Wyoming was held on November 8, 2016, as part of the 2016 General Election in which all 50 states plus The District of Columbia participated. Wyoming voters chose electors to represent them in the Electoral College via a popular vote pitting the Republican Party's nominee, businessman Donald Trump, and running mate Indiana Governor Mike Pence against Democratic Party nominee, former Secretary of State Hillary Clinton and her running mate, Virginia Senator Tim Kaine.
On March 1 and April 9, 2016, in the presidential primaries, Wyoming voters expressed their preferences for the Democratic, Republican, Libertarian, and Constitution parties' respective nominees for president. Registered members of each party only voted in their party's primary, while voters who were unaffiliated chose any one primary in which to vote.
Donald Trump won the election in Wyoming with 67% of the vote. Hillary Clinton received 22% of the vote. Gary Johnson of the Libertarian Party received 5%.[2] Wyoming, a solidly Republican state, has not voted for a Democrat in a presidential election since it went for Lyndon B. Johnson in 1964. Trump carried every county with the exception of Teton County. His 45.8-point margin over Clinton in the state not only made it the most Republican in the 2016 presidential election,[3] but it is also the largest margin of victory by any presidential candidate in the state's history, besting Ronald Reagan's 42.3-point margin in 1984.
Background
National situation
The incumbent President of the United States, Barack Obama, a Democrat and former U.S. Senator of Illinois, was first elected president in the 2008 election, running with former Senator Joe Biden of Delaware. Defeating the Republican nominee, Senator John McCain of Arizona, with 52.9% of the popular vote and 68% of the electoral vote,[4][5] Obama succeeded two-term Republican President George W. Bush, the former Governor of Texas. Obama and Biden were reelected in the 2012 presidential election, defeating former Massachusetts Governor Mitt Romney with 51.1% of the popular vote and 61.7% of electoral votes.[6] Since the end of 2009, polling companies such as Gallup have found Obama's approval ratings to be between 40 and 50 percent.[7][8]
Following his second term, Barack Obama is not eligible for another reelection. In October 2015, Obama's running-mate and two-term Vice President Joe Biden decided not to enter the race for the Democratic presidential nomination either.[9] With their term expiring on January 20, 2017, the electorate is asked to elect a new president, the 45th president and 48th vice president of the United States, respectively.
Primary elections
Republican caucuses

Republican primary results by county.
Donald Trump
Ted Cruz
Marco Rubio
Uncommitted
| Wyoming Republican county conventions, March 12, 2016 |
| Candidate |
Votes |
Percentage |
Actual delegate count |
| Bound |
Unbound |
Total |
 Ted Cruz Ted Cruz |
1,128 |
70.94% |
9 |
0 |
9 |
| Marco Rubio |
231 |
14.53% |
1 |
0 |
1 |
| Donald Trump |
112 |
7.04% |
1 |
0 |
1 |
| John Kasich |
42 |
2.64% |
0 |
0 |
0 |
| Others |
2 |
0.13% |
0 |
0 |
0 |
| Undeclared |
75 |
4.72% |
1 |
0 |
1 |
| Unprojected delegates: |
0 |
0 |
0 |
| Total: |
1,590 |
100% |
12 |
0 |
12 |
| Source: The Green Papers and Wyoming Republican Party |
| Wyoming Republican state convention, April 14-16, 2016 |
| Candidate |
Votes |
Percentage |
Actual delegate count |
| Bound |
Unbound |
Total |
| Ted Cruz |
|
|
14 |
1 |
15 |
| (available) |
|
|
0 |
2 |
2 |
| Unprojected delegates: |
0 |
0 |
0 |
| Total: |
|
|
14 |
3 |
17 |
| Source: The Green Papers and Wyoming Republican Party |
Democratic caucuses
| Wyoming Democratic caucuses, April 9, 2016 |
| Candidate |
County delegates |
Estimated
national delegates |
| Count |
Percentage |
Pledged |
Unpledged |
Total |
| Bernie Sanders |
156 |
55.7% |
7 |
0 |
7 |
| Hillary Clinton |
124 |
44.3% |
7 |
4 |
11 |
| Uncommitted |
N/A |
– |
– |
– |
| Total |
|
100% |
14 |
4 |
18 |
| Source: The Green Papers |
General election
By congressional district
Due to the state's low population, only one congressional district is allocated. This district, called the At-Large district, because it covers the entire state, and thus is equivalent to the statewide election results.
|
Donald Trump
Republican |
Hillary Clinton
Democratic |
Gary Johnson
Libertarian |
Write Ins |
Under Votes |
Jill Stein
Green |
Darrell Castle
Constitution |
Rocky De La Fuente
Reform/ADP |
Over Votes |
Margin |
Total |
| County |
Votes |
% |
Votes |
% |
Votes |
% |
Votes |
% |
Votes |
% |
Votes |
% |
Votes |
% |
Votes |
% |
Votes |
% |
Votes |
% |
Votes |
| Albany | 7,602 | 44.08 | 6,890 | 39.95 | 1,391 | 8.07 | 637 | 3.69 | 169 | 0.98 | 344 | 1.99 | 133 | 0.77 | 63 | 0.37 | 16 | 0.09 | 712 | 4.13 | 17,245 |
| Big Horn | 4,067 | 75.23 | 604 | 11.17 | 242 | 4.48 | 236 |
4.37 | 87 | 1.61 | 35 | 0.65 | 112 | 2.07 | 21 | 0.39 | 2 |
0.04 | 3,463 | 64.06 | 5,406 |
| Campbell | 15,778 | 85.98 | 1,324 | 7.21 | 653 | 3.56 | 264 | 1.44 | 130 | 0.71 | 66 | 0.36 | 86 | 0.47 | 28 | 0.15 | 22 | 0.12 | 14,454 | 78.76 | 18,351 |
| Carbon | 4,409 | 68.24 | 1,279 | 19.80 | 381 | 5.90 | 174 | 2.69 | 79 | 1.22 | 49 | 0.76 | 61 | 0.94 | 21 | 0.33 | 8 | 0.12 | 3,130 | 48.44 | 6,461 |
| Converse | 5,520 | 82.31 | 668 | 9.96 | 251 | 3.74 | 102 | 1.52 | 47 | 0.70 | 42 | 0.63 | 51 | 0.76 | 20 | 0.30 | 5 | 0.07 | 4,852 | 72.35 | 6,706 |
| Crook | 3,348 | 86.60 | 273 | 7.06 | 118 | 3.05 | 52 | 1.35 | 37 | 0.96 | 11 | 0.28 | 18 | 0.47 | 6 | 0.16 | 3 | 0.08 | 3,075 | 79.54 | 3,866 |
| Fremont | 11,167 | 64.77 | 4,200 | 24.36 | 773 | 4.48 | 4.80 | 2.78 | 191 | 1.11 | 233 | 1.35 | 110 | 0.64 | 60 | 0.35 | 27 | 0.16 | 6,967 | 40.41 | 17,241 |
| Goshen | 4,418 | 75.14 | 924 | 15.71 | 234 | 3.98 | 88 | 1.50 | 78 | 1.33 | 45 | 0.77 | 68 | 1.16 | 19 | 0.32 | 6 | 0.10 | 3,494 | 59.42 | 5,880 |
| Hot Springs | 1,939 | 73.34 | 400 | 15.13 | 136 | 5.14 | 51 | 1.93 | 47 | 1.78 | 35 | 1.3 | 21 | 0.79 | 4 | 0.15 | 11 | 0.42 | 1,539 | 58.21 | 2,644 |
| Johnson | 3,477 | 77.75 | 638 | 14.21 | 174 | 3.89 | 68 | 1.52 | 50 | 1.12 | 33 | 0.74 | 19 | 0.42 | 8 | 0.18 | 5 | 0.11 | 2,839 | 63.48 | 4,472 |
| Laramie | 24,847 | 60.09 | 11,573 | 27.99 | 2,657 | 6.43 | 1,019 | 2.46 | 375 | 0.91 | 434 | 1.05 | 324 | 0.78 | 115 | 0.28 | 9 | 0.02 | 13,274 | 32.10 | 41,353 |
| Lincoln | 6,779 | 75.57 | 1,105 | 12.32 | 331 | 3.69 | 477 | 5.32 | 86 | 0.96 | 48 | 0.54 | 112 | 1.25 | 23 | 0.26 | 9 | 0.10 | 5,674 | 63.26 | 8,970 |
| Natrona | 23,552 | 69.85 | 6,577 | 19.51 | 1,791 | 5.31 | 818 | 2.43 | 299 | 0.89 | 310 | 0.92 | 226 | 0.67 | 74 | 0.22 | 70 | 0.21 | 16,975 | 50.35 | 33,717 |
| Niobrara | 1,116 | 83.85 | 115 | 8.64 | 49 | 3.68 | 17 | 1.28 | 16 | 1.20 | 7 | 0.53 | 7 | 0.53 | 3 | 0.23 | 1 | 0.08 | 1,001 | 75.21 | 1,331 |
| Park | 11,115 | 72.59 | 2,535 | 16.56 | 625 | 4.08 | 461 | 3.01 | 198 | 1.29 | 151 | 0.99 | 153 | 1.00 | 55 | 0.36 | 18 | 0.12 | 8,580 | 56.04 | 15,311 |
| Platte | 3,437 | 75.04 | 719 | 15.70 | 180 | 3.93 | 69 | 1.51 | 44 | 0.96 | 36 | 0.79 | 82 | 1.79 | 6 | 0.13 | 7 | 0.15 | 2,718 | 59.34 | 4,580 |
| Sheridan | 10,266 | 69.83 | 2,927 | 19.91 | 729 | 4.96 | 322 | 2.19 | 176 | 1.20 | 158 | 1.07 | 76 | 0.52 | 32 | 0.22 | 15 | 0.10 | 7,339 | 49.92 | 14,701 |
| Sublette | 3,409 | 76.74 | 644 | 14.50 | 169 | 3.80 | 93 | 2.09 | 51 | 1.15 | 28 | 0.63 | 34 | 0.77 | 13 | 0.29 | 1 | 0.02 | 2,765 | 62.25 | 4,442 |
| Sweetwater | 12,154 | 70.22 | 3,231 | 18.67 | 928 | 5.36 | 470 | 2.72 | 165 | 0.95 | 152 | 0.88 | 130 | 0.75 | 65 | 0.38 | 14 | 0.08 | 8,923 | 51.55 | 17,309 |
| Teton | 3,921 | 30.64 | 7,314 | 57.16 | ,701 | 5.48 | 449 | 3.51 | 162 | 1.27 | 172 | 1.34 | 43 | 0.34 | 27 | 0.21 | 6 | 0.05 | -3,393 | -26.52 | 12,795 |
| Uinta | 6,154 | 71.81 | 1,202 | 14.03 | 472 | 5.51 | 417 | 4.87 | 86 | 1.00 | 79 | 0.92 | 116 | 1.35 | 30 | 0.35 | 14 | 0.16 | 4,952 | 57.78 | 8,570 |
| Washakie | 2,911 | 75.32 | 532 | 13.76 | 194 | 5.02 | 99 | 2.56 | 45 | 1.16 | 37 | 0.96% | 31 | 0.80 | 10 | 0.26 | 6 | 0.16 | 2,379 | 61.55 | 3,865 |
| Weston | 3,033 | 84.91 | 299 | 8.37 | 108 | 3.02 | 41 | 1.15 | 43 | 1.20 | 10 | 0.28 | 29 | 0.81 | 6 | 0.17 | 3 | 0.08 | 2,734 | 76.54 | 3,572 |
| State Total | 174,419 | 67.40 | 55,973 | 21.63 | 13,287 | 5.13 | 6,904 | 2.67 | 2,661 | 1.03 | 2,515 | 0.97 | 2,042 | 0.79 | 709 | 0.27 | 278 | 0.11 | 118,446 | 45.77 | 258,788 |
References
- ↑ http://soswy.state.wy.us/Elections/Docs/VoterProfile.pdf
- ↑ "Wyoming Official Election Results 2016 General Election – Wyoming Secretary of State" (PDF). Retrieved November 17, 2016.
- ↑ "2016 Presidential Election Statistics". Dave Leip’s Atlas of U.S. Presidential Elections. Retrieved 2018-03-05.
- ↑ "United States House of Representatives floor summary for Jan 8, 2009". Clerk.house.gov. Retrieved January 30, 2009.
- ↑ "Federal elections 2008" (PDF). Federal Election Commission. Retrieved May 11, 2015.
- ↑ "President Map". The New York Times. November 29, 2012. Retrieved May 11, 2015.
- ↑ "Presidential Approval Ratings: Barack Obama". Gallup. Retrieved January 19, 2016.
- ↑ "Election Other – President Obama Job Approval". RealClearPolitics. Retrieved December 24, 2015.
- ↑ "Joe Biden Decides Not to Enter Presidential Race". The Wall Street Journal. Retrieved October 21, 2015.
- ↑ Jeffrey M. Jones (February 3, 2016). "Red States Outnumber Blue for First Time in Gallup Tracking". Gallup. Retrieved April 9, 2016.
External links
|
|---|
U.S.
President | |
|---|
U.S.
Senate | |
|---|
U.S.
House | |
|---|
| Governors | |
|---|
| Mayors |
- Augusta, GA
- Baltimore, MD
- Cheyenne, WY
- Fresno, CA
- Honolulu, HI
- Huntsville, AL
- Juneau, AK
- Miami-Dade County, FL
- Mesa, AZ
- Milwaukee, WI
- Portland, OR
- Richmond, VA
- Sacramento, CA
- San Diego, CA
- San Juan, PR
- Scottsdale, AZ
- Virginia Beach, VA
- Wilmington, DE
|
|---|
| States | |
|---|
.jpg)