United States presidential election in Tennessee, 2016

|
|
|
| Turnout |
61.92%  |
|---|
|
|
 County Results
|
Trump
50-60%
60-70%
70-80%
80-90%
|
Clinton
50-60%
60-70%
|
|
|

Treemap of the popular vote by county.
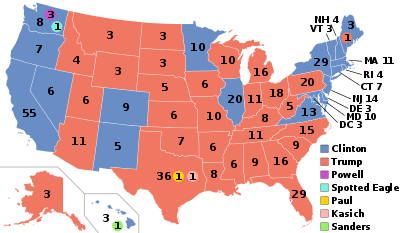
The 2016 United States presidential election in Tennessee was held on November 8, 2016, as part of the 2016 General Election in which all 50 states plus The District of Columbia participated. Tennessee voters chose electors to represent them in the Electoral College via a popular vote pitting the Republican Party's nominee, businessman Donald Trump, and running mate Indiana Governor Mike Pence against Democratic Party nominee, former Secretary of State Hillary Clinton and her running mate, Virginia Senator Tim Kaine.
On March 1, 2016, in the presidential primaries, Tennessee voters expressed their preferences for the Democratic and Republican parties' respective nominees for president. Registered members of each party only voted in their party's primary, while voters who were unaffiliated chose any one primary in which to vote.
Donald Trump won the election in Tennessee with 60.7% of the vote. Hillary Clinton received 34.7% of the vote.[1]
This is the largest margin of victory for a presidential candidate for either party since 1972 with Richard Nixon, and also the first time since that either party has earned over 60% of the vote in Tennessee.
Background
Tennessee has not voted for a Democratic presidential nominee since 1996. In 2012, Republican nominee Mitt Romney won the state by a margin of more than twenty points, due to the unpopularity of the Obama Administration in the conservative state. Typically Democrats do very well in the urban regions of Memphis and Nashville, while Republicans dominate the rural and suburban areas. Tennessee is considered a safe Republican state. In 2016, it stayed that way with Trump winning the state with 60.7% of the vote.
Primary elections
Democratic primary
- Results

Democratic primary results by county.
Bernie Sanders
Hillary Clinton
| Tennessee Democratic primary, March 1, 2016 |
| Candidate |
Popular vote |
Estimated delegates |
| Count |
Percentage |
Pledged |
Unpledged |
Total |
| Hillary Clinton |
245,930 |
66.07% |
44 |
7 |
51 |
| Bernie Sanders |
120,800 |
32.45% |
23 |
0 |
23 |
| Martin O'Malley (withdrawn) |
2,025 |
0.54% |
| | |
| Uncommitted |
3,467 |
0.93% |
0 |
1 |
1 |
| Total |
372,222 |
100% |
67 |
8 |
75 |
| Source: The Green Papers |
Republican primary

County results of the Tennessee Republican presidential primaries, 2016
Donald Trump
Marco Rubio
| Tennessee Republican primary, March 1, 2016 |
| Candidate |
Votes |
Percentage |
Actual delegate count |
| Bound |
Unbound |
Total |
 Donald Trump Donald Trump |
333,180 |
38.94% |
33 |
0 |
33 |
| Ted Cruz |
211,471 |
24.71% |
16 |
0 |
16 |
| Marco Rubio |
181,274 |
21.18% |
9 |
0 |
9 |
| Ben Carson |
64,951 |
7.59% |
0 |
0 |
0 |
| John Kasich |
45,301 |
5.29% |
0 |
0 |
0 |
| Jeb Bush (withdrawn) |
9,551 |
1.12% |
0 |
0 |
0 |
| Mike Huckabee (withdrawn) |
2,415 |
0.28% |
0 |
0 |
0 |
| Rand Paul (withdrawn) |
2,350 |
0.27% |
0 |
0 |
0 |
| Uncommitted |
1,849 |
0.22% |
0 |
0 |
0 |
| Chris Christie (withdrawn) |
1,256 |
0.15% |
0 |
0 |
0 |
| Carly Fiorina (withdrawn) |
715 |
0.08% |
0 |
0 |
0 |
| Rick Santorum (withdrawn) |
710 |
0.08% |
0 |
0 |
0 |
| Jim Gilmore (withdrawn) |
267 |
0.03% |
0 |
0 |
0 |
| Lindsey Graham (withdrawn) |
253 |
0.03% |
0 |
0 |
0 |
| George Pataki (withdrawn) |
186 |
0.02% |
0 |
0 |
0 |
| Unprojected delegates: |
0 |
0 |
0 |
| Total: |
855,729 |
100.00% |
58 |
0 |
58 |
| Source: The Green Papers |
General election
U.S. presidential election in Tennessee, 2016[2]
| Party |
Candidate |
Votes |
% |
|
Republican |
Donald Trump |
1,522,925 |
60.72% |
|
Democratic |
Hillary Clinton |
870,695 |
34.72% |
|
Libertarian |
Gary Johnson |
70,397 |
2.81% |
|
Green |
Jill Stein |
15,993 |
0.64% |
|
Independent |
Evan McMullin (write-in) |
11,991 |
0.48% |
|
Independent |
Mike Smith |
7,276 |
0.29% |
|
Reform |
Rocky De La Fuente |
4,075 |
0.16% |
|
Socialist Workers |
Alyson Kennedy |
2,877 |
0.12% |
|
Independent |
Write-in |
1,798 |
0.07% |
| Total votes |
2,508,027 |
100.00% |
By congressional district
Trump won 7 of 9 congressional districts.[3]
By county
| County |
Clinton% |
Clinton# |
Trump% |
Trump# |
Others% |
Others# |
Total |
| Anderson County | 30.16% | 9,013 | 64.30% | 19,212 | 05.54% | 1,656 | 29,881 |
| Bedford County | 22.11% | 3,395 | 74.80% | 11,486 | 03.09% | 474 | 15,355 |
| Benton County | 23.29% | 1,474 | 74.53% | 4,716 | 02.18% | 138 | 6,328 |
| Bledsoe County | 19.23% | 897 | 77.66% | 3,622 | 03.11% | 145 | 4,664 |
| Blount County | 23.18% | 12,100 | 71.72% | 37,443 | 05.10% | 2,665 | 52,208 |
| Bradley County | 18.28% | 7,070 | 76.99% | 29,768 | 04.73% | 1,828 | 38,666 |
| Campbell County | 17.94% | 2,248 | 78.76% | 9,870 | 03.30% | 414 | 12,532 |
| Cannon County | 21.21% | 1,127 | 75.40% | 4,007 | 03.39% | 180 | 5,314 |
| Carroll County | 22.41% | 2,327 | 74.69% | 7,756 | 02.90% | 301 | 10,384 |
| Carter County | 16.38% | 3,453 | 80.15% | 16,898 | 03.48% | 733 | 21,084 |
| Cheatham County | 24.35% | 3,878 | 70.94% | 11,297 | 04.70% | 749 | 15,924 |
| Chester County | 19.10% | 1,243 | 78.09% | 5,081 | 02.81% | 183 | 6,507 |
| Claiborne County | 17.06% | 1,832 | 80.09% | 8,602 | 02.85% | 306 | 10,740 |
| Clay County | 24.21% | 707 | 73.32% | 2,141 | 02.47% | 72 | 2,920 |
| Cocke County | 16.34% | 1,981 | 80.74% | 9,791 | 02.92% | 354 | 12,126 |
| Coffee County | 23.75% | 4,743 | 72.19% | 14,417 | 04.06% | 811 | 19,971 |
| Crockett County | 24.14% | 1,303 | 73.78% | 3,982 | 02.08% | 112 | 5,397 |
| Cumberland County | 19.73% | 5,202 | 77.44% | 20,413 | 02.83% | 745 | 26,360 |
| Davidson County | 59.77% | 148,864 | 33.95% | 84,550 | 06.29% | 15,654 | 249,068 |
| Decatur County | 19.47% | 894 | 78.14% | 3,588 | 02.40% | 110 | 4,592 |
| DeKalb County | 22.56% | 1,569 | 74.35% | 5,171 | 03.09% | 215 | 6,955 |
| Dickson County | 25.25% | 4,722 | 70.77% | 13,233 | 03.98% | 744 | 18,699 |
| Dyer County | 21.12% | 2,816 | 76.33% | 10,180 | 02.55% | 340 | 13,336 |
| Fayette County | 30.29% | 5,874 | 67.31% | 13,055 | 02.40% | 465 | 19,394 |
| Fentress County | 15.00% | 1,100 | 82.34% | 6,038 | 02.66% | 195 | 7,333 |
| Franklin County | 26.66% | 4,374 | 70.30% | 11,532 | 03.04% | 498 | 16,404 |
| Gibson County | 26.90% | 5,258 | 70.53% | 13,786 | 02.57% | 503 | 19,547 |
| Giles County | 26.19% | 2,917 | 71.56% | 7,970 | 02.24% | 250 | 11,137 |
| Grainger County | 14.41% | 1,154 | 82.74% | 6,626 | 02.85% | 228 | 8,008 |
| Greene County | 17.88% | 4,216 | 78.71% | 18,562 | 03.41% | 805 | 23,583 |
| Grundy County | 20.97% | 999 | 76.34% | 3,636 | 02.69% | 128 | 4,763 |
| Hamblen County | 19.69% | 4,075 | 76.63% | 15,857 | 03.67% | 760 | 20,692 |
| Hamilton County | 38.84% | 55,316 | 55.29% | 78,733 | 05.87% | 8,359 | 142,408 |
| Hancock County | 14.43% | 322 | 82.61% | 1,843 | 02.96% | 66 | 2,231 |
| Hardeman County | 45.13% | 4,185 | 53.05% | 4,919 | 01.82% | 169 | 9,273 |
| Hardin County | 16.30% | 1,622 | 80.53% | 8,012 | 03.17% | 315 | 9,949 |
| Hawkins County | 16.88% | 3,507 | 80.14% | 16,648 | 02.98% | 619 | 20,774 |
| Haywood County | 54.30% | 3,711 | 44.09% | 3,013 | 01.61% | 110 | 6,834 |
| Henderson County | 17.62% | 1,800 | 79.65% | 8,138 | 02.73% | 279 | 10,217 |
| Henry County | 23.66% | 3,063 | 73.45% | 9,508 | 02.89% | 374 | 12,945 |
| Hickman County | 23.35% | 1,824 | 72.89% | 5,695 | 03.76% | 294 | 7,813 |
| Houston County | 27.34% | 866 | 68.88% | 2,182 | 03.79% | 120 | 3,168 |
| Humphreys County | 27.50% | 1,967 | 68.92% | 4,930 | 03.58% | 256 | 7,153 |
| Jackson County | 25.28% | 1,129 | 72.46% | 3,236 | 02.26% | 101 | 4,466 |
| Jefferson County | 18.32% | 3,494 | 77.47% | 14,776 | 04.21% | 802 | 19,072 |
| Johnson County | 15.02% | 988 | 82.23% | 5,410 | 02.75% | 181 | 6,579 |
| Knox County | 34.80% | 62,878 | 58.53% | 105,767 | 06.67% | 12,052 | 180,697 |
| Lake County | 29.29% | 577 | 68.88% | 1,357 | 01.83% | 36 | 1,970 |
| Lauderdale County | 37.79% | 3,056 | 60.39% | 4,884 | 01.82% | 147 | 8,087 |
| Lawrence County | 18.01% | 2,821 | 79.28% | 12,420 | 02.71% | 425 | 15,666 |
| Lewis County | 19.26% | 890 | 77.56% | 3,585 | 03.18% | 147 | 4,622 |
| Lincoln County | 19.13% | 2,554 | 77.90% | 10,398 | 02.97% | 396 | 13,348 |
| Loudon County | 21.03% | 4,919 | 75.29% | 17,610 | 03.69% | 862 | 23,391 |
| Macon County | 14.29% | 1,072 | 83.46% | 6,263 | 02.25% | 169 | 7,504 |
| Madison County | 40.52% | 15,448 | 55.97% | 21,335 | 03.51% | 1,337 | 38,120 |
| Marion County | 26.07% | 2,832 | 70.85% | 7,696 | 03.07% | 334 | 10,862 |
| Marshall County | 24.90% | 2,852 | 71.44% | 8,184 | 03.66% | 419 | 11,455 |
| Maury County | 28.38% | 10,038 | 67.29% | 23,799 | 04.33% | 1,532 | 35,369 |
| McMinn County | 18.72% | 3,510 | 78.33% | 14,691 | 02.95% | 554 | 18,755 |
| McNairy County | 18.41% | 1,848 | 78.11% | 7,841 | 03.48% | 349 | 10,038 |
| Meigs County | 19.81% | 856 | 77.36% | 3,342 | 02.82% | 122 | 4,320 |
| Monroe County | 18.64% | 3,186 | 78.24% | 13,374 | 03.12% | 533 | 17,093 |
| Montgomery County | 37.66% | 21,699 | 56.13% | 32,341 | 06.21% | 3,580 | 57,620 |
| Moore County | 16.95% | 496 | 79.46% | 2,325 | 03.59% | 105 | 2,926 |
| Morgan County | 15.72% | 1,054 | 81.15% | 5,441 | 03.13% | 210 | 6,705 |
| Obion County | 19.81% | 2,426 | 77.77% | 9,526 | 02.42% | 297 | 12,249 |
| Overton County | 23.64% | 1,945 | 73.63% | 6,059 | 02.73% | 225 | 8,229 |
| Perry County | 20.91% | 597 | 75.90% | 2,167 | 03.19% | 91 | 2,855 |
| Pickett County | 20.50% | 536 | 77.28% | 2,021 | 02.22% | 58 | 2,615 |
| Polk County | 19.20% | 1,252 | 78.17% | 5,097 | 02.62% | 171 | 6,520 |
| Putnam County | 25.18% | 6,851 | 69.83% | 19,002 | 04.99% | 1,359 | 27,212 |
| Rhea County | 17.56% | 1,942 | 78.29% | 8,660 | 04.16% | 460 | 11,062 |
| Roane County | 22.32% | 4,837 | 73.28% | 15,880 | 04.39% | 952 | 21,669 |
| Robertson County | 24.48% | 6,637 | 71.59% | 19,410 | 03.93% | 1,066 | 27,113 |
| Rutherford County | 34.17% | 36,706 | 60.05% | 64,515 | 05.78% | 6,215 | 107,436 |
| Scott County | 13.11% | 934 | 84.85% | 6,044 | 02.04% | 145 | 7,123 |
| Sequatchie County | 18.49% | 1,053 | 77.99% | 4,441 | 03.51% | 200 | 5,694 |
| Sevier County | 17.34% | 6,297 | 78.84% | 28,629 | 03.82% | 1,386 | 36,312 |
| Shelby County | 61.95% | 208,992 | 34.48% | 116,344 | 03.57% | 12,047 | 337,383 |
| Smith County | 22.71% | 1,689 | 73.88% | 5,494 | 03.40% | 253 | 7,436 |
| Stewart County | 23.06% | 1,222 | 72.92% | 3,864 | 04.02% | 213 | 5,299 |
| Sullivan County | 20.20% | 12,578 | 75.43% | 46,979 | 04.37% | 2,721 | 62,278 |
| Sumner County | 25.40% | 18,161 | 70.11% | 50,129 | 04.50% | 3,215 | 71,505 |
| Tipton County | 24.64% | 5,785 | 72.02% | 16,910 | 03.35% | 786 | 23,481 |
| Trousdale County | 29.94% | 946 | 66.55% | 2,103 | 03.51% | 111 | 3,160 |
| Unicoi County | 17.54% | 1,262 | 78.82% | 5,671 | 03.64% | 262 | 7,195 |
| Union County | 16.20% | 1,012 | 80.89% | 5,053 | 02.91% | 182 | 6,247 |
| Van Buren County | 22.28% | 539 | 75.24% | 1,820 | 02.48% | 60 | 2,419 |
| Warren County | 25.97% | 3,535 | 70.09% | 9,540 | 03.95% | 537 | 13,612 |
| Washington County | 26.18% | 13,024 | 68.85% | 34,252 | 04.97% | 2,474 | 49,750 |
| Wayne County | 12.24% | 717 | 85.98% | 5,036 | 01.78% | 104 | 5,857 |
| Weakley County | 22.75% | 2,772 | 73.93% | 9,008 | 03.32% | 404 | 12,184 |
| White County | 18.78% | 1,845 | 78.08% | 7,671 | 03.15% | 309 | 9,825 |
| Williamson County | 29.18% | 31,013 | 64.19% | 68,212 | 06.63% | 7,046 | 106,271 |
| Wilson County | 25.36% | 14,385 | 69.46% | 39,406 | 05.19% | 2,943 | 56,734 |
Counties that swung from Democratic to Republican
External links
|
|---|
|
| Republican Party | |
|---|
| Democratic Party | |
|---|
| Libertarian Party | |
|---|
| Green Party | |
|---|
| Constitution Party | |
|---|
| Independent | |
|---|
|
|
|---|
| Election timelines | |
|---|
| National polling | |
|---|
| State polling | |
|---|
| Fundraising | |
|---|
| Debates and forums | |
|---|
| Straw polls | |
|---|
| Major events | |
|---|
Caucuses
and primaries | |
|---|
| Results breakdown | |
|---|
National
conventions | |
|---|
| Reforms | |
|---|
.jpg)