Marion County, Illinois
| Marion County, Illinois | |
|---|---|
 Marion County Courthouse in Salem | |
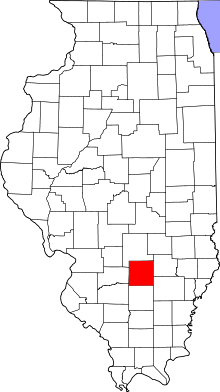 Location in the U.S. state of Illinois | |
 Illinois's location in the U.S. | |
| Founded | 1823 |
| Named for | Francis Marion |
| Seat | Salem |
| Largest city | Centralia |
| Area | |
| • Total | 576 sq mi (1,492 km2) |
| • Land | 572 sq mi (1,481 km2) |
| • Water | 3.7 sq mi (10 km2), 0.6% |
| Population | |
| • (2010) | 39,437 |
| • Density | 69/sq mi (27/km2) |
| Congressional district | 15th |
| Time zone | Central: UTC−6/−5 |
Marion County is a county located in the U.S. state of Illinois. According to the 2010 census, it had a population of 39,437.[1] Its county seat is Salem.[2]
Marion County comprises the Centralia, IL Micropolitan Statistical Area, which is included in the St. Louis-St. Charles-Farmington, MO-IL Combined Statistical Area.
History
Marion County was organized on 24 January 1823 from portions of Jefferson and Fayette counties. It was named in honor of Revolutionary War Gen. Francis Marion, the "Swamp Fox".[3]
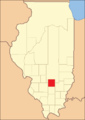 Marion County at the time of its creation in 1823
Geography
According to the U.S. Census Bureau, the county has a total area of 576 square miles (1,490 km2), of which 572 square miles (1,480 km2) is land and 3.7 square miles (9.6 km2) (0.6%) is water.[4]
The southwest corner of Marion County is the intersection of the Baseline with the Third Principal Meridian, the point of origin for the third survey of the Northwest Territory under the Land Ordinance of 1785. The origin is marked with a boulder south of Centralia just off U.S. 51.
Climate and weather
| Salem, Illinois | ||||||||||||||||||||||||||||||||||||||||||||||||||||||||||||
|---|---|---|---|---|---|---|---|---|---|---|---|---|---|---|---|---|---|---|---|---|---|---|---|---|---|---|---|---|---|---|---|---|---|---|---|---|---|---|---|---|---|---|---|---|---|---|---|---|---|---|---|---|---|---|---|---|---|---|---|---|
| Climate chart (explanation) | ||||||||||||||||||||||||||||||||||||||||||||||||||||||||||||
| ||||||||||||||||||||||||||||||||||||||||||||||||||||||||||||
| ||||||||||||||||||||||||||||||||||||||||||||||||||||||||||||
In recent years, average temperatures in the county seat of Salem have ranged from a low of 18 °F (−8 °C) in January to a high of 88 °F (31 °C) in July, although a record low of −23 °F (−31 °C) was recorded in January 1994 and a record high of 105 °F (41 °C) was recorded in August 1983. Average monthly precipitation ranged from 2.46 inches (62 mm) in January to 4.37 inches (111 mm) in May.[5]
Major highways
Adjacent counties
- Fayette County - north
- Clay County - east
- Wayne County - southeast
- Jefferson County - south
- Washington County - southwest
- Clinton County - west
Demographics
| Historical population | |||
|---|---|---|---|
| Census | Pop. | %± | |
| 1830 | 2,125 | — | |
| 1840 | 4,742 | 123.2% | |
| 1850 | 6,720 | 41.7% | |
| 1860 | 12,739 | 89.6% | |
| 1870 | 20,622 | 61.9% | |
| 1880 | 23,686 | 14.9% | |
| 1890 | 24,341 | 2.8% | |
| 1900 | 30,446 | 25.1% | |
| 1910 | 35,094 | 15.3% | |
| 1920 | 37,497 | 6.8% | |
| 1930 | 35,635 | −5.0% | |
| 1940 | 47,989 | 34.7% | |
| 1950 | 41,700 | −13.1% | |
| 1960 | 39,349 | −5.6% | |
| 1970 | 38,986 | −0.9% | |
| 1980 | 43,523 | 11.6% | |
| 1990 | 41,561 | −4.5% | |
| 2000 | 41,691 | 0.3% | |
| 2010 | 39,437 | −5.4% | |
| Est. 2016 | 38,140 | [6] | −3.3% |
| U.S. Decennial Census[7] 1790-1960[8] 1900-1990[9] 1990-2000[10] 2010-2013[1] | |||
As of the 2010 United States Census, there were 39,437 people, 16,148 households, and 10,746 families residing in the county.[11] The population density was 68.9 inhabitants per square mile (26.6/km2). There were 18,296 housing units at an average density of 32.0 per square mile (12.4/km2).[4] The racial makeup of the county was 93.1% white, 3.9% black or African American, 0.6% Asian, 0.3% American Indian, 0.4% from other races, and 1.6% from two or more races. Those of Hispanic or Latino origin made up 1.4% of the population.[11] In terms of ancestry, 27.5% were German, 15.8% were Irish, 13.6% were English, and 10.8% were American.[12]
Of the 16,148 households, 30.9% had children under the age of 18 living with them, 48.9% were married couples living together, 12.8% had a female householder with no husband present, 33.5% were non-families, and 28.8% of all households were made up of individuals. The average household size was 2.40 and the average family size was 2.91. The median age was 41.4 years.[11]
The median income for a household in the county was $38,974 and the median income for a family was $50,518. Males had a median income of $41,428 versus $28,042 for females. The per capita income for the county was $20,493. About 12.2% of families and 16.5% of the population were below the poverty line, including 23.9% of those under age 18 and 9.6% of those age 65 or over.[13]
Communities
Cities
Villages
Census-designated places
- Cartter
- Fairman
- Finney Heights
- Glen Ridge
- Helm
- Slap Out
- Suburban
Townships
Marion County is divided into seventeen townships:
Politics
| Year | Republican | Democratic | Third Parties |
|---|---|---|---|
| 2016 | 69.4% 11,859 | 25.6% 4,369 | 5.1% 870 |
| 2012 | 58.5% 9,248 | 39.4% 6,225 | 2.2% 347 |
| 2008 | 49.9% 8,691 | 47.9% 8,345 | 2.2% 374 |
| 2004 | 54.7% 9,413 | 44.7% 7,694 | 0.7% 117 |
| 2000 | 49.5% 8,240 | 48.4% 8,068 | 2.1% 355 |
| 1996 | 38.1% 5,999 | 49.4% 7,792 | 12.5% 1,972 |
| 1992 | 30.5% 5,764 | 51.2% 9,669 | 18.3% 3,450 |
| 1988 | 50.1% 8,695 | 49.5% 8,592 | 0.5% 86 |
| 1984 | 59.7% 11,300 | 40.1% 7,599 | 0.2% 46 |
| 1980 | 58.7% 10,969 | 37.4% 6,990 | 3.9% 719 |
| 1976 | 46.6% 8,729 | 52.5% 9,834 | 0.8% 157 |
| 1972 | 60.6% 10,755 | 39.3% 6,968 | 0.2% 31 |
| 1968 | 46.1% 8,134 | 43.8% 7,737 | 10.1% 1,778 |
| 1964 | 36.4% 7,060 | 63.7% 12,363 | |
| 1960 | 54.9% 11,121 | 45.0% 9,116 | 0.1% 13 |
| 1956 | 55.8% 10,813 | 44.1% 8,551 | 0.1% 21 |
| 1952 | 53.6% 10,804 | 46.3% 9,317 | 0.1% 19 |
| 1948 | 46.2% 7,798 | 52.6% 8,878 | 1.2% 208 |
| 1944 | 47.9% 9,408 | 51.3% 10,079 | 0.8% 153 |
| 1940 | 42.7% 10,461 | 56.4% 13,807 | 0.9% 208 |
| 1936 | 42.8% 8,321 | 55.6% 10,820 | 1.6% 305 |
| 1932 | 36.1% 6,276 | 62.1% 10,791 | 1.8% 313 |
| 1928 | 60.5% 9,110 | 38.7% 5,823 | 0.8% 119 |
| 1924 | 44.0% 5,889 | 35.6% 4,768 | 20.4% 2,724 |
| 1920 | 52.1% 6,620 | 34.2% 4,351 | 13.7% 1,744 |
| 1916 | 43.0% 6,438 | 52.7% 7,892 | 4.3% 646 |
| 1912 | 20.1% 1,586 | 44.3% 3,493 | 35.6% 2,813 |
| 1908 | 43.1% 3,435 | 50.2% 4,001 | 6.6% 527 |
| 1904 | 47.3% 3,190 | 36.9% 2,490 | 15.9% 1,071 |
| 1900 | 43.9% 3,221 | 53.5% 3,928 | 2.6% 191 |
| 1896 | 42.3% 2,870 | 56.6% 3,835 | 1.1% 77 |
| 1892 | 39.9% 2,324 | 46.5% 2,709 | 13.6% 794 |
Initially a strongly Democratic anti-Yankee county, Marion County has undergone two transitions. Between 1912 and 2004 it was a perfect bellwether apart from the Catholicism-influenced 1960 election when substantial anti-Catholic voting by its largely southern white population caused it to support Republican Richard Nixon. Since the beginning of the twenty-first century, strong opposition to the Democratic Party’s liberal views on social issues has transformed the county into a powerfully Republican one,[15] with Hillary Clinton receiving a vote share over twelve percent smaller than any pre-2010 Democratic presidential nominee.
See also
References
- 1 2 "State & County QuickFacts". United States Census Bureau. Archived from the original on July 14, 2011. Retrieved July 7, 2014.
- ↑ "Find a County". National Association of Counties. Archived from the original on 2011-05-31. Retrieved 2011-06-07.
- ↑ Gannett, Henry (1905). The Origin of Certain Place Names in the United States. U.S. Government Printing Office. p. 200.
- 1 2 "Population, Housing Units, Area, and Density: 2010 - County". United States Census Bureau. Retrieved 2015-07-12.
- 1 2 "Monthly Averages for Salem, Illinois". The Weather Channel. Archived from the original on 2012-10-23. Retrieved 2011-01-27.
- ↑ "Population and Housing Unit Estimates". Archived from the original on May 29, 2017. Retrieved June 9, 2017.
- ↑ "U.S. Decennial Census". United States Census Bureau. Archived from the original on May 12, 2015. Retrieved July 7, 2014.
- ↑ "Historical Census Browser". University of Virginia Library. Archived from the original on August 16, 2012. Retrieved July 7, 2014.
- ↑ "Population of Counties by Decennial Census: 1900 to 1990". United States Census Bureau. Archived from the original on April 24, 2014. Retrieved July 7, 2014.
- ↑ "Census 2000 PHC-T-4. Ranking Tables for Counties: 1990 and 2000" (PDF). United States Census Bureau. Archived (PDF) from the original on December 18, 2014. Retrieved July 7, 2014.
- 1 2 3 "DP-1 Profile of General Population and Housing Characteristics: 2010 Demographic Profile Data". United States Census Bureau. Retrieved 2015-07-12.
- ↑ "DP02 SELECTED SOCIAL CHARACTERISTICS IN THE UNITED STATES – 2006-2010 American Community Survey 5-Year Estimates". United States Census Bureau. Retrieved 2015-07-12.
- ↑ "DP03 SELECTED ECONOMIC CHARACTERISTICS – 2006-2010 American Community Survey 5-Year Estimates". United States Census Bureau. Retrieved 2015-07-12.
- ↑ Leip, David. "Dave Leip's Atlas of U.S. Presidential Elections". uselectionatlas.org. Archived from the original on 23 March 2018. Retrieved 1 May 2018.
- ↑ Cohn, Nate; ‘Demographic Shift: Southern Whites’ Loyalty to G.O.P. Nearing That of Blacks to Democrats’ Archived 2017-07-28 at the Wayback Machine., New York Times, April 24, 2014
Places adjacent to Marion County, Illinois | ||||||||||
|---|---|---|---|---|---|---|---|---|---|---|
| ||||||||||
Municipalities and communities of Marion County, Illinois, United States | ||
|---|---|---|
| Cities | ||
| Villages | ||
| Townships | ||
| Unincorporated communities | ||
| Footnotes | ‡This populated place also has portions in an adjacent county or counties | |
| Topics | 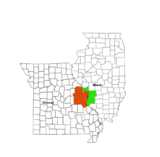 | |
|---|---|---|
| Central city | ||
| Largest cities (over 50,000 in 2010) | ||
| Medium-sized cities (over 20,000 in 2010) | ||
| Largest towns and villages (over 10,000 in 2010) |
| |
| Missouri Counties | ||
| Illinois Counties | ||
| Subregions | ||
| Counties |  | |
|---|---|---|
| Major Cities (25,000+) | ||
| Cities (5,000-25,000) | ||
| Communities (1,000-5,000) |
| |
| Interstates | ||
| Airports | ||
| Colleges | ||
| Sports teams |
| |

| Counties |  | |
|---|---|---|
| Mid-sized cities (25,000+) | ||
| Small Cities (10,000-25,000) | ||
| Small Cities (5,000-10,000) | ||
| Interstates | ||
| Airports/Military bases |
| |
| Universities | ||
| Colleges | ||
| Sports teams based in the Southern Illinois | ||