Hancock County, Illinois
| Hancock County, Illinois | |
|---|---|
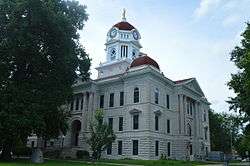 Hancock County Courthouse in Carthage | |
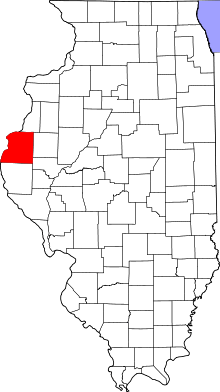 Location in the U.S. state of Illinois | |
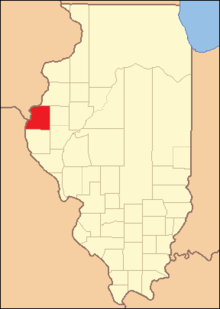
 Illinois's location in the U.S. | |
| Founded | 1825 |
| Named for | John Hancock |
| Seat | Carthage |
| Largest city | Hamilton |
| Area | |
| • Total | 814 sq mi (2,108 km2) |
| • Land | 794 sq mi (2,056 km2) |
| • Water | 21 sq mi (54 km2), 2.5% |
| Population | |
| • (2010) | 19,104 |
| • Density | 24/sq mi (9/km2) |
| Congressional district | 18th |
| Time zone | Central: UTC−6/−5 |
| Website |
www |
Hancock County is a county located in the U.S. state of Illinois. According to the 2010 census, it has a population of 19,104.[1] Its county seat is Carthage,[2] and its largest city is Hamilton. The county is made up of rural towns with many farmers.
Hancock County is included in the Fort Madison-Keokuk, IA-IL-MO Micropolitan Statistical Area.
History
Hancock County was part of the "Military Tract" set aside by Congress to reward veterans of the War of 1812. Actual settlement of the interior of the county was delayed by concerns about hostile American Indians. After their defeat in the Blackhawk War in 1832, settlement proceeded quickly.
Hancock County was formed, on January 13, 1825, out of Pike County. It was named in honor of John Hancock, who clearly signed the Declaration of Independence.[3]
For a brief period in the 1840s Hancock had one of Illinois' most populous cities: Nauvoo, which was then headquarters for the Church of Jesus Christ of Latter Day Saints. The movement's founder Joseph Smith was killed in the county seat of Carthage in 1844. Most Mormons left Hancock County in the 1840s. Today, followers of the Latter Day Saint movement come, in increasing numbers, to important Latter Day Saint sites in Hancock County, partly for vacation and partly for religious pilgrimage.
The original courthouse was located at Montebello. Montebello no longer exists but was between Nauvoo and Hamilton. In 1833 the state commissioned the formation of the county seat at Carthage, which was centrally located but not well developed at the time. A log cabin was built to serve as the courthouse and continued to serve that purpose until 1839 when the second Carthage Courthouse was built. The original log cabin continued to serve as a school and other purposes until 1945 when it was removed.
The second courthouse cost $3,700 to build and served from 1839 until 1906. It served as a location for both Stephen A. Douglas (October 11, 1858) and Abraham Lincoln (October 22, 1858) to speak to residents of the area as they were running against each other for the US Senate. In 1906 it was removed to make room for the current courthouse.
The current courthouse was dedicated October 21, 1908.
Geography
According to the U.S. Census Bureau, the county has a total area of 814 square miles (2,110 km2), of which 794 square miles (2,060 km2) is land and 21 square miles (54 km2) (2.5%) is water.[4]
Climate and weather
| Carthage, Illinois | ||||||||||||||||||||||||||||||||||||||||||||||||||||||||||||
|---|---|---|---|---|---|---|---|---|---|---|---|---|---|---|---|---|---|---|---|---|---|---|---|---|---|---|---|---|---|---|---|---|---|---|---|---|---|---|---|---|---|---|---|---|---|---|---|---|---|---|---|---|---|---|---|---|---|---|---|---|
| Climate chart (explanation) | ||||||||||||||||||||||||||||||||||||||||||||||||||||||||||||
| ||||||||||||||||||||||||||||||||||||||||||||||||||||||||||||
| ||||||||||||||||||||||||||||||||||||||||||||||||||||||||||||
In recent years, average temperatures in the county seat of Carthage have ranged from a low of 13 °F (−11 °C) in January to a high of 87 °F (31 °C) in July, although a record low of −30 °F (−34 °C) was recorded in February 1905 and a record high of 113 °F (45 °C) was recorded in August 1934. Average monthly precipitation ranged from 1.47 inches (37 mm) in January to 4.58 inches (116 mm) in May.[5]
Major highways
Adjacent counties
- Henderson County - northeast
- McDonough County - east
- Schuyler County - southeast
- Adams County - south
- Lewis County, Missouri - southwest
- Clark County, Missouri - west
- Lee County, Iowa - northwest
Demographics

| Historical population | |||
|---|---|---|---|
| Census | Pop. | %± | |
| 1830 | 483 | — | |
| 1840 | 9,946 | 1,959.2% | |
| 1850 | 14,652 | 47.3% | |
| 1860 | 29,061 | 98.3% | |
| 1870 | 35,935 | 23.7% | |
| 1880 | 35,337 | −1.7% | |
| 1890 | 31,907 | −9.7% | |
| 1900 | 32,215 | 1.0% | |
| 1910 | 30,638 | −4.9% | |
| 1920 | 28,523 | −6.9% | |
| 1930 | 26,420 | −7.4% | |
| 1940 | 26,297 | −0.5% | |
| 1950 | 25,790 | −1.9% | |
| 1960 | 24,574 | −4.7% | |
| 1970 | 23,645 | −3.8% | |
| 1980 | 23,877 | 1.0% | |
| 1990 | 21,373 | −10.5% | |
| 2000 | 20,121 | −5.9% | |
| 2010 | 19,104 | −5.1% | |
| Est. 2016 | 18,508 | [6] | −3.1% |
| U.S. Decennial Census[7] 1790-1960[8] 1900-1990[9] 1990-2000[10] 2010-2013[1] | |||
As of the 2010 United States Census, there were 19,104 people, 8,040 households, and 5,427 families residing in the county.[11] The population density was 24.1 inhabitants per square mile (9.3/km2). There were 9,274 housing units at an average density of 11.7 per square mile (4.5/km2).[4] The racial makeup of the county was 98.0% white, 0.3% black or African American, 0.2% Asian, 0.2% American Indian, 0.1% Pacific islander, 0.3% from other races, and 0.9% from two or more races. Those of Hispanic or Latino origin made up 1.0% of the population.[11] In terms of ancestry, 34.7% were German, 13.8% were English, 13.2% were American, and 12.1% were Irish.[12]
Of the 8,040 households, 27.5% had children under the age of 18 living with them, 55.3% were married couples living together, 8.3% had a female householder with no husband present, 32.5% were non-families, and 28.2% of all households were made up of individuals. The average household size was 2.35 and the average family size was 2.85. The median age was 44.6 years.[11]
The median income for a household in the county was $42,857 and the median income for a family was $55,162. Males had a median income of $41,609 versus $27,648 for females. The per capita income for the county was $22,885. About 8.9% of families and 12.6% of the population were below the poverty line, including 17.8% of those under age 18 and 9.9% of those age 65 or over.[13]
Politics
Hancock County is located in Illinois's 18th Congressional District and is currently represented by Republican Davin LaHood. For the Illinois House of Representatives, the county is located in the 94th district and is currently represented by Republican Randy Frese. The county is located in the 47th district of the Illinois Senate, and is currently represented by Republican Jil Tracy.
In presidential elections, Hancock County usually favors Republican candidates, having voted for Democratic presidential candidates only four times during the period of 1940 to 2016 (in 1964, 1988, 1992, and 1996).
| Year | Republican | Democratic | Third Parties |
|---|---|---|---|
| 2016 | 70.5% 6,430 | 23.5% 2,139 | 6.1% 552 |
| 2012 | 57.9% 5,271 | 40.1% 3,650 | 2.1% 190 |
| 2008 | 54.5% 5,161 | 43.7% 4,141 | 1.8% 167 |
| 2004 | 59.0% 5,837 | 40.2% 3,975 | 0.9% 87 |
| 2000 | 53.0% 5,134 | 43.9% 4,256 | 3.1% 301 |
| 1996 | 43.2% 3,961 | 43.6% 4,001 | 13.3% 1,216 |
| 1992 | 36.9% 3,714 | 41.8% 4,213 | 21.3% 2,142 |
| 1988 | 48.7% 4,568 | 50.5% 4,740 | 0.8% 70 |
| 1984 | 62.5% 6,251 | 37.1% 3,713 | 0.4% 37 |
| 1980 | 62.3% 6,597 | 33.3% 3,522 | 4.4% 466 |
| 1976 | 55.5% 6,043 | 43.5% 4,730 | 1.0% 108 |
| 1972 | 67.6% 7,519 | 32.3% 3,592 | 0.2% 18 |
| 1968 | 60.2% 6,866 | 32.6% 3,720 | 7.1% 811 |
| 1964 | 47.3% 5,557 | 52.7% 6,199 | |
| 1960 | 61.9% 8,036 | 38.1% 4,947 | 0.1% 7 |
| 1956 | 63.4% 8,431 | 36.5% 4,854 | 0.1% 12 |
| 1952 | 66.1% 9,181 | 33.7% 4,681 | 0.1% 19 |
| 1948 | 55.5% 7,098 | 43.5% 5,559 | 1.0% 122 |
| 1944 | 59.6% 7,972 | 39.9% 5,338 | 0.5% 68 |
| 1940 | 57.1% 9,108 | 41.9% 6,688 | 1.0% 165 |
| 1936 | 47.6% 7,383 | 49.8% 7,726 | 2.6% 398 |
| 1932 | 34.9% 4,789 | 64.1% 8,808 | 1.0% 137 |
| 1928 | 58.7% 7,795 | 41.0% 5,447 | 0.4% 48 |
| 1924 | 51.8% 6,678 | 40.3% 5,189 | 7.9% 1,018 |
| 1920 | 57.8% 7,379 | 40.1% 5,125 | 2.1% 274 |
| 1916 | 44.0% 6,472 | 52.4% 7,711 | 3.7% 543 |
| 1912 | 25.6% 1,937 | 48.8% 3,692 | 25.6% 1,937 |
| 1908 | 45.5% 3,781 | 51.2% 4,260 | 3.3% 274 |
| 1904 | 49.5% 3,887 | 44.0% 3,456 | 6.6% 515 |
| 1900 | 44.7% 3,907 | 53.3% 4,657 | 2.0% 177 |
| 1896 | 47.2% 4,250 | 50.9% 4,581 | 2.0% 177 |
| 1892 | 41.8% 3,393 | 50.9% 4,132 | 7.3% 595 |
Communities
Cities
- Carthage
- Dallas City (partly in Henderson County)
- Hamilton
- La Harpe
- Nauvoo
- Warsaw
Town
Villages
Unincorporated communities
- Adrian
- Breckenridge
- Burnside
- Chili
- Colusa
- Denver
- Disco
- Durham
- Elderville
- Fountain Green
- Joetta
- La Crosse
- McCall
- Middle Creek
- Niota
- Old Niota
- Powellton
- Saint Mary
- Stillwell
- Sutter
- Tioga
- Webster
Townships
Hancock County is divided into twenty-four townships:
See also
References
- 1 2 "State & County QuickFacts". United States Census Bureau. Archived from the original on July 11, 2011. Retrieved July 5, 2014.
- ↑ "Find a County". National Association of Counties. Retrieved 2011-06-07.
- ↑ Gannett, Henry (1905). The Origin of Certain Place Names in the United States. Govt. Print. Off. p. 148.
- 1 2 "Population, Housing Units, Area, and Density: 2010 - County". United States Census Bureau. Retrieved 2015-07-11.
- 1 2 "Monthly Averages for Carthage, Illinois". The Weather Channel. Retrieved 2011-01-27.
- ↑ "Population and Housing Unit Estimates". Retrieved June 9, 2017.
- ↑ "U.S. Decennial Census". United States Census Bureau. Retrieved July 5, 2014.
- ↑ "Historical Census Browser". University of Virginia Library. Retrieved July 5, 2014.
- ↑ "Population of Counties by Decennial Census: 1900 to 1990". United States Census Bureau. Retrieved July 5, 2014.
- ↑ "Census 2000 PHC-T-4. Ranking Tables for Counties: 1990 and 2000" (PDF). United States Census Bureau. Retrieved July 5, 2014.
- 1 2 3 "DP-1 Profile of General Population and Housing Characteristics: 2010 Demographic Profile Data". United States Census Bureau. Retrieved 2015-07-11.
- ↑ "DP02 SELECTED SOCIAL CHARACTERISTICS IN THE UNITED STATES – 2006-2010 American Community Survey 5-Year Estimates". United States Census Bureau. Retrieved 2015-07-11.
- ↑ "DP03 SELECTED ECONOMIC CHARACTERISTICS – 2006-2010 American Community Survey 5-Year Estimates". United States Census Bureau. Retrieved 2015-07-11.
- ↑ http://uselectionatlas.org/RESULTS
External links
Places adjacent to Hancock County, Illinois | ||||||||||
|---|---|---|---|---|---|---|---|---|---|---|
| ||||||||||
Municipalities and communities of Hancock County, Illinois, United States | ||
|---|---|---|
| Cities | ||
| Town | ||
| Villages | ||
| Townships | ||
| Unincorporated communities | ||
| Footnotes | ‡This populated place also has portions in an adjacent county or counties | |
