Fulton County, Illinois
| Fulton County, Illinois | |
|---|---|
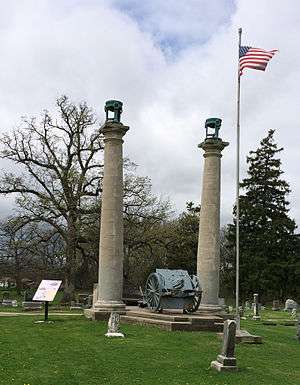 The old courthouse columns at Oak Hill Cemetery | |
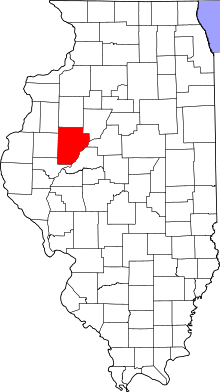 Location in the U.S. state of Illinois | |
 Illinois's location in the U.S. | |
| Founded | 1823 |
| Named for | Robert Fulton |
| Seat | Lewistown |
| Largest city | Canton |
| Area | |
| • Total | 883 sq mi (2,287 km2) |
| • Land | 866 sq mi (2,243 km2) |
| • Water | 17 sq mi (44 km2), 1.9% |
| Population | |
| • (2010) | 37,069 |
| • Density | 43/sq mi (17/km2) |
| Congressional district | 17th |
| Time zone | Central: UTC−6/−5 |
| Website |
www |
Fulton County is a county in the U.S. state of Illinois. According to the 2010 census, it had a population of 37,069.[1] Its county seat is Lewistown,[2] and the largest city is Canton.
Fulton County comprises the Canton, IL Micropolitan Statistical Area, which is part of the Peoria-Canton, IL Combined Statistical Area. Fulton County is part of Forgottonia.
Bob Bucher is the Chairman of the Fulton County Board. Mike Hays was the County Administrator until the position was eliminated.
History
Fulton County was organized in 1823 from Pike County. It is named for Robert Fulton, inventor of the steamboat.[3] It was the home of famous poet/writer Edgar Lee Masters in his early days; he wrote the famous Spoon River Anthology (1915). Fulton County was home to Camp Ellis during World War II.
The county is known for the annual Spoon River Scenic Drive which occurs the first 2 weekends in October. This has been a tradition since 1968 and attracts thousands of participants from all over the country.
Fulton County is also home to he Ogden-Fettie Site one of the more important sites in Havana Hopewell Native culture. It is the largest collection of Woodland Mounds in Illinois, with 35 Mounds builtin a crescent shape dating back to 400 B.C.
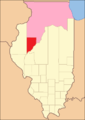 Fulton County between 1823 and 1825, including a large tract of unorganized territory temporarily attached.[4]
 Fulton County in 1825, reduced to its current size, its unorganized territory formed into new counties.
Geography
According to the U.S. Census Bureau, the county has a total area of 883 square miles (2,290 km2), of which 866 square miles (2,240 km2) is land and 17 square miles (44 km2) (1.9%) is water.[5]
Fulton County is the site of Dickson Mounds Museum, a state museum of Native American daily life in the Illinois River valley.
Climate and weather
| Lewistown, Illinois | ||||||||||||||||||||||||||||||||||||||||||||||||||||||||||||
|---|---|---|---|---|---|---|---|---|---|---|---|---|---|---|---|---|---|---|---|---|---|---|---|---|---|---|---|---|---|---|---|---|---|---|---|---|---|---|---|---|---|---|---|---|---|---|---|---|---|---|---|---|---|---|---|---|---|---|---|---|
| Climate chart (explanation) | ||||||||||||||||||||||||||||||||||||||||||||||||||||||||||||
| ||||||||||||||||||||||||||||||||||||||||||||||||||||||||||||
| ||||||||||||||||||||||||||||||||||||||||||||||||||||||||||||
In recent years, average temperatures in the county seat of Lewistown have ranged from a low of 14 °F (−10 °C) in January to a high of 88 °F (31 °C) in July, although a record low of −30 °F (−34 °C) was recorded in January 1999 and a record high of 106 °F (41 °C) was recorded in July 1983. Average monthly precipitation ranged from 1.85 inches (47 mm) in January to 4.43 inches (113 mm) in May.[6]
Adjacent counties
- Knox County - north
- Peoria County - northeast
- Tazewell County - east
- Mason County - south
- Schuyler County - southwest
- McDonough County - west
- Warren County - northwest
National protected area
Transportation
Major highways
Airport
The county contains one public-use airport: Ingersoll Airport (CTK), located in Canton.[7]
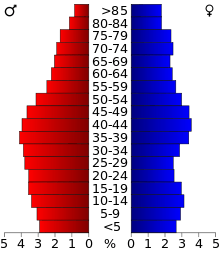
Demographics
| Historical population | |||
|---|---|---|---|
| Census | Pop. | %± | |
| 1830 | 1,841 | — | |
| 1840 | 13,142 | 613.9% | |
| 1850 | 22,508 | 71.3% | |
| 1860 | 33,338 | 48.1% | |
| 1870 | 38,291 | 14.9% | |
| 1880 | 41,240 | 7.7% | |
| 1890 | 43,110 | 4.5% | |
| 1900 | 46,201 | 7.2% | |
| 1910 | 49,549 | 7.2% | |
| 1920 | 48,163 | −2.8% | |
| 1930 | 43,983 | −8.7% | |
| 1940 | 44,627 | 1.5% | |
| 1950 | 43,716 | −2.0% | |
| 1960 | 41,954 | −4.0% | |
| 1970 | 41,890 | −0.2% | |
| 1980 | 43,687 | 4.3% | |
| 1990 | 38,080 | −12.8% | |
| 2000 | 38,250 | 0.4% | |
| 2010 | 37,069 | −3.1% | |
| Est. 2016 | 35,536 | [8] | −4.1% |
| U.S. Decennial Census[9] 1790-1960[10] 1900-1990[11] 1990-2000[12] 2010-2013[1] | |||
As of the 2010 United States Census, there were 37,069 people, 14,536 households, and 9,744 families residing in the county.[13] The population density was 42.8 inhabitants per square mile (16.5/km2). There were 16,195 housing units at an average density of 18.7 per square mile (7.2/km2).[5] The racial makeup of the county was 93.4% white, 3.4% black or African American, 0.4% American Indian, 0.3% Asian, 1.6% from other races, and 0.9% from two or more races. Those of Hispanic or Latino origin made up 2.4% of the population.[13] In terms of ancestry, 23.7% were German, 19.1% were American, 14.0% were English, and 13.2% were Irish.[14]
Of the 14,536 households, 29.3% had children under the age of 18 living with them, 52.0% were married couples living together, 10.2% had a female householder with no husband present, 33.0% were non-families, and 28.1% of all households were made up of individuals. The average household size was 2.37 and the average family size was 2.86. The median age was 41.9 years.[13]
The median income for a household in the county was $41,268 and the median income for a family was $50,596. Males had a median income of $41,376 versus $28,596 for females. The per capita income for the county was $20,309. About 9.9% of families and 13.8% of the population were below the poverty line, including 22.2% of those under age 18 and 8.0% of those age 65 or over.[15]
Communities
Cities
Villages
Unincorporated communities
Townships
Fulton County is divided into twenty-six townships:
Politics
| Year | Republican | Democratic | Third Parties |
|---|---|---|---|
| 2016 | 53.8% 8,492 | 38.8% 6,133 | 7.4% 1,172 |
| 2012 | 43.0% 6,632 | 54.0% 8,328 | 2.9% 451 |
| 2008 | 38.2% 6,251 | 59.5% 9,732 | 2.4% 386 |
| 2004 | 45.9% 7,818 | 53.3% 9,080 | 0.8% 137 |
| 2000 | 42.6% 6,936 | 54.9% 8,940 | 2.5% 401 |
| 1996 | 32.8% 5,155 | 56.4% 8,857 | 10.8% 1,694 |
| 1992 | 28.6% 5,062 | 54.9% 9,725 | 16.5% 2,914 |
| 1988 | 43.5% 6,999 | 56.2% 9,046 | 0.4% 63 |
| 1984 | 49.8% 9,147 | 49.7% 9,131 | 0.5% 99 |
| 1980 | 54.4% 10,316 | 39.5% 7,481 | 6.1% 1,160 |
| 1976 | 50.2% 9,588 | 48.8% 9,314 | 1.0% 188 |
| 1972 | 61.8% 12,328 | 37.7% 7,529 | 0.5% 92 |
| 1968 | 46.7% 9,582 | 46.9% 9,622 | 6.4% 1,305 |
| 1964 | 37.4% 7,785 | 62.6% 13,030 | |
| 1960 | 53.9% 11,999 | 45.8% 10,194 | 0.3% 58 |
| 1956 | 58.6% 12,375 | 41.2% 8,702 | 0.2% 48 |
| 1952 | 61.1% 13,302 | 38.7% 8,414 | 0.2% 44 |
| 1948 | 53.0% 9,504 | 45.9% 8,226 | 1.1% 203 |
| 1944 | 55.0% 11,117 | 44.2% 8,946 | 0.8% 166 |
| 1940 | 50.8% 12,816 | 48.4% 12,198 | 0.9% 214 |
| 1936 | 43.3% 10,130 | 54.9% 12,864 | 1.8% 428 |
| 1932 | 36.8% 7,579 | 58.9% 12,144 | 4.3% 888 |
| 1928 | 60.0% 10,600 | 37.3% 6,591 | 2.8% 489 |
| 1924 | 48.4% 8,664 | 28.0% 5,011 | 23.7% 4,246 |
| 1920 | 59.3% 9,523 | 32.9% 5,293 | 7.8% 1,256 |
| 1916 | 48.5% 9,735 | 43.3% 8,686 | 8.2% 1,650 |
| 1912 | 20.3% 3,334 | 35.1% 3,902 | 44.6% 4,965[lower-alpha 1] |
| 1908 | 50.5% 6,077 | 40.8% 4,906 | 8.7% 1,042 |
| 1904 | 56.7% 6,373 | 33.7% 3,791 | 9.6% 1,082 |
| 1900 | 50.2% 6,130 | 47.2% 5,762 | 2.7% 329 |
| 1896 | 50.4% 6,195 | 48.6% 5,979 | 1.1% 129 |
| 1892 | 45.7% 4,948 | 48.5% 5,253 | 5.7% 621 |
In its early years Fulton County favored the Democratic Party, being one of the northernmost Democratic counties and the nearest to Yankee, then solidly Republican Northern Illinois. It was never won by a Republican until the Democratic Party moved towards the Populist Party’s policies under William Jennings Bryan, a change which resulted in the county voting Republican except in landslide victories between 1896 and 1960. In that period Franklin D. Roosevelt in 1932 and 1936 was the solitary Democratic presidential candidate to gain a majority of the county’s vote.
However, the 1964 election saw the county trend Democratic – so much so that Hubert Humphrey gained a narrow plurality in his 1968 election loss. Despite not going Democratic again until 1988, the party would always remain competitive in the county, and between 1988 and 2012 every Democratic presidential candidate gained a majority in Fulton County. However, concern over economic decline in the “Rust Belt” saw Donald Trump produce a dramatic swing in the 2016 election, winning Fulton County by fifteen percentage points and gaining the best GOP record in the county since 1980.
In popular culture
The fictional town of Lanford, Illinois in the sitcom Roseanne is set in Fulton County. Even though Fulton County is near Peoria in real life, Lanford on the show is described as a suburb of Chicago near Elgin and Aurora.
See also
Notes
- ↑ There were only 3,334 votes for the leading “other” candidate, Progressive Theodore Roosevelt, plus 1,334 for Socialist Eugene V. Debs, 230 for the Prohibition Party's Eugene Chafin, and 67 for Socialist Labor candidate Arthur Reimer.
References
- Specific
- 1 2 "State & County QuickFacts". United States Census Bureau. Archived from the original on July 10, 2011. Retrieved July 5, 2014.
- ↑ "Find a County". National Association of Counties. Archived from the original on 2011-05-31. Retrieved 2011-06-07.
- ↑ Gannett, Henry (1905). The Origin of Certain Place Names in the United States. Govt. Print. Off. p. 133.
- ↑ White, Jesse. Origin and Evolution of Illinois Counties. State of Illinois, March 2010. "Archived copy" (PDF). Archived (PDF) from the original on 2012-09-30. Retrieved 2012-09-26.
- 1 2 "Population, Housing Units, Area, and Density: 2010 - County". United States Census Bureau. Retrieved 2015-07-11.
- 1 2 "Monthly Averages for Lewistown, Illinois". The Weather Channel. Archived from the original on 2012-10-23. Retrieved 2011-01-27.
- ↑ "Fulton County Public and Private Airports". www.tollfreeairline.com. Archived from the original on 2011-10-18.
- ↑ "Population and Housing Unit Estimates". Archived from the original on May 29, 2017. Retrieved June 9, 2017.
- ↑ "U.S. Decennial Census". United States Census Bureau. Archived from the original on May 12, 2015. Retrieved July 5, 2014.
- ↑ "Historical Census Browser". University of Virginia Library. Archived from the original on August 16, 2012. Retrieved July 5, 2014.
- ↑ "Population of Counties by Decennial Census: 1900 to 1990". United States Census Bureau. Archived from the original on April 24, 2014. Retrieved July 5, 2014.
- ↑ "Census 2000 PHC-T-4. Ranking Tables for Counties: 1990 and 2000" (PDF). United States Census Bureau. Archived (PDF) from the original on December 18, 2014. Retrieved July 5, 2014.
- 1 2 3 "DP-1 Profile of General Population and Housing Characteristics: 2010 Demographic Profile Data". United States Census Bureau. Retrieved 2015-07-11.
- ↑ "DP02 SELECTED SOCIAL CHARACTERISTICS IN THE UNITED STATES – 2006-2010 American Community Survey 5-Year Estimates". United States Census Bureau. Retrieved 2015-07-11.
- ↑ "DP03 SELECTED ECONOMIC CHARACTERISTICS – 2006-2010 American Community Survey 5-Year Estimates". United States Census Bureau. Retrieved 2015-07-11.
- ↑ Leip, David. "Dave Leip's Atlas of U.S. Presidential Elections". uselectionatlas.org. Archived from the original on 2018-03-23.
- General
External links
Places adjacent to Fulton County, Illinois | ||||||||||
|---|---|---|---|---|---|---|---|---|---|---|
| ||||||||||
Municipalities and communities of Fulton County, Illinois, United States | ||
|---|---|---|
| Cities | ||
| Town | ||
| Villages | ||
| Townships | ||
| Unincorporated communities | ||
| Ghost towns | ||
| Footnotes | ‡This populated place also has portions in an adjacent county or counties | |
