Kankakee County, Illinois
| Kankakee County, Illinois | |
|---|---|
 | |
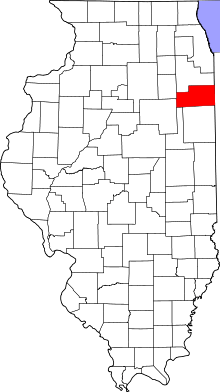 Location in the U.S. state of Illinois | |
 Illinois's location in the U.S. | |
| Founded | 11 February 1853 |
| Named for | Kankakee River |
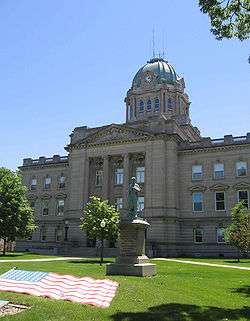
| Seat | Kankakee |
| Largest city | Kankakee |
| Area | |
| • Total | 681 sq mi (1,764 km2) |
| • Land | 677 sq mi (1,753 km2) |
| • Water | 4.8 sq mi (12 km2), 0.7% |
| Population | |
| • (2010) | 113,449 |
| • Density | 168/sq mi (65/km2) |
| Congressional district | 2nd |
| Time zone | Central: UTC−6/−5 |
| Website |
www |
Kankakee County is a county located in the U.S. state of Illinois. According to the 2010 census, it has a population of 113,449.[1] Its county seat is Kankakee.[2]
Kankakee County comprises the Kankakee, IL Metropolitan Statistical Area.
History
Starting in the 1770s, if not earlier, the area that is now Kankakee County was dominated by the Pottawatami.
French Canadian Settlers came to Kankakee County in 1834, after the federal government signed the Treaty of Camp Tippecanoe in 1832. They were soon joined by migrants from New York and Vermont, mostly locating in Momence, Illinois. In the 1840s, most of the migrants were French Canadians or Metis and they settled in such places as Bourbonnais.
An act of the Illinois Legislature created Kankakee County out of the north part of Iroquois County and the south part of Will County in February 1853. The six original townships were Yellowhead, Rockville, Bourbonnais, Momence, Aroma Park, and Limestone. The population of the new county was about 8,000. In 1855 the two western townships (Norton and Essex) were taken from Vermilion County and added to Kankakee County. The County was named for the Kankakee River.
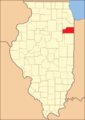 Kankakee County at the time of its creation in 1853
Geography
According to the U.S. Census Bureau, the county has a total area of 681 square miles (1,760 km2), of which 677 square miles (1,750 km2) is land and 4.8 square miles (12 km2) (0.7%) is water.[3]
Climate and weather
| Kankakee, Illinois | ||||||||||||||||||||||||||||||||||||||||||||||||||||||||||||
|---|---|---|---|---|---|---|---|---|---|---|---|---|---|---|---|---|---|---|---|---|---|---|---|---|---|---|---|---|---|---|---|---|---|---|---|---|---|---|---|---|---|---|---|---|---|---|---|---|---|---|---|---|---|---|---|---|---|---|---|---|
| Climate chart (explanation) | ||||||||||||||||||||||||||||||||||||||||||||||||||||||||||||
| ||||||||||||||||||||||||||||||||||||||||||||||||||||||||||||
| ||||||||||||||||||||||||||||||||||||||||||||||||||||||||||||
In recent years, average temperatures in the county seat of Kankakee have ranged from a low of 12 °F (−11 °C) in January to a high of 86 °F (30 °C) in July, although a record low of −29 °F (−34 °C) was recorded in January 1985 and a record high of 107 °F (42 °C) was recorded in August 1988. Average monthly precipitation ranged from 1.62 inches (41 mm) in February to 4.54 inches (115 mm) in May.[4]
Major highways
Adjacent counties
- Will County – north
- Lake County, Indiana – northeast
- Newton County, Indiana – east
- Iroquois County – south
- Ford County – southwest
- Livingston County – west
- Grundy County – northwest
Demographics
| Historical population | |||
|---|---|---|---|
| Census | Pop. | %± | |
| 1860 | 15,412 | — | |
| 1870 | 24,352 | 58.0% | |
| 1880 | 25,047 | 2.9% | |
| 1890 | 28,732 | 14.7% | |
| 1900 | 37,154 | 29.3% | |
| 1910 | 40,752 | 9.7% | |
| 1920 | 44,920 | 10.2% | |
| 1930 | 50,095 | 11.5% | |
| 1940 | 60,877 | 21.5% | |
| 1950 | 73,524 | 20.8% | |
| 1960 | 92,063 | 25.2% | |
| 1970 | 97,250 | 5.6% | |
| 1980 | 102,926 | 5.8% | |
| 1990 | 96,255 | −6.5% | |
| 2000 | 103,833 | 7.9% | |
| 2010 | 113,449 | 9.3% | |
| Est. 2016 | 110,008 | [5] | −3.0% |
| U.S. Decennial Census[6] 1790-1960[7] 1900-1990[8] 1990-2000[9] 2010-2013[1] | |||
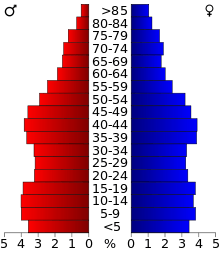
As of the 2010 United States Census, there were 113,449 people, 41,511 households, and 28,680 families residing in the county.[10] The population density was 167.7 inhabitants per square mile (64.7/km2). There were 45,246 housing units at an average density of 66.9 per square mile (25.8/km2).[3] The racial makeup of the county was 77.6% white, 15.1% black or African American, 0.9% Asian, 0.3% American Indian, 4.0% from other races, and 2.1% from two or more races. Those of Hispanic or Latino origin made up 9.0% of the population.[10] In terms of ancestry, 26.5% were German, 14.2% were Irish, 7.4% were English, 6.7% were Italian, 5.8% were Polish, and 3.6% were American.[11]
Of the 41,511 households, 35.2% had children under the age of 18 living with them, 49.1% were married couples living together, 14.7% had a female householder with no husband present, 30.9% were non-families, and 25.5% of all households were made up of individuals. The average household size was 2.61 and the average family size was 3.13. The median age was 36.7 years.[10]
The median income for a household in the county was $50,484 and the median income for a family was $59,998. Males had a median income of $49,858 versus $32,247 for females. The per capita income for the county was $22,888. About 10.8% of families and 15.0% of the population were below the poverty line, including 20.6% of those under age 18 and 8.4% of those age 65 or over.[12]
Cities and towns
Cities
Villages
Unincorporated places
- Deselm
- Garden of Eden
- Illinoi (partial)
- Pembroke
- Sollitt
- Yeager
- Pewing
Townships
Kankakee County is divided into seventeen townships:
Politics
| Year | Republican | Democratic | Third Parties |
|---|---|---|---|
| 2016 | 53.1% 25,129 | 40.1% 18,971 | 6.8% 3,205 |
| 2012 | 50.7% 23,136 | 47.3% 21,595 | 2.0% 923 |
| 2008 | 46.8% 22,527 | 51.4% 24,750 | 1.8% 861 |
| 2004 | 54.9% 24,739 | 44.4% 20,003 | 0.7% 294 |
| 2000 | 49.9% 20,049 | 47.7% 19,180 | 2.4% 954 |
| 1996 | 41.4% 14,595 | 47.7% 16,820 | 10.9% 3,826 |
| 1992 | 38.5% 15,411 | 43.0% 17,229 | 18.6% 7,431 |
| 1988 | 56.8% 20,316 | 42.4% 15,147 | 0.8% 292 |
| 1984 | 60.0% 23,807 | 38.4% 15,246 | 1.5% 612 |
| 1980 | 58.3% 23,810 | 35.8% 14,626 | 6.0% 2,437 |
| 1976 | 54.6% 23,003 | 43.7% 18,394 | 1.7% 711 |
| 1972 | 66.5% 26,866 | 33.3% 13,434 | 0.2% 73 |
| 1968 | 52.4% 20,025 | 37.8% 14,460 | 9.8% 3,765 |
| 1964 | 43.6% 16,082 | 56.4% 20,792 | |
| 1960 | 54.2% 20,311 | 45.7% 17,115 | 0.1% 26 |
| 1956 | 66.4% 21,993 | 33.5% 11,088 | 0.1% 47 |
| 1952 | 61.4% 20,279 | 38.3% 12,636 | 0.3% 90 |
| 1948 | 57.7% 15,699 | 41.6% 11,305 | 0.7% 197 |
| 1944 | 57.2% 15,256 | 42.5% 11,342 | 0.3% 90 |
| 1940 | 53.6% 15,998 | 46.0% 13,716 | 0.4% 124 |
| 1936 | 41.2% 10,935 | 49.6% 13,162 | 9.2% 2,441 |
| 1932 | 43.9% 10,873 | 54.7% 13,555 | 1.5% 364 |
| 1928 | 53.4% 11,905 | 46.0% 10,247 | 0.6% 127 |
| 1924 | 67.5% 12,462 | 13.5% 2,488 | 19.1% 3,521 |
| 1920 | 79.3% 12,853 | 17.5% 2,828 | 3.2% 520 |
| 1916 | 62.3% 10,594 | 35.8% 6,096 | 1.9% 319 |
| 1912 | 36.4% 3,178 | 29.0% 2,532 | 34.6% 3,018 |
| 1908 | 68.5% 5,999 | 28.1% 2,461 | 3.5% 303 |
| 1904 | 74.9% 6,162 | 20.1% 1,652 | 5.0% 410 |
| 1900 | 67.4% 5,798 | 31.1% 2,674 | 1.5% 125 |
| 1896 | 68.2% 5,471 | 29.5% 2,370 | 2.3% 181 |
| 1892 | 54.4% 3,577 | 42.0% 2,763 | 3.6% 233 |
Although a typical prosperous Yankee “collar”-type county in the century following the Civil War, Kankakee County is currently considered a Republican-leaning swing county. In the 2008 Presidential Election, Kankakee County voted 52 percent in favor of Illinois native Barack Obama (D), giving 47 percent to John McCain (R). However, in the 2004 Presidential Election, Kankakee County voted 55 percent in favor of George W. Bush (R) and 44 percent for John Kerry (D).
Kankakee County is in Illinois's 2nd congressional district, represented by Democrat Robin Kelly (D-Matteson).
Kankakee County has produced three governors: Len Small (R), Samuel H. Shapiro (D), and George H. Ryan (R).
In December 2016, Kankakee County became the only county in Illinois to have a Libertarian county board member when Jim Byrne of Bradley left the Republican Party to join the Libertarian Party.[14] Byrne was elected in 2016 as a Republican, and since there is no official Libertarian party in Illinois he serves as a Republican.[15]
See also
References
- Specific
- 1 2 "State & County QuickFacts". United States Census Bureau. Archived from the original on 12 July 2011. Retrieved 6 July 2014.
- ↑ "Find a County". National Association of Counties. Archived from the original on 31 May 2011. Retrieved 7 June 2011.
- 1 2 "Population, Housing Units, Area, and Density: 2010 - County". United States Census Bureau. Retrieved 12 July 2015.
- 1 2 "Monthly Averages for Kankakee, Illinois". The Weather Channel. Archived from the original on 1 September 2010. Retrieved 27 January 2011.
- ↑ "Population and Housing Unit Estimates". Archived from the original on 29 May 2017. Retrieved 9 June 2017.
- ↑ "U.S. Decennial Census". United States Census Bureau. Archived from the original on 12 May 2015. Retrieved 6 July 2014.
- ↑ "Historical Census Browser". University of Virginia Library. Archived from the original on August 16, 2012. Retrieved 6 July 2014.
- ↑ "Population of Counties by Decennial Census: 1900 to 1990". United States Census Bureau. Archived from the original on 24 April 2014. Retrieved 6 July 2014.
- ↑ "Census 2000 PHC-T-4. Ranking Tables for Counties: 1990 and 2000" (PDF). United States Census Bureau. Archived (PDF) from the original on 18 December 2014. Retrieved 6 July 2014.
- 1 2 3 "Profile of General Population and Housing Characteristics: 2010 Demographic Profile Data". United States Census Bureau. Retrieved 12 July 2015.
- ↑ "Selected Social Characteristics in the United States – 2006-2010 American Community Survey 5-Year Estimates". United States Census Bureau. Retrieved 12 July 2015.
- ↑ "Selected Economic Characteristics – 2006-2010 American Community Survey 5-Year Estimates". United States Census Bureau. Retrieved 12 July 2015.
- ↑ Leip, David. "Dave Leip's Atlas of U.S. Presidential Elections". uselectionatlas.org. Archived from the original on 23 March 2018. Retrieved 6 May 2018.
- ↑ "Kankakee County Board's Byrne Joins Libertarian Party of Illinois" (Press release). Springfield, Illinois: Libertarian Party of Illinois. 7 December 2016. Archived from the original on 18 April 2017. Retrieved 18 April 2017.
- ↑ "Kankakee Election Results". Archived from the original on 12 December 2016.
- General
- Forstall, Richard L. (editor) (1996). Population of states and counties of the United States: 1790 to 1990 : from the twenty-one decennial censuses. United States Department of Commerce, Bureau of the Census, Population Division. ISBN 0-934213-48-8.
External links
| Wikimedia Commons has media related to Kankakee County, Illinois. |
Places adjacent to Kankakee County, Illinois | ||||||||||
|---|---|---|---|---|---|---|---|---|---|---|
| ||||||||||
Municipalities and communities of Kankakee County, Illinois, United States | ||
|---|---|---|
| Cities | ||
| Villages | ||
| Townships | ||
| Unincorporated communities |
| |
| Footnotes | ‡This populated place also has portions in an adjacent county or counties | |
| Major city |  | |
|---|---|---|
| Cities (over 30,000 in 2010) | ||
| Towns and villages (over 30,000 in 2010) |
| |
| Counties | ||
| Regions | ||
| Sub-regions | ||
