United States presidential election in Michigan, 2016
|
| ||||||||||||||||||||||||||
| ||||||||||||||||||||||||||
| Turnout |
64.87% | |||||||||||||||||||||||||
|---|---|---|---|---|---|---|---|---|---|---|---|---|---|---|---|---|---|---|---|---|---|---|---|---|---|---|
| ||||||||||||||||||||||||||
 County results
| ||||||||||||||||||||||||||
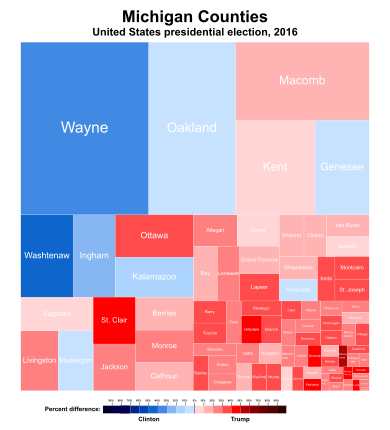
 Results by county showing number of votes by size and candidates by color[2] | ||||||||||||||||||||||||||
| ||||||||||||||||||||||||||
.jpg)

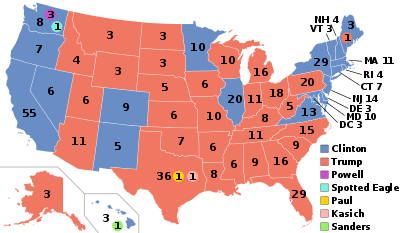
The 2016 United States presidential election in Michigan was won by Donald Trump on November 8, 2016, with 47.50% of the total votes, over Hillary Clinton's 47.27%. All of Michigan's 16 Electoral Votes were assigned to Trump, contributing to his victory in the 2016 United States presidential election.
Michigan's March 8, 2016 primary was an open primary that included the Democratic, and Republican parties.
On November 24, 2016, Trump was declared the winner by the Detroit Free Press. The votes were certified by each county and submitted to the Michigan Secretary of State.[3] By winning Michigan, Trump became the first Republican candidate to win the state since George H. W. Bush in 1988.
After a recount, the Michigan Board of Canvassers certified Trump's lead of 10,704 votes over Clinton, a 0.23% margin, on November 28.[4] On this same day, Green Party candidate Jill Stein requested a second recount, by hand. The deadline to request a recount was then set at 2 p.m. on Wednesday, November 30. The second recount was halted on December 8 after a federal judge issued an order to Michigan's Board of Elections, making Trump's win in the state official.
Primary elections
Democratic primary

Results
Four candidates appeared on the Democratic presidential primary ballot:[5]
| Michigan Democratic primary, March 8, 2016 | |||||
|---|---|---|---|---|---|
| Candidate | Popular vote | Estimated delegates | |||
| Count | Percentage | Pledged | Unpledged | Total | |
| Bernie Sanders | 598,943 | 49.68% | 67 | 0 | 67 |
| Hillary Clinton | 581,775 | 48.26% | 63 | 10 | 73 |
| Uncommitted | 21,601 | 1.79% | 0 | 7 | 7 |
| Martin O'Malley (withdrawn) | 2,363 | 0.20% | |||
| Rocky De La Fuente | 870 | 0.07% | |||
| Total | 1,205,552 | 100% | 130 | 17 | 147 |
| Source: The Green Papers | |||||
Republican primary
Four candidates participated in the Republican primary.[6]

Debate
Detroit, March 3
| Candidate | Airtime[7] | Polls[8] |
|---|---|---|
| Trump | 26:40 | 35.6% |
| Cruz | 19:23 | 19.8% |
| Rubio | 13:32 | 17.4% |
| Kasich | 15:20 | 8.8% |
The eleventh debate was held on March 3, 2016, at the Fox Theatre in downtown Detroit, Michigan.[9] It was the third debate to air on Fox News Channel.[10] Special Report anchor Bret Baier, The Kelly File anchor Megyn Kelly and Fox News Sunday host Chris Wallace served as moderators.[11] It led into the Maine, Kansas, Kentucky, Louisiana, Michigan, Mississippi, Idaho, and Hawaii contests. Fox announced that in order for candidates to qualify, they must have at least 3 percent support in the five most recent national polls by March 1 at 5 pm.[12] Ben Carson said on March 2 he would not be attending the debate.[13][14][15] During the debate, Ted Cruz had a small speck of white material on his lip.[16] The speck became viral with thousands of web searches per minute during the debate on "Ted Cruz nose".[17][18][19][20][21][22] The debate also drew controversy for when opponents claimed that Trump made an allusion to his penis in response to Rubio's comment about the size of his hands.[23]
Results
Thirteen candidates appeared on the Republican presidential primary ballot:[5]
| Michigan Republican primary, March 8, 2016 | |||||
|---|---|---|---|---|---|
| Candidate | Votes | Percentage | Actual delegate count | ||
| Bound | Unbound | Total | |||
| 483,753 | 36.55% | 25 | 0 | 25 | |
| Ted Cruz | 326,617 | 24.68% | 17 | 0 | 17 |
| John Kasich | 321,115 | 24.26% | 17 | 0 | 17 |
| Marco Rubio | 123,587 | 9.34% | 0 | 0 | 0 |
| Ben Carson (withdrawn) | 21,349 | 1.61% | 0 | 0 | 0 |
| Uncommitted (withdrawn) | 22,824 | 1.72% | 0 | 0 | 0 |
| Jeb Bush (withdrawn) | 10,685 | 0.81% | 0 | 0 | 0 |
| Rand Paul (withdrawn) | 3,774 | 0.29% | 0 | 0 | 0 |
| Chris Christie (withdrawn) | 3,116 | 0.24% | 0 | 0 | 0 |
| Mike Huckabee (withdrawn) | 2,603 | 0.20% | 0 | 0 | 0 |
| Rick Santorum (withdrawn) | 1,722 | 0.13% | 0 | 0 | 0 |
| Carly Fiorina (withdrawn) | 1,415 | 0.11% | 0 | 0 | 0 |
| George Pataki (withdrawn) | 591 | 0.04% | 0 | 0 | 0 |
| Lindsey Graham (withdrawn) | 438 | 0.03% | 0 | 0 | 0 |
| Unprojected delegates: | 0 | 0 | 0 | ||
| Total: | 1,323,589 | 100.00% | 59 | 0 | 59 |
| Source: The Green Papers | |||||
General election
Although won by Democratic candidates in every election since 1992, sometimes by clear margins, in 2016 Michigan was considered a swing state and received much attention from Republican party candidate Donald Trump. Trump was able to win the state for the first time since George H. W. Bush won it in 1988,[24] albeit by a narrow 0.23% margin of victory. On Election Day, in Michigan, Detroit Free Press had prematurely called the state for Clinton at 9:15pm before retracting the call three hours later,[25] an error which had been common in many sources at the 2000 election, in the states of Florida and New Mexico.
Polling
Minor candidates
The following were given write-in status:[26]
- Cherunda Fox
- Ben Hartnell
- Tom Hoefling
- Laurence Kotlikoff
- Evan McMullin
- Mike Maturen
- Monica Moorehead
Results
| United States presidential election in Michigan, 2016 | ||||||
|---|---|---|---|---|---|---|
| Party | Candidate | Running mate | Votes | Percentage | Electoral votes | |
| Republican | Donald Trump | Mike Pence | 2,279,543 | 47.50% | 16 | |
| Democratic | Hillary Clinton | Tim Kaine | 2,268,839 | 47.27% | 0 | |
| Libertarian | Gary Johnson | William Weld | 172,136 | 3.59% | 0 | |
| Green | Jill Stein | Ajamu Baraka | 51,463 | 1.07% | 0 | |
| U.S Taxpayers | Darrell Castle | Scott Bradley | 16,139 | 0.33% | 0 | |
| Independent | Evan McMullin (write-in) | Mindy Finn | 8,177 | 0.17% | 0 | |
| Socialist Party | Emidio Soltysik | Angela Nicole Walker | 2,209 | 0.05% | 0 | |
| - | Others | - | 778 | 0.02% | 0 | |
| Totals | 4,799,284 | 100.00% | 16 | |||
Results by county
Final official results from the Michigan Secretary of State.[2]
| County | Candidate | Total | ||||||
|---|---|---|---|---|---|---|---|---|
| Trump | Clinton | Johnson | Stein | (other) | ||||
| Alcona | percent | 67.78% | 27.94% | 2.65% | 0.87% | 0.76% | 100.00% | |
| votes | 4,201 | 1,732 | 164 | 54 | 47 | 6,198 | ||
| Alger | percent | 57.22% | 36.81% | 3.92% | 1.48% | 0.58% | 100.00% | |
| votes | 2,585 | 1,663 | 177 | 67 | 26 | 4,518 | ||
| Allegan | percent | 61.28% | 32.36% | 4.50% | 1.07% | 0.80% | 100.00% | |
| votes | 34,183 | 18,050 | 2,513 | 596 | 444 | 55,786 | ||
| Alpena | percent | 61.85% | 33.18% | 3.39% | 1.09% | 0.50% | 100.00% | |
| votes | 9,090 | 4,877 | 498 | 160 | 73 | 14,698 | ||
| Antrim | percent | 62.35% | 32.75% | 3.38% | 1.07% | 0.44% | 100.00% | |
| votes | 8,469 | 4,448 | 459 | 146 | 60 | 13,582 | ||
| Arenac | percent | 64.32% | 30.98% | 3.51% | 0.78% | 0.42% | 100.00% | |
| votes | 4,950 | 2,384 | 270 | 60 | 32 | 7,696 | ||
| Baraga | percent | 61.83% | 33.12% | 3.04% | 1.40% | 0.60% | 100.00% | |
| votes | 2,158 | 1,156 | 106 | 49 | 21 | 3,490 | ||
| Barry | percent | 63.31% | 30.05% | 4.70% | 1.14% | 0.80% | 100.00% | |
| votes | 19,202 | 9,114 | 1,424 | 346 | 243 | 30,329 | ||
| Bay | percent | 53.47% | 40.85% | 4.13% | 1.03% | 0.52% | 100.00% | |
| votes | 28,328 | 21,642 | 2,189 | 544 | 274 | 52,977 | ||
| Benzie | percent | 54.16% | 40.16% | 3.73% | 1.46% | 0.49% | 100.00% | |
| votes | 5,539 | 4,108 | 382 | 149 | 50 | 10,228 | ||
| Berrien | percent | 53.65% | 40.95% | 3.83% | 0.92% | 0.65% | 100.00% | |
| votes | 38,647 | 29,495 | 2,760 | 662 | 467 | 72,031 | ||
| Branch | percent | 66.73% | 28.65% | 3.30% | 0.85% | 0.47% | 100.00% | |
| votes | 11,786 | 5,061 | 582 | 151 | 83 | 17,663 | ||
| Calhoun | percent | 53.47% | 41.01% | 3.88% | 1.08% | 0.56% | 100.00% | |
| votes | 31,494 | 24,157 | 2,284 | 635 | 332 | 58,902 | ||
| Cass | percent | 63.04% | 32.18% | 3.33% | 0.88% | 0.58% | 100.00% | |
| votes | 14,243 | 7,270 | 753 | 199 | 130 | 22,595 | ||
| Charlevoix | percent | 59.46% | 35.21% | 3.65% | 1.22% | 0.47% | 100.00% | |
| votes | 8,674 | 5,137 | 532 | 178 | 68 | 14,589 | ||
| Cheboygan | percent | 63.51% | 31.47% | 3.39% | 1.02% | 0.61% | 100.00% | |
| votes | 8,683 | 4,302 | 463 | 140 | 84 | 13,672 | ||
| Chippewa | percent | 59.02% | 34.80% | 3.77% | 1.57% | 0.83% | 100.00% | |
| votes | 9,122 | 5,379 | 583 | 243 | 129 | 15,456 | ||
| Clare | percent | 63.52% | 31.74% | 3.25% | 0.90% | 0.60% | 100.00% | |
| votes | 8,505 | 4,249 | 435 | 120 | 80 | 13,389 | ||
| Clinton | percent | 53.22% | 40.57% | 4.64% | 0.93% | 0.64% | 100.00% | |
| votes | 21,636 | 16,492 | 1,886 | 379 | 262 | 40,655 | ||
| Crawford | percent | 63.62% | 30.83% | 3.90% | 0.96% | 0.69% | 100.00% | |
| votes | 4,354 | 2,110 | 267 | 66 | 47 | 6,844 | ||
| Delta | percent | 60.14% | 34.80% | 3.57% | 0.98% | 0.50% | 100.00% | |
| votes | 11,121 | 6,436 | 660 | 182 | 93 | 18,492 | ||
| Dickinson | percent | 65.17% | 29.80% | 3.42% | 0.93% | 0.68% | 100.00% | |
| votes | 8,580 | 3,923 | 450 | 123 | 89 | 13,165 | ||
| Eaton | percent | 49.11% | 44.36% | 4.66% | 1.07% | 0.81% | 100.00% | |
| votes | 27,609 | 24,938 | 2,618 | 602 | 454 | 56,221 | ||
| Emmet | percent | 56.46% | 37.08% | 4.29% | 1.48% | 0.69% | 100.00% | |
| votes | 10,616 | 6,972 | 806 | 279 | 129 | 18,802 | ||
| Genesee | percent | 42.88% | 52.34% | 3.17% | 1.12% | 0.49% | 100.00% | |
| votes | 84,175 | 102,751 | 6,221 | 2,193 | 956 | 196,296 | ||
| Gladwin | percent | 65.14% | 30.42% | 3.15% | 0.70% | 0.59% | 100.00% | |
| votes | 8,124 | 3,794 | 393 | 87 | 74 | 12,472 | ||
| Gogebic | percent | 54.82% | 39.91% | 2.91% | 1.61% | 0.75% | 100.00% | |
| votes | 4,018 | 2,925 | 213 | 118 | 55 | 7,329 | ||
| Grand Traverse | percent | 53.14% | 40.64% | 4.17% | 1.47% | 0.59% | 100.00% | |
| votes | 27,413 | 20,965 | 2,149 | 756 | 306 | 51,589 | ||
| Gratiot | percent | 60.01% | 34.41% | 4.17% | 0.85% | 0.56% | 100.00% | |
| votes | 9,880 | 5,666 | 687 | 140 | 92 | 16,465 | ||
| Hillsdale | percent | 70.69% | 24.07% | 3.51% | 0.92% | 0.81% | 100.00% | |
| votes | 14,095 | 4,799 | 700 | 184 | 162 | 19,940 | ||
| Houghton | percent | 54.24% | 38.52% | 5.36% | 1.38% | 0.50% | 100.00% | |
| votes | 8,475 | 6,018 | 837 | 216 | 78 | 15,624 | ||
| Huron | percent | 67.17% | 28.77% | 3.00% | 0.65% | 0.41% | 100.00% | |
| votes | 10,692 | 4,579 | 477 | 104 | 65 | 15,917 | ||
| Ingham | percent | 33.45% | 60.33% | 4.05% | 1.41% | 0.77% | 100.00% | |
| votes | 43,868 | 79,110 | 5,305 | 1,846 | 1,009 | 131,138 | ||
| Ionia | percent | 61.95% | 31.10% | 5.05% | 1.07% | 0.84% | 100.00% | |
| votes | 16,635 | 8,352 | 1,355 | 286 | 226 | 26,854 | ||
| Iosco | percent | 62.46% | 32.52% | 3.44% | 1.09% | 0.49% | 100.00% | |
| votes | 8,345 | 4,345 | 459 | 146 | 66 | 13,361 | ||
| Iron | percent | 62.18% | 33.91% | 2.96% | 0.61% | 0.34% | 100.00% | |
| votes | 3,675 | 2,004 | 175 | 36 | 20 | 5,910 | ||
| Isabella | percent | 48.59% | 44.91% | 4.30% | 1.56% | 0.63% | 100.00% | |
| votes | 12,338 | 11,404 | 1,093 | 396 | 161 | 25,392 | ||
| Jackson | percent | 57.11% | 37.02% | 4.16% | 1.02% | 0.68% | 100.00% | |
| votes | 39,793 | 25,795 | 2,901 | 713 | 475 | 69,677 | ||
| Kalamazoo | percent | 40.41% | 53.17% | 4.47% | 1.29% | 0.66% | 100.00% | |
| votes | 51,034 | 67,148 | 5,644 | 1,634 | 839 | 126,299 | ||
| Kalkaska | percent | 69.24% | 25.81% | 3.20% | 1.34% | 0.41% | 100.00% | |
| votes | 6,116 | 2,280 | 283 | 118 | 36 | 8,833 | ||
| Kent | percent | 48.08% | 45.00% | 4.62% | 1.30% | 1.00% | 100.00% | |
| votes | 148,180 | 138,683 | 14,246 | 3,996 | 3,079 | 308,184 | ||
| Keweenaw | percent | 56.76% | 36.75% | 4.32% | 1.39% | 0.77% | 100.00% | |
| votes | 814 | 527 | 62 | 20 | 11 | 1,434 | ||
| Lake | percent | 59.29% | 36.39% | 2.85% | 0.90% | 0.56% | 100.00% | |
| votes | 3,159 | 1,939 | 152 | 48 | 30 | 5,328 | ||
| Lapeer | percent | 66.48% | 28.18% | 3.83% | 0.94% | 0.57% | 100.00% | |
| votes | 30,037 | 12,734 | 1,730 | 426 | 256 | 45,183 | ||
| Leelanau | percent | 49.05% | 45.90% | 3.46% | 1.33% | 0.25% | 100.00% | |
| votes | 7,239 | 6,774 | 510 | 197 | 37 | 14,757 | ||
| Lenawee | percent | 57.53% | 36.46% | 4.45% | 0.98% | 0.58% | 100.00% | |
| votes | 26,430 | 16,750 | 2,044 | 449 | 266 | 45,939 | ||
| Livingston | percent | 62.04% | 32.48% | 4.03% | 0.86% | 0.59% | 100.00% | |
| votes | 65,680 | 34,384 | 4,266 | 911 | 625 | 105,866 | ||
| Luce | percent | 68.09% | 26.41% | 3.99% | 1.12% | 0.39% | 100.00% | |
| votes | 1,756 | 681 | 103 | 29 | 10 | 2,579 | ||
| Mackinac | percent | 61.41% | 34.20% | 2.95% | 1.10% | 0.34% | 100.00% | |
| votes | 3,744 | 2,085 | 180 | 67 | 21 | 6,097 | ||
| Macomb | percent | 53.58% | 42.05% | 3.07% | 0.93% | 0.38% | 100.00% | |
| votes | 224,665 | 176,317 | 12,862 | 3,886 | 1,582 | 419,312 | ||
| Manistee | percent | 54.89% | 39.52% | 3.62% | 1.59% | 0.39% | 100.00% | |
| votes | 6,915 | 4,979 | 456 | 200 | 49 | 12,599 | ||
| Marquette | percent | 44.41% | 48.65% | 4.42% | 1.77% | 0.75% | 100.00% | |
| votes | 14,646 | 16,042 | 1,458 | 583 | 247 | 32,976 | ||
| Mason | percent | 57.92% | 35.96% | 4.09% | 1.29% | 0.74% | 100.00% | |
| votes | 8,505 | 5,281 | 601 | 189 | 109 | 14,685 | ||
| Mecosta | percent | 60.02% | 33.94% | 4.06% | 1.33% | 0.64% | 100.00% | |
| votes | 10,305 | 5,827 | 697 | 229 | 110 | 17,168 | ||
| Menominee | percent | 62.24% | 32.87% | 3.26% | 1.10% | 0.54% | 100.00% | |
| votes | 6,702 | 3,539 | 351 | 118 | 58 | 10,768 | ||
| Midland | percent | 56.10% | 36.78% | 5.21% | 0.96% | 0.95% | 100.00% | |
| votes | 23,846 | 15,635 | 2,216 | 407 | 402 | 42,506 | ||
| Missaukee | percent | 73.61% | 21.39% | 3.29% | 1.01% | 0.70% | 100.00% | |
| votes | 5,386 | 1,565 | 241 | 74 | 51 | 7,317 | ||
| Monroe | percent | 58.29% | 36.19% | 4.02% | 0.95% | 0.54% | 100.00% | |
| votes | 43,261 | 26,863 | 2,985 | 707 | 402 | 74,218 | ||
| Montcalm | percent | 63.54% | 29.59% | 4.95% | 1.10% | 0.83% | 100.00% | |
| votes | 16,907 | 7,874 | 1,316 | 292 | 220 | 26,609 | ||
| Montmorency | percent | 69.83% | 25.69% | 3.17% | 0.88% | 0.42% | 100.00% | |
| votes | 3,498 | 1,287 | 159 | 44 | 21 | 5,009 | ||
| Muskegon | percent | 46.26% | 47.77% | 4.07% | 1.23% | 0.65% | 100.00% | |
| votes | 36,127 | 37,304 | 3,182 | 964 | 511 | 78,088 | ||
| Newaygo | percent | 67.02% | 27.44% | 3.88% | 0.87% | 0.80% | 100.00% | |
| votes | 15,173 | 6,212 | 878 | 197 | 180 | 22,640 | ||
| Oakland | percent | 43.51% | 51.62% | 3.48% | 0.96% | 0.42% | 100.00% | |
| votes | 289,203 | 343,070 | 23,154 | 6,396 | 2,791 | 664,614 | ||
| Oceana | percent | 60.59% | 33.30% | 4.12% | 0.97% | 1.01% | 100.00% | |
| votes | 7,228 | 3,973 | 492 | 116 | 121 | 11,930 | ||
| Ogemaw | percent | 65.73% | 29.17% | 3.40% | 1.14% | 0.57% | 100.00% | |
| votes | 6,827 | 3,030 | 353 | 118 | 59 | 10,387 | ||
| Ontonagon | percent | 60.30% | 34.33% | 3.74% | 0.85% | 0.79% | 100.00% | |
| votes | 2,066 | 1,176 | 128 | 29 | 27 | 3,426 | ||
| Osceola | percent | 69.15% | 25.50% | 3.78% | 0.90% | 0.67% | 100.00% | |
| votes | 7,336 | 2,705 | 401 | 96 | 71 | 10,609 | ||
| Oscoda | percent | 69.80% | 25.63% | 3.44% | 0.44% | 0.69% | 100.00% | |
| votes | 2,843 | 1,044 | 140 | 18 | 28 | 4,073 | ||
| Otsego | percent | 65.93% | 28.36% | 3.84% | 1.30% | 0.57% | 100.00% | |
| votes | 8,266 | 3,556 | 482 | 163 | 71 | 12,538 | ||
| Ottawa | percent | 61.98% | 31.51% | 4.43% | 0.99% | 1.09% | 100.00% | |
| votes | 88,467 | 44,973 | 6,324 | 1,418 | 1,552 | 142,734 | ||
| Presque Isle | percent | 62.18% | 33.25% | 3.28% | 0.69% | 0.60% | 100.00% | |
| votes | 4,488 | 2,400 | 237 | 50 | 43 | 7,218 | ||
| Roscommon | percent | 62.43% | 32.87% | 3.17% | 1.09% | 0.44% | 100.00% | |
| votes | 8,141 | 4,287 | 413 | 142 | 58 | 13,041 | ||
| Saginaw | percent | 48.21% | 47.07% | 3.39% | 0.83% | 0.50% | 100.00% | |
| votes | 45,469 | 44,396 | 3,199 | 780 | 476 | 94,320 | ||
| Sanilac | percent | 69.85% | 25.32% | 3.44% | 0.88% | 0.51% | 100.00% | |
| votes | 13,446 | 4,873 | 662 | 170 | 98 | 19,249 | ||
| Schoolcraft | percent | 61.53% | 32.96% | 3.97% | 0.75% | 0.79% | 100.00% | |
| votes | 2,556 | 1,369 | 165 | 31 | 33 | 4,154 | ||
| Shiawassee | percent | 56.37% | 36.78% | 4.87% | 1.06% | 0.92% | 100.00% | |
| votes | 19,230 | 12,546 | 1,660 | 362 | 313 | 34,111 | ||
| St. Clair | percent | 62.88% | 31.48% | 3.81% | 1.36% | 0.47% | 100.00% | |
| votes | 49,051 | 24,553 | 2,972 | 1,062 | 365 | 78,003 | ||
| St. Joseph | percent | 62.65% | 31.68% | 3.93% | 1.22% | 0.52% | 100.00% | |
| votes | 14,884 | 7,526 | 934 | 290 | 123 | 23,757 | ||
| Tuscola | percent | 66.30% | 28.80% | 3.38% | 0.86% | 0.67% | 100.00% | |
| votes | 17,102 | 7,429 | 872 | 221 | 172 | 25,796 | ||
| Van Buren | percent | 53.77% | 39.84% | 4.45% | 1.25% | 0.69% | 100.00% | |
| votes | 17,890 | 13,258 | 1,480 | 417 | 229 | 33,274 | ||
| Washtenaw | percent | 26.85% | 68.13% | 3.10% | 1.31% | 0.61% | 100.00% | |
| votes | 50,631 | 128,483 | 5,840 | 2,472 | 1,152 | 188,578 | ||
| Wayne | percent | 29.44% | 66.78% | 2.42% | 1.00% | 0.36% | 100.00% | |
| votes | 228,993 | 519,444 | 18,801 | 7,784 | 2,816 | 777,838 | ||
| Wexford | percent | 65.37% | 29.00% | 3.78% | 1.26% | 0.59% | 100.00% | |
| votes | 10,000 | 4,436 | 579 | 192 | 91 | 15,298 | ||
| Subtotal Lower Bay | percent | |||||||
| votes | 2,197,525 | 2,213,916 | ||||||
| Subtotal Upper Bay | percent | |||||||
| votes | 82,018 | 54,923 | ||||||
| Total | percent | 47.50% | 47.27% | 3.59% | 1.07% | 0.57% | 100.00% | |
| votes | 2,279,543 | 2,268,839 | 172,136 | 51,463 | 27,303 | 4,799,284 | ||
By congressional district
Trump won 9 of 14 congressional districts.[27]
| District | Trump | Clinton | Representative |
|---|---|---|---|
| 1st | 58% | 37% | Dan Benishek |
| Jack Bergman | |||
| 2nd | 55% | 38% | Bill Huizenga |
| 3rd | 52% | 42% | Justin Amash |
| 4th | 59% | 35% | John Moolenaar |
| 5th | 45% | 50% | Dan Kildee |
| 6th | 51% | 43% | Fred Upton |
| 7th | 56% | 39% | Tim Walberg |
| 8th | 51% | 44% | Mike Bishop |
| 9th | 44% | 51% | Sander Levin |
| 10th | 64% | 32% | Candice Miller |
| Paul Mitchell | |||
| 11th | 49% | 45% | David Trott |
| 12th | 34% | 61% | Debbie Dingell |
| 13th | 18% | 79% | John Conyers Jr. |
| 14th | 18% | 79% | Brenda Lawrence |
Counties that swung from Democratic in 2012 to Republican in 2016
- Bay County (largest city: Bay City)
- Calhoun (largest city: Battle Creek)
- Eaton (largest city: Charlotte)
- Gogebic (largest city: Ironwood)
- Isabella (largest city: Mount Pleasant)
- Lake (largest village: Baldwin)
- Macomb (largest city: Warren)
- Manistee (largest city: Manistee)
- Monroe (largest city: Monroe)
- Saginaw (largest city: Saginaw)
- Shiawassee (largest city: Owosso)
- Van Buren (largest city: South Haven)
See also
| Elections in Michigan | ||||||||||
|---|---|---|---|---|---|---|---|---|---|---|
 | ||||||||||
|
||||||||||
References
- ↑ http://www.michigan.gov/sos/0,4670,7-127-1633_8722-29616--,00.html
- 1 2 Michigan Election Results, Michigan Secretary of State, November 28, 2016
- ↑ Alexander, Davis (November 23, 2016). "Trump defeated Clinton by 10,704 votes in Michigan: unofficial tally". Reuters. Retrieved November 28, 2016.
- ↑ Gray, Kathleen; Egan, Paul (November 28, 2016). "Board of Canvassers certifies Trump victory in Michigan". Detroit Free Press. Retrieved November 28, 2016.
- 1 2 Michigan Secretary of State: March 2016 Primary Information
- ↑ https://www.npr.org/2016/03/03/469116021/mitt-romney-donald-trump-share-harsh-words-in-competing-speeches
- ↑ Sprunt, Barbara. "On The Clock: Trump Still Gets The Most Talking Time". NPR.org. Retrieved 2016-03-04.
- ↑ "RealClearPolitics - Election 2016 - 2016 Republican Presidential Nomination".
- ↑ Gold, Hadas (February 4, 2016). "Bret Baier, Megyn Kelly, Chris Wallace return for March 3 debate". Politico. Retrieved February 4, 2016.
- ↑ "2016 presidential debate schedule: Dates, times, moderators and topics". Politico. Retrieved January 19, 2016.
- ↑ "GOP debate headed to Detroit in March". Detroit News. February 4, 2016.
- ↑ Feldman, Josh. "Fox News Announces Criteria for Next Week's Big GOP Debate". mediaite.com. Retrieved March 1, 2016.
- ↑ Pappas, Alex (March 2, 2016). "Ben Carson: 'I Do Not See A Political Path Forward'". Daily Caller. Retrieved March 2, 2016.
- ↑ "Transcript of the Republican Presidential Debate in Detroit". New York Times. March 3, 2016. Retrieved March 4, 2016.
- ↑ "Republican debate: candidates pledge to support Trump if needed – as it happened". Guardian. March 3, 2016. Retrieved March 4, 2016.
- ↑ "'Little Marco vs. Big Donald' and other jaw-dropping debate moments". MSNBC. Retrieved 2016-03-04.
- ↑ Logan, Ross. "Did Ted Cruz eat a bogey live on TV?". mirror. Retrieved 2016-03-04.
- ↑ Bump, Philip (2016-03-03). "People actually Googled to figure out what was on Ted Cruz's lip". The Washington Post. ISSN 0190-8286. Retrieved 2016-03-04.
- ↑ "What was that thing on Ted Cruz's lip during the Republican debate?". Trail Blazers Blog. Retrieved 2016-03-04.
- ↑ "Ted Cruz appears with mystery white object on his lip at debate". Mail Online. Retrieved 2016-03-04.
- ↑ "So, what did Ted Cruz eat off his lip during the GOP debate?". KENS 5. Retrieved 2016-03-04.
- ↑ "Object on Cruz's lip during debate lights up Twitter - The Boston Globe". BostonGlobe.com. Retrieved 2016-03-04.
- ↑ Gregory Kreig (March 4, 2016). "Donald Trump defends size of his penis". CNN. Retrieved March 4, 2016.
- ↑ Sullivan, Robert David; ‘How the Red and Blue Map Evolved Over the Past Century’; America Magazine in The National Catholic Review; June 29, 2016
- ↑ http://www.deadlinedetroit.com/articles/16178/free_press_embarrasses_itself_with_premature_call_of_clinton_win_in_michigan
- ↑ https://jalp5dai.files.wordpress.com/2016/10/state-level-write-in-candidate-memo-november-2016.pdf
- ↑ https://www.cookpolitical.com/introducing-2017-cook-political-report-partisan-voter-index
- ↑ "Trump flipped 12 counties to win Michigan". Detroit News.
- ↑ Trump Flips Michigan in 2016 after a much anticipated Clinton victory.
External links
- 2016 Michigan Election Results
- RNC 2016 Republican Nominating Process
- Green papers for 2016 primaries, caucuses, and conventions
- 2016 Presidential primaries, ElectionProjection.com