Winnebago County, Illinois
| Winnebago County, Illinois | ||
|---|---|---|
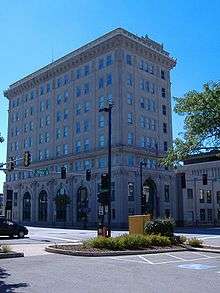 City Hall in Rockford, Illinois. | ||
| ||
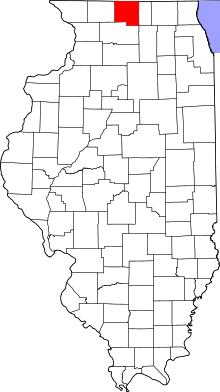 Location in the U.S. state of Illinois | ||
 Illinois's location in the U.S. | ||
| Founded | January 16, 1836 | |
| Named for | Winnebago Tribe | |
| Seat | Rockford | |
| Largest city | Rockford | |
| Area | ||
| • Total | 519 sq mi (1,344 km2) | |
| • Land | 513 sq mi (1,329 km2) | |
| • Water | 5.9 sq mi (15 km2), 1.1% | |
| Population | ||
| • (2010) | 295,266 | |
| • Density | 575/sq mi (222/km2) | |
| Congressional districts | 16th, 17th | |
| Time zone | Central: UTC−6/−5 | |
| Website |
www | |

Winnebago County is a county located in the U.S. state of Illinois. According to the 2010 census, it had a population of 295,266,[1] making it the seventh most populous county in Illinois behind Cook County and its five surrounding collar counties. Its county seat is Rockford.[2]
Winnebago County is the central county of the Rockford Metropolitan Statistical Area.
History
Winnebago County was formed on January 16, 1836 out of Jo Daviess and LaSalle counties. It was named for the Winnebago Tribe of American Indians. At the time the county was founded its inhabitants consisted almost entirely of New Englanders and New England transplants from upstate New York.[3] These were "Yankee" settlers, meaning they were descended from the English Puritans who settled New England during the early 1600s. They made up virtually all of Winnebago County's inhabitants during the first several decades of its history. In this regard the county was similar to most of the northern portion of the state of Illinois, and almost all of the neighboring state of Wisconsin. After the conclusion of the Black Hawk War there was an additional surge of immigration from New England. As a result of this heritage the inhabitants of Winnebago County considered themselves, and functioned as, a cultural expansion of early New England culture.[4] In the Presidential election of 1860, Abraham Lincoln won 3,985 votes in Winnebago County, whereas Steven Douglas only won 817 votes.[5]
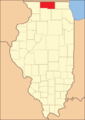 Winnebago County for its first year of existence
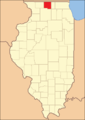 Winnebago County in 1837, reduced to its current borders by the creation of Stephenson and Boone Counties
Geography
According to the U.S. Census Bureau, the county has a total area of 519 square miles (1,340 km2), of which 513 square miles (1,330 km2) is land and 5.9 square miles (15 km2) (1.1%) is water.[6]
Climate and weather
| Rockford, Illinois | ||||||||||||||||||||||||||||||||||||||||||||||||||||||||||||
|---|---|---|---|---|---|---|---|---|---|---|---|---|---|---|---|---|---|---|---|---|---|---|---|---|---|---|---|---|---|---|---|---|---|---|---|---|---|---|---|---|---|---|---|---|---|---|---|---|---|---|---|---|---|---|---|---|---|---|---|---|
| Climate chart (explanation) | ||||||||||||||||||||||||||||||||||||||||||||||||||||||||||||
| ||||||||||||||||||||||||||||||||||||||||||||||||||||||||||||
| ||||||||||||||||||||||||||||||||||||||||||||||||||||||||||||
In recent years, average temperatures in the county seat of Rockford have ranged from a low of 11 °F (−12 °C) in January to a high of 83 °F (28 °C) in July, although a record low of −27 °F (−33 °C) was recorded in January 1982 and a record high of 112 °F (44 °C) was recorded in July 1936. Average monthly precipitation ranged from 1.34 inches (34 mm) in February to 4.80 inches (122 mm) in June.[7]
Major highways
Adjacent counties
- Rock County, Wisconsin (north)
- Boone County (east)
- DeKalb County (southeast)
- Ogle County (south)
- Stephenson County (west)
- Green County, Wisconsin (northwest)
Demographics
| Historical population | |||
|---|---|---|---|
| Census | Pop. | %± | |
| 1840 | 4,609 | — | |
| 1850 | 11,773 | 155.4% | |
| 1860 | 24,491 | 108.0% | |
| 1870 | 29,301 | 19.6% | |
| 1880 | 30,505 | 4.1% | |
| 1890 | 39,938 | 30.9% | |
| 1900 | 47,845 | 19.8% | |
| 1910 | 63,153 | 32.0% | |
| 1920 | 90,929 | 44.0% | |
| 1930 | 117,373 | 29.1% | |
| 1940 | 121,178 | 3.2% | |
| 1950 | 152,385 | 25.8% | |
| 1960 | 209,765 | 37.7% | |
| 1970 | 246,623 | 17.6% | |
| 1980 | 250,884 | 1.7% | |
| 1990 | 252,913 | 0.8% | |
| 2000 | 278,418 | 10.1% | |
| 2010 | 295,266 | 6.1% | |
| Est. 2017 | 284,778 | [8] | −3.6% |
| U.S. Decennial Census[9] 1790-1960[10] 1900-1990[11] 1990-2000[12] 2010-2013[1] | |||
As of the 2010 United States Census, there were 295,266 people, 115,501 households, and 76,854 families residing in the county.[13] The population density was 575.2 inhabitants per square mile (222.1/km2). There were 125,965 housing units at an average density of 245.4 per square mile (94.7/km2).[6] The racial makeup of the county was 77.4% white, 12.2% black or African American, 2.3% Asian, 0.3% American Indian, 4.9% from other races, and 2.8% from two or more races. Those of Hispanic or Latino origin made up 10.9% of the population.[13] In terms of ancestry, 25.6% were German, 13.5% were Irish, 9.4% were American, 8.7% were Swedish, 8.3% were English, and 7.4% were Italian.[14]
Of the 115,501 households, 33.1% had children under the age of 18 living with them, 47.3% were married couples living together, 14.0% had a female householder with no husband present, 33.5% were non-families, and 27.7% of all households were made up of individuals. The average household size was 2.52 and the average family size was 3.07. The median age was 38.3 years.[13]
The median income for a household in the county was $47,198 and the median income for a family was $59,814. Males had a median income of $48,358 versus $32,103 for females. The per capita income for the county was $24,008. About 11.5% of families and 15.9% of the population were below the poverty line, including 25.0% of those under age 18 and 7.5% of those age 65 or over.[15]
Winnebago County is comprised by the following districts represented in 2015-2016 by the following individuals listed along with their political affiliation: [16]
District 1 Faye Lyon (R)
District 2 Jim Webster (R)
District 3 Steve Schultz (R)
District 4 David Boomer (R)
District 5 Dave Tassoni (D)
District 6 Kieth McDonald (R)
District 7 Gary Jury (R)
District 8 Eli Nicolosi (R)
District 9 Dave Kelley (R)
District 10 Joe Hoffman (D)
District 11 Dave Fiduccia (R)
District 12 Julio Salgado (D)
District 13 Angie Goral (D)
District 14 L.C. Wilson (D)
District 15 Burt Gerl (D)
District 16 John F. Sweeney (R)
District 17 Fred Wescott (R)
District 18 Dorothy Redd (D)
District 19 John Guevara (R)
District 20 Ted Biondo (R)
Communities
Cities
Villages
Census-designated place
Unincorporated communities
Townships
Winnebago County is divided into these townships:
Politics
| Year | Republican | Democratic | Third Parties |
|---|---|---|---|
| 2016 | 46.3% 55,624 | 46.4% 55,713 | 7.3% 8,718 |
| 2012 | 46.2% 55,138 | 51.7% 61,732 | 2.1% 2,527 |
| 2008 | 42.5% 53,886 | 55.3% 70,034 | 2.2% 2,784 |
| 2004 | 50.1% 60,782 | 49.2% 59,740 | 0.7% 903 |
| 2000 | 49.2% 53,816 | 47.6% 51,981 | 3.2% 3,500 |
| 1996 | 44.5% 44,479 | 46.3% 46,264 | 9.2% 9,167 |
| 1992 | 37.6% 42,221 | 43.0% 48,298 | 19.3% 21,696 |
| 1988 | 54.9% 55,699 | 44.6% 45,280 | 0.6% 571 |
| 1984 | 58.7% 64,203 | 40.8% 44,629 | 0.6% 619 |
| 1980 | 46.5% 48,825 | 30.8% 32,384 | 22.7% 23,880 |
| 1976 | 54.2% 52,736 | 43.5% 42,399 | 2.3% 2,252 |
| 1972 | 61.5% 57,682 | 38.3% 35,937 | 0.3% 231 |
| 1968 | 52.5% 47,646 | 40.5% 36,702 | 7.1% 6,391 |
| 1964 | 45.0% 39,920 | 55.0% 48,834 | 0.0% 0 |
| 1960 | 55.2% 49,541 | 44.7% 40,090 | 0.1% 110 |
| 1956 | 62.4% 48,332 | 37.5% 29,063 | 0.1% 89 |
| 1952 | 58.0% 43,468 | 41.9% 31,409 | 0.2% 127 |
| 1948 | 51.5% 29,537 | 47.4% 27,145 | 1.1% 631 |
| 1944 | 52.3% 30,837 | 47.2% 27,831 | 0.5% 277 |
| 1940 | 51.9% 30,683 | 47.5% 28,061 | 0.7% 383 |
| 1936 | 46.3% 24,997 | 50.4% 27,200 | 3.3% 1,792 |
| 1932 | 57.1% 26,632 | 38.0% 17,707 | 4.9% 2,286 |
| 1928 | 80.4% 33,258 | 18.6% 7,684 | 1.0% 430 |
| 1924 | 71.3% 21,978 | 7.2% 2,228 | 21.4% 6,608 |
| 1920 | 79.2% 19,913 | 13.4% 3,355 | 7.4% 1,866 |
| 1916 | 65.0% 14,893 | 27.1% 6,198 | 7.9% 1,806 |
| 1912 | 54.1% 7,089 | 17.4% 2,276 | 28.5% 3,740 |
| 1908 | 71.5% 8,919 | 17.4% 2,163 | 11.1% 1,385 |
| 1904 | 74.8% 8,143 | 10.8% 1,177 | 14.4% 1,567 |
| 1900 | 72.7% 8,103 | 22.4% 2,498 | 4.9% 546 |
| 1896 | 75.1% 8,242 | 22.3% 2,447 | 2.6% 286 |
| 1892 | 62.5% 5,854 | 28.1% 2,634 | 9.4% 878 |
See also
References
- Specific
- 1 2 "State & County QuickFacts". United States Census Bureau. Retrieved July 9, 2014.
- ↑ "Find a County". National Association of Counties. Retrieved 2011-06-07.
- ↑ History of Rockford and Winnebago County, Illinois: From the First Settlement in 1834 to the Civil War pg. 253
- ↑ The Expansion of New England: The Spread of New England Settlement and Institutions to the Mississippi River, 1620-1865 by Lois imball Mathews pg. 210-212
- ↑ History of Rockford and Winnebago County, Illinois: From the First Settlement in 1834 to the Civil War, pg. 379
- 1 2 "Population, Housing Units, Area, and Density: 2010 - County". United States Census Bureau. Retrieved 2015-07-12.
- 1 2 "Monthly Averages for Rockford, Illinois". The Weather Channel. Retrieved 2011-01-27.
- ↑ "Population and Housing Unit Estimates". Retrieved April 8, 2018.
- ↑ "U.S. Decennial Census". United States Census Bureau. Retrieved July 9, 2014.
- ↑ "Historical Census Browser". University of Virginia Library. Retrieved July 9, 2014.
- ↑ "Population of Counties by Decennial Census: 1900 to 1990". United States Census Bureau. Retrieved July 9, 2014.
- ↑ "Census 2000 PHC-T-4. Ranking Tables for Counties: 1990 and 2000" (PDF). United States Census Bureau. Retrieved July 9, 2014.
- 1 2 3 "DP-1 Profile of General Population and Housing Characteristics: 2010 Demographic Profile Data". United States Census Bureau. Retrieved 2015-07-12.
- ↑ "DP02 SELECTED SOCIAL CHARACTERISTICS IN THE UNITED STATES – 2006-2010 American Community Survey 5-Year Estimates". United States Census Bureau. Retrieved 2015-07-12.
- ↑ "DP03 SELECTED ECONOMIC CHARACTERISTICS – 2006-2010 American Community Survey 5-Year Estimates". United States Census Bureau. Retrieved 2015-07-12.
- ↑ "County Board Office: County Board Members - Winnebago County, Illinois". wincoil.us. Retrieved 19 March 2018.
- ↑ Leip, David. "Dave Leip's Atlas of U.S. Presidential Elections". uselectionatlas.org. Retrieved 19 March 2018.
- General
Further reading
- Shaw, Adele Marie (June 1904). "Common-Sense Country Schools: How Superintendent kern Has Revolutionized Rural Education In Winnebago County, Illinois". The World's Work: A History of Our Time. VIII: 4883–4894. Retrieved 2009-07-10. Includes numerous photos of c. 1904 Winnebago County schools.
- Church, Charles A. (1900). History of Rockford and Winnebago County, Illinois, from the first settlement in 1834 to the civil war. Rockford, Ill.: W.P. Lamb, printer. p. 430.
- The History of Winnebago County, Illinois : its past and present. Chicago: H. F. Kett & Co. 1877. p. 664.
External links
Places adjacent to Winnebago County, Illinois | ||||||||||
|---|---|---|---|---|---|---|---|---|---|---|
| ||||||||||
Municipalities and communities of Winnebago County, Illinois, United States | ||
|---|---|---|
| Cities | ||
| Villages | ||
| CDP | ||
| Townships | ||
| Unincorporated communities | ||
| Footnotes | ‡This populated place also has portions in an adjacent county or counties | |

Coordinates: 42°20′11″N 89°09′39″W / 42.33639°N 89.16083°W