Alexander County, Illinois
| Alexander County, Illinois | |
|---|---|
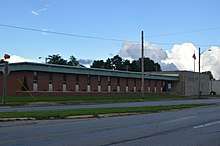 Alexander County Courthouse | |
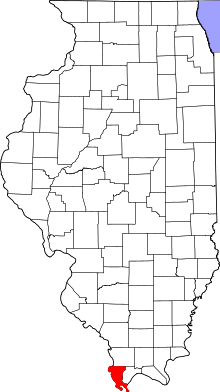 Location in the U.S. state of Illinois | |
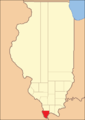
 Illinois's location in the U.S. | |
| Founded | 1819 |
| Seat | Cairo |
| Largest city | Cairo |
| Area | |
| • Total | 253 sq mi (655 km2) |
| • Land | 236 sq mi (611 km2) |
| • Water | 17 sq mi (44 km2), 6.8% |
| Population | |
| • (2010) | 8,238 |
| • Density | 35/sq mi (14/km2) |
| Congressional district | 12th |
| Time zone | Central: UTC−6/−5 |
Alexander County is the southernmost county of the U.S. state of Illinois. As of the 2010 census, the population was 8,238.[1] Its county seat is Cairo[2] and its western boundary is formed by the Mississippi River.
Alexander County is part of the Cape Girardeau, MO-IL Metropolitan Statistical Area that is made up of jurisdictions on both sides of the Mississippi River.
History
Alexander County was organized from part of Union County in 1819. It was named for William M. Alexander, a physician who practiced in the town of America (the first county seat).[3] Alexander was elected as a representative to the state House, where he became Speaker of the Illinois House of Representatives in 1822.
The county was initially developed for agriculture and settled by numerous migrants from the Upper South. The county seat was moved to Unity in 1833, then to Thebes in 1843, and finally to Cairo in 1860. America, the first county seat, is now within Pulaski County, which was formed from Alexander and Johnson counties in 1843.[4]
 Alexander County between 1819 and 1843.
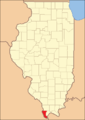 Alexander County reduced to its current borders in 1843 with the creation of Pulaski County.
Settled largely by white migrants from the Upland South, southern Illinois residents had many racial attitudes of the South. As African Americans settled in Cairo for jobs on steamboats, ferries, in shipping and railroads, there were tensions between the groups. Whites used violence and terrorism, as well as discrimination, to keep blacks in second-class positions. They excluded them from the city government and associated police and fire departments; few blacks were hired to work in local stores.
There were three lynchings of blacks in the county in the period after Reconstruction and into the early 20th century. It had the second-highest number of lynchings of African Americans in the state.[5] The most notorious of these murders was the spectacle lynching of Will James before a crowd of whites estimated at 10,000, in the county seat of Cairo, Illinois on November 11, 1909. He was a suspect in the murder of a young white woman. Later that same night, Henry Salzner, a white man, was lynched by the crowd, hanged in the courthouse square for the alleged murder of his wife. Neither case had gone to trial, nor was anyone prosecuted for the lynching crimes. Illinois had passed an anti-lynching law in 1905.[6]
Geography
According to the U.S. Census Bureau, the county has a total area of 253 square miles (660 km2), of which 236 square miles (610 km2) is land and 17 square miles (44 km2) (6.8%) is water.[7] Its borders are partly defined by the Mississippi River and the Ohio River. The lowest point in the state of Illinois is located on the Mississippi River in Cairo in Alexander County, where it flows out of Illinois and into Kentucky.
Adjacent counties
- Union County - north
- Ballard County, Kentucky - southeast
- Pulaski County - east
- Mississippi County, Missouri - south
- Scott County, Missouri - west
- Cape Girardeau County, Missouri - northwest
National protected areas
Major highways
Climate and weather
| Cairo, Illinois | ||||||||||||||||||||||||||||||||||||||||||||||||||||||||||||
|---|---|---|---|---|---|---|---|---|---|---|---|---|---|---|---|---|---|---|---|---|---|---|---|---|---|---|---|---|---|---|---|---|---|---|---|---|---|---|---|---|---|---|---|---|---|---|---|---|---|---|---|---|---|---|---|---|---|---|---|---|
| Climate chart (explanation) | ||||||||||||||||||||||||||||||||||||||||||||||||||||||||||||
| ||||||||||||||||||||||||||||||||||||||||||||||||||||||||||||
| ||||||||||||||||||||||||||||||||||||||||||||||||||||||||||||
In recent years, average temperatures in the county seat of Cairo have ranged from a low of 26 °F (−3 °C) in January to a high of 90 °F (32 °C) in July, although a record low of −12 °F (−24 °C) was recorded in January 1985 and a record high of 104 °F (40 °C) was recorded in June 1954. Average monthly precipitation ranged from 3.04 inches (77 mm) in September to 4.76 inches (121 mm) in May.[8]
Law enforcement
The Tamms Correctional Center, a now shuttered super-maximum correctional facility operated by the Illinois Department of Corrections, was located in Tamms,[9][10] as was the State of Illinois execution chamber.[11] Prior to the January 11, 2003 commutation of death row sentences, male death row inmates were housed in Tamms, Menard, and Pontiac correctional centers. After that date, only Pontiac continued to host the male death row.[12] On January 4, 2013, after years of controversy over inmate conditions, the prison officially closed, negatively impacting the county's economy.[13][14][15]
In late September 2009, press reports indicated that the Alexander County Sheriff's office had five of its seven squad cars repossessed as payments had not been made. The sheriff once had 29 deputies, but was reduced to just five at the time of the reports. The Illinois State Police have provided assistance to the county with additional patrols.[16]
Demographics

| Historical population | |||
|---|---|---|---|
| Census | Pop. | %± | |
| 1820 | 626 | — | |
| 1830 | 1,390 | 122.0% | |
| 1840 | 3,313 | 138.3% | |
| 1850 | 2,484 | −25.0% | |
| 1860 | 4,707 | 89.5% | |
| 1870 | 10,564 | 124.4% | |
| 1880 | 14,808 | 40.2% | |
| 1890 | 16,563 | 11.9% | |
| 1900 | 19,384 | 17.0% | |
| 1910 | 22,741 | 17.3% | |
| 1920 | 23,980 | 5.4% | |
| 1930 | 22,542 | −6.0% | |
| 1940 | 25,496 | 13.1% | |
| 1950 | 20,316 | −20.3% | |
| 1960 | 16,061 | −20.9% | |
| 1970 | 12,015 | −25.2% | |
| 1980 | 12,264 | 2.1% | |
| 1990 | 10,626 | −13.4% | |
| 2000 | 9,590 | −9.7% | |
| 2010 | 8,238 | −14.1% | |
| Est. 2017 | 6,315 | [17] | −23.3% |
| U.S. Decennial Census[18] 1790-1960[19] 1900-1990[20] 1990-2000[21] 2010-2013[1] | |||
As of the 2010 United States Census, there were 8,238 people, 3,329 households, and 2,093 families residing in the county.[22] The population density was 35.0 inhabitants per square mile (13.5/km2). There were 4,006 housing units at an average density of 17.0 per square mile (6.6/km2).[7] The racial makeup of the county was 60.9% white, 35.4% black or African American, 0.3% American Indian, 0.2% Asian, 0.1% Pacific islander, 1.4% from other races, and 1.7% from two or more races. Those of Hispanic or Latino origin made up 1.9% of the population.[22] In terms of ancestry, 13.9% were German, 6.8% were Irish, 5.3% were English, and 4.7% were American.[23]
Of the 3,329 households, 29.6% had children under the age of 18 living with them, 39.6% were married couples living together, 18.5% had a female householder with no husband present, 37.1% were non-families, and 33.6% of all households were made up of individuals. The average household size was 2.31 and the average family size was 2.94. The median age was 41.1 years.[22]
The median income for a household in the county was $28,833 and the median income for a family was $44,699. Males had a median income of $35,880 versus $25,743 for females. The per capita income for the county was $15,858. About 11.8% of families and 20.1% of the population were below the poverty line, including 33.1% of those under age 18 and 14.7% of those age 65 or over.[24]
Education
- Cairo Unified School District 1
- Century Community Unit School District 100
- Egyptian Community Unit School District 5
- Meridian Community Unit School District 101
- Shawnee Community Unit School District 84
Communities
City
Villages
Census-designated place
Unincorporated communities
Politics
.jpg)
| Year | Republican | Democratic | Third Parties |
|---|---|---|---|
| 2016 | 53.1% 1,496 | 44.8% 1,262 | 2.2% 62 |
| 2012 | 42.5% 1,487 | 56.1% 1,965 | 1.4% 49 |
| 2008 | 42.9% 1,692 | 55.5% 2,189 | 1.7% 66 |
| 2004 | 47.3% 1,831 | 52.1% 2,016 | 0.7% 26 |
| 2000 | 39.5% 1,588 | 58.6% 2,357 | 1.9% 77 |
| 1996 | 28.2% 1,212 | 64.0% 2,753 | 7.9% 339 |
| 1992 | 29.8% 1,301 | 58.8% 2,566 | 11.4% 495 |
| 1988 | 41.9% 1,954 | 57.8% 2,693 | 0.3% 16 |
| 1984 | 47.1% 2,574 | 52.5% 2,872 | 0.4% 21 |
| 1980 | 46.7% 2,650 | 51.5% 2,925 | 1.8% 103 |
| 1976 | 41.5% 2,349 | 57.4% 3,246 | 1.1% 63 |
| 1972 | 59.1% 3,669 | 40.0% 2,482 | 0.9% 58 |
| 1968 | 36.6% 2,540 | 42.2% 2,929 | 21.1% 1,465 |
| 1964 | 37.8% 2,895 | 62.2% 4,763 | |
| 1960 | 48.0% 4,143 | 51.8% 4,477 | 0.2% 18 |
| 1956 | 51.4% 4,425 | 48.4% 4,167 | 0.2% 21 |
| 1952 | 54.6% 5,219 | 45.1% 4,305 | 0.3% 29 |
| 1948 | 49.1% 4,561 | 49.9% 4,641 | 1.0% 96 |
| 1944 | 49.7% 4,792 | 49.5% 4,767 | 0.8% 78 |
| 1940 | 48.2% 6,260 | 50.8% 6,591 | 1.1% 137 |
| 1936 | 43.9% 5,553 | 55.1% 6,972 | 1.0% 128 |
| 1932 | 44.9% 4,729 | 53.7% 5,653 | 1.4% 151 |
| 1928 | 61.2% 5,666 | 38.5% 3,558 | 0.3% 28 |
| 1924 | 58.1% 4,465 | 34.3% 2,639 | 7.6% 581 |
| 1920 | 61.9% 5,287 | 37.1% 3,167 | 1.0% 85 |
| 1916 | 56.8% 5,395 | 41.5% 3,940 | 1.8% 170 |
| 1912 | 41.7% 2,003 | 40.4% 1,936 | 17.8% 854 |
| 1908 | 63.9% 3,790 | 34.2% 2,027 | 2.0% 119 |
| 1904 | 63.1% 3,203 | 33.2% 1,686 | 3.7% 186 |
| 1900 | 60.8% 2,790 | 38.3% 1,760 | 0.9% 42 |
| 1896 | 60.4% 2,802 | 39.1% 1,813 | 0.6% 28 |
| 1892 | 53.9% 2,053 | 44.0% 1,674 | 2.1% 80 |
Alexander County is unique among antebellum free state rural counties in having a postbellum political history largely determined by a previously disfranchised black electorate. It is most similar in this respect to – though still substantially different from – some counties of the south and the Eastern Shore of Maryland. The county was thus solidly Republican until the New Deal, and gradually turned solidly Democratic until the presidency of Bill Clinton. In the twenty-first century, the county has become a swing county due to large-scale black emigration and a rapid swing of its white population toward Republican candidates.
See also
References
- Specific
- 1 2 "State & County QuickFacts". United States Census Bureau. Archived from the original on July 6, 2011. Retrieved July 3, 2014.
- ↑ "Find a County". National Association of Counties. Archived from the original on 2011-05-31. Retrieved 2011-06-07.
- ↑ Perrin 1883, p. 455.
- ↑ Callary, Edward (2009). Place Names of Illinois. Urbana and Chicago, Illinois: University of Illinois Press. p. 4.
- ↑ Lynching in America/"Supplement: Lynchings by County", 3rd edition, 2017; Montgomery, Alabama: Equal Justice Institute, 2015/2017, p. 4
- ↑ " 'An Outrageous Proceeding': A Northern Lynching and Enforcement of Anti-Lynching Legislation in Illinois, 1905-1910", Journal of Negro History, 1999, via JSTOR
- 1 2 "Population, Housing Units, Area, and Density: 2010 - County". United States Census Bureau. Retrieved 2015-07-11.
- 1 2 "Monthly Averages for Cairo, Illinois". The Weather Channel. Retrieved 2011-01-27.
- ↑ "Tamms village, Illinois Archived 2011-06-08 at the Wayback Machine.." U.S. Census Bureau. Retrieved on August 15, 2010.
- ↑ "Tamms Correctional Center." Illinois Department of Corrections. Retrieved on September 1, 2010.
- ↑ "Tamms Closed Maximum Security Unit: Ten-Point Plan Brief Archived 2010-08-21 at the Wayback Machine.." Illinois Department of Corrections. 3 (9/51). September 3, 2009. Retrieved on September 1, 2010.
- ↑ "DOC Report Online Archived 2011-07-18 at the Wayback Machine.." Illinois Department of Corrections. Retrieved on September 1, 2010.
- ↑ https://www.aclu.org/blog/prisoners-rights/tamms-supermax-prison-its-inhumane-and-ridiculously-expensive-solitary
- ↑ http://www.kfvs12.com/story/22588419/tamms-closure-impact-on-town-months-later
- ↑ http://www.chicagomag.com/Chicago-Magazine/The-312/February-2013/Why-Labor-Is-Fighting-the-Tamms-Prison-Closure/
- ↑ Repo Man Visitis an Illinois Police Dept., CBS Evening News with Scott Pelley, by Dean Renolds, aired 28 September 2009 http://www.cbsnews.com/2100-18563_162-5347697.html
- ↑ "Population and Housing Unit Estimates". Retrieved June 9, 2017.
- ↑ "U.S. Decennial Census". United States Census Bureau. Archived from the original on May 12, 2015. Retrieved July 3, 2014.
- ↑ "Historical Census Browser". University of Virginia Library. Retrieved July 3, 2014.
- ↑ "Population of Counties by Decennial Census: 1900 to 1990". United States Census Bureau. Retrieved July 3, 2014.
- ↑ "Census 2000 PHC-T-4. Ranking Tables for Counties: 1990 and 2000" (PDF). United States Census Bureau. Retrieved July 3, 2014.
- 1 2 3 "DP-1 Profile of General Population and Housing Characteristics: 2010 Demographic Profile Data". United States Census Bureau. Retrieved 2015-07-11.
- ↑ "DP02 SELECTED SOCIAL CHARACTERISTICS IN THE UNITED STATES – 2006-2010 American Community Survey 5-Year Estimates". United States Census Bureau. Retrieved 2015-07-11.
- ↑ "DP03 SELECTED ECONOMIC CHARACTERISTICS – 2006-2010 American Community Survey 5-Year Estimates". United States Census Bureau. Retrieved 2015-07-11.
- ↑ http://uselectionatlas.org/RESULTS
- General
- Perrin, William Henry, ed. (1883). History of Alexander, Union and Pulaski Counties, Illinois. Chicago: O. L. Baskin and Company, Historical Publishers.
- United States Census Bureau 2007 TIGER/Line Shapefiles
- United States Board on Geographic Names (GNIS)
- United States National Atlas
External links
| Wikimedia Commons has media related to Alexander County, Illinois. |
Places adjacent to Alexander County, Illinois | |
|---|---|
Municipalities and communities of Alexander County, Illinois, United States | ||
|---|---|---|
| City | ||
| Villages | ||
| Precincts | ||
| CDP | ||
| Unincorporated communities | ||
| Ghost town | ||

| Counties |  | |
|---|---|---|
| Mid-sized cities (25,000+) | ||
| Small Cities (10,000-25,000) | ||
| Small Cities (5,000-10,000) | ||
| Interstates | ||
| Airports/Military bases |
| |
| Universities | ||
| Colleges | ||
| Sports teams based in the Southern Illinois | ||