Effingham County, Illinois
| Effingham County, Illinois | ||
|---|---|---|
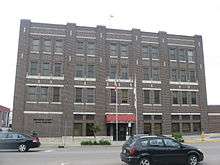 Effingham County Government Center and Jail in Effingham | ||
| ||
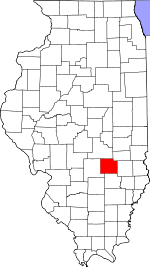 Location in the U.S. state of Illinois | ||
 Illinois's location in the U.S. | ||
| Founded | 1831 | |
| Named for | Thomas Howard, 3rd Earl of Effingham | |
| Seat | Effingham | |
| Largest city | Effingham | |
| Area | ||
| • Total | 480 sq mi (1,243 km2) | |
| • Land | 479 sq mi (1,241 km2) | |
| • Water | 1.2 sq mi (3 km2), 0.3% | |
| Population | ||
| • (2010) | 34,242 | |
| • Density | 72/sq mi (28/km2) | |
| Congressional district | 15th | |
| Time zone | Central: UTC−6/−5 | |
| Website |
www | |

Effingham County is a county located in the southern part of the U.S. state Illinois. As of the 2010 census, the population was 34,242.[1] Its county seat and largest city is Effingham. Some other cities in Effingham County, Illinois include Altamont, Teutopolis (T-Town), Beecher City, Montrose, Dieterich, Shumway, Watson, Mason, Edgewood, Heartville, and Funkhouser. Effingham County comprises the Effingham, IL Micropolitan Statistical Area.[2]
History
Effingham County was formed in 1855 out of Fayette and Crawford counties. It may have been named after Thomas Howard, 3rd Earl of Effingham, who resigned his commission as general in the British army in 1775, refusing to serve in the war against the Colonies. The name is Anglo-Saxon for "Effa's house". New information suggests that the county was named after a surveyor who surveyed the area whose last name was Effingham. There is no written proof that the county was named after Lord Effingham.
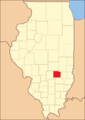 Effingham County at the time of its creation in 1831
Geography
According to the U.S. Census Bureau, the county has a total area of 480 square miles (1,200 km2), of which 479 square miles (1,240 km2) is land and 1.2 square miles (3.1 km2) (0.3%) is water.[3]
Just west of Effingham on Interstate 70 there is a 198 ft. white cross; 35,000 vehicles are estimated to pass the site each day. It is the world's second biggest cross, and took over 200 tons of steel to erect.
Climate and weather
| Effingham, Illinois | ||||||||||||||||||||||||||||||||||||||||||||||||||||||||||||
|---|---|---|---|---|---|---|---|---|---|---|---|---|---|---|---|---|---|---|---|---|---|---|---|---|---|---|---|---|---|---|---|---|---|---|---|---|---|---|---|---|---|---|---|---|---|---|---|---|---|---|---|---|---|---|---|---|---|---|---|---|
| Climate chart (explanation) | ||||||||||||||||||||||||||||||||||||||||||||||||||||||||||||
| ||||||||||||||||||||||||||||||||||||||||||||||||||||||||||||
| ||||||||||||||||||||||||||||||||||||||||||||||||||||||||||||
In recent years, average temperatures in the county seat of Effingham have ranged from a low of 18 °F (−8 °C) in January to a high of 87 °F (31 °C) in July, although a record low of −29 °F (−34 °C) was recorded in January 1915 and a record high of 111 °F (44 °C) was recorded in July 1954. Average monthly precipitation ranged from 2.38 inches (60 mm) in January to 4.51 inches (115 mm) in July.[4]
Adjacent counties
- Cumberland County - northeast
- Jasper County - east
- Clay County - south
- Fayette County - west
- Shelby County - northwest
Major highways
Demographics
| Historical population | |||
|---|---|---|---|
| Census | Pop. | %± | |
| 1840 | 1,675 | — | |
| 1850 | 3,799 | 126.8% | |
| 1860 | 7,816 | 105.7% | |
| 1870 | 15,653 | 100.3% | |
| 1880 | 18,920 | 20.9% | |
| 1890 | 19,358 | 2.3% | |
| 1900 | 20,465 | 5.7% | |
| 1910 | 20,055 | −2.0% | |
| 1920 | 19,556 | −2.5% | |
| 1930 | 19,013 | −2.8% | |
| 1940 | 22,034 | 15.9% | |
| 1950 | 21,675 | −1.6% | |
| 1960 | 23,107 | 6.6% | |
| 1970 | 24,608 | 6.5% | |
| 1980 | 30,944 | 25.7% | |
| 1990 | 31,704 | 2.5% | |
| 2000 | 34,264 | 8.1% | |
| 2010 | 34,242 | −0.1% | |
| Est. 2017 | 34,132 | [5] | −0.3% |
| U.S. Decennial Census[6] 1790-1960[7] 1900-1990[8] 1990-2000[9] 2010-2013[1] | |||
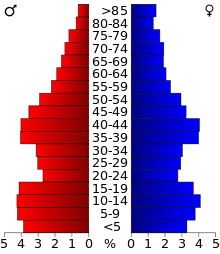
As of the 2010 United States Census, there were 34,242 people, 13,515 households, and 9,302 families residing in the county.[10] The population density was 71.5 inhabitants per square mile (27.6/km2). There were 14,570 housing units at an average density of 30.4 per square mile (11.7/km2).[3] The racial makeup of the county was 97.6% white, 0.4% Asian, 0.2% black or African American, 0.1% American Indian, 0.8% from other races, and 0.8% from two or more races. Those of Hispanic or Latino origin made up 1.7% of the population.[10] In terms of ancestry, 41.6% were German, 10.0% were Irish, 9.3% were American, and 8.8% were English.[11]
Of the 13,515 households, 32.7% had children under the age of 18 living with them, 54.9% were married couples living together, 9.5% had a female householder with no husband present, 31.2% were non-families, and 26.9% of all households were made up of individuals. The average household size was 2.50 and the average family size was 3.03. The median age was 39.2 years.[10]
The median income for a household in the county was $49,509 and the median income for a family was $61,373. Males had a median income of $40,951 versus $28,209 for females. The per capita income for the county was $24,843. About 7.8% of families and 10.5% of the population were below the poverty line, including 14.1% of those under age 18 and 7.4% of those age 65 or over.[12]
Communities
Cities
Town
Villages
Townships
Effingham County is divided into fifteen townships:
Politics
| Year | Republican | Democratic | Third Parties |
|---|---|---|---|
| 2016 | 77.9% 13,635 | 17.6% 3,083 | 4.6% 796 |
| 2012 | 75.3% 12,501 | 23.2% 3,861 | 1.5% 251 |
| 2008 | 67.1% 11,323 | 31.2% 5,262 | 1.8% 295 |
| 2004 | 72.3% 11,774 | 27.0% 4,388 | 0.7% 116 |
| 2000 | 68.0% 9,855 | 29.2% 4,225 | 2.8% 405 |
| 1996 | 54.2% 7,696 | 34.0% 4,825 | 11.9% 1,683 |
| 1992 | 42.3% 6,329 | 34.9% 5,221 | 22.9% 3,431 |
| 1988 | 64.5% 8,431 | 34.9% 4,553 | 0.6% 82 |
| 1984 | 71.2% 9,617 | 28.4% 3,841 | 0.3% 46 |
| 1980 | 65.9% 9,104 | 30.6% 4,229 | 3.4% 475 |
| 1976 | 53.7% 7,194 | 44.5% 5,952 | 1.8% 245 |
| 1972 | 66.3% 8,752 | 33.6% 4,431 | 0.1% 10 |
| 1968 | 56.0% 6,698 | 37.6% 4,496 | 6.5% 778 |
| 1964 | 42.7% 5,044 | 57.4% 6,782 | |
| 1960 | 53.0% 6,410 | 46.9% 5,676 | 0.1% 6 |
| 1956 | 60.7% 6,904 | 39.2% 4,455 | 0.2% 21 |
| 1952 | 57.8% 6,530 | 42.0% 4,745 | 0.2% 25 |
| 1948 | 48.9% 4,823 | 50.1% 4,940 | 1.0% 96 |
| 1944 | 53.8% 5,441 | 45.3% 4,587 | 0.9% 91 |
| 1940 | 49.5% 5,941 | 49.9% 5,988 | 0.6% 77 |
| 1936 | 40.6% 4,293 | 57.0% 6,030 | 2.5% 260 |
| 1932 | 30.7% 2,933 | 68.0% 6,503 | 1.4% 133 |
| 1928 | 47.3% 3,882 | 51.6% 4,239 | 1.1% 93 |
| 1924 | 39.2% 3,159 | 47.3% 3,814 | 13.5% 1,090 |
| 1920 | 57.5% 4,176 | 41.1% 2,985 | 1.5% 106 |
| 1916 | 40.4% 3,207 | 57.0% 4,529 | 2.7% 210 |
| 1912 | 23.3% 1,002 | 59.8% 2,575 | 17.0% 732 |
| 1908 | 38.9% 1,877 | 58.5% 2,826 | 2.6% 127 |
| 1904 | 42.7% 1,863 | 52.8% 2,303 | 4.6% 199 |
| 1900 | 38.0% 1,853 | 61.0% 2,979 | 1.0% 51 |
| 1896 | 38.6% 1,895 | 60.1% 2,953 | 1.3% 65 |
| 1892 | 32.9% 1,472 | 61.4% 2,744 | 5.7% 255 |
In its early years Effingham County was owing to its anti-Civil War German-American population powerfully Democratic. Until Woodrow Wilson’s harsh policies towards Germany following World War I drove many voters to the GOP’s Warren G. Harding, it had voted an absolute majority to the Democratic presidential candidate in every election since the county’s formation.Opposition to the New Deal caused a considerable swing away from Franklin D. Roosevelt in 1936, and combined with local opposition to Roosevelt’s war policies in 1940 to cause FDR to only win the county by forty-seven votes from Wendell Willkie.
Since that election, the county has voted Republican in every election except 1948 and 1964, and no Democrat since Jimmy Carter in 1976 has reached 35 percent of the county’s vote. Currently Effingham County is one of Illinois’ most Republican counties, rivalled by a number of southern counties like Edwards. In the 2008 U.S. Presidential election, John McCain carried the county by a 36% margin over Barack Obama, making it McCain's strongest county in the state, with Obama carrying his home state by a 25.1% margin over McCain.[14]
See also
References
- Specific
- 1 2 "State & County QuickFacts". United States Census Bureau. Archived from the original on July 9, 2011. Retrieved July 4, 2014.
- ↑ "Find a County". National Association of Counties. Archived from the original on 2012-07-12. Retrieved 2011-06-07.
- 1 2 "Population, Housing Units, Area, and Density: 2010 - County". United States Census Bureau. Retrieved 2015-07-11.
- 1 2 "Monthly Averages for Effingham, Illinois". The Weather Channel. Retrieved 2011-01-27.
- ↑ "Population and Housing Unit Estimates". Retrieved June 9, 2017.
- ↑ "U.S. Decennial Census". United States Census Bureau. Archived from the original on May 12, 2015. Retrieved July 4, 2014.
- ↑ "Historical Census Browser". University of Virginia Library. Retrieved July 4, 2014.
- ↑ "Population of Counties by Decennial Census: 1900 to 1990". United States Census Bureau. Retrieved July 4, 2014.
- ↑ "Census 2000 PHC-T-4. Ranking Tables for Counties: 1990 and 2000" (PDF). United States Census Bureau. Retrieved July 4, 2014.
- 1 2 3 "DP-1 Profile of General Population and Housing Characteristics: 2010 Demographic Profile Data". United States Census Bureau. Retrieved 2015-07-11.
- ↑ "DP02 SELECTED SOCIAL CHARACTERISTICS IN THE UNITED STATES – 2006-2010 American Community Survey 5-Year Estimates". United States Census Bureau. Retrieved 2015-07-11.
- ↑ "DP03 SELECTED ECONOMIC CHARACTERISTICS – 2006-2010 American Community Survey 5-Year Estimates". United States Census Bureau. Retrieved 2015-07-11.
- ↑ http://uselectionatlas.org/RESULTS
- ↑ U.S. Election Atlas
- General
- History of Southern Illinois, George Washington Smith, 1912.
- United States Census Bureau 2007 TIGER/Line Shapefiles
- United States Board on Geographic Names (GNIS)
- United States National Atlas
External links
Places adjacent to Effingham County, Illinois | ||||||||||
|---|---|---|---|---|---|---|---|---|---|---|
| ||||||||||
Municipalities and communities of Effingham County, Illinois, United States | ||
|---|---|---|
| Cities | ||
| Town | ||
| Villages | ||
| Townships | ||
| Unincorporated communities | ||
| Footnotes | ‡This populated place also has portions in an adjacent county or counties | |
