United States presidential election in Indiana, 2016
|
| ||||||||||||||||||||||||||
| ||||||||||||||||||||||||||
| Turnout | 58.00% | |||||||||||||||||||||||||
|---|---|---|---|---|---|---|---|---|---|---|---|---|---|---|---|---|---|---|---|---|---|---|---|---|---|---|
| ||||||||||||||||||||||||||
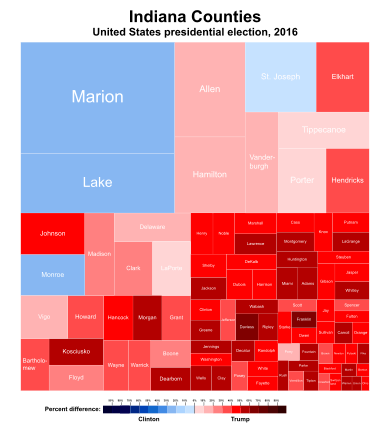
 County results:
| ||||||||||||||||||||||||||
| ||||||||||||||||||||||||||
.jpg)

| Elections in Indiana | ||||||||||
|---|---|---|---|---|---|---|---|---|---|---|
 | ||||||||||
|
||||||||||
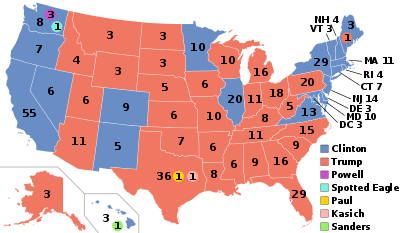
The 2016 United States presidential election in Indiana was held on November 8, 2016, as part of the 2016 General Election in which all 50 states plus The District of Columbia participated. Indiana voters chose electors to represent them in the Electoral College via a popular vote pitting the Republican Party's nominee, businessman Donald Trump, and running mate Indiana Governor Mike Pence against Democratic Party nominee, former Secretary of State Hillary Clinton and her running mate, Virginia Senator Tim Kaine.
On May 3, 2016, in the presidential primaries, voters expressed their preferences for the Democratic and Republican parties' respective nominees for president.
Donald Trump won the election in Indiana with 56.9% of the vote. Hillary Clinton received 37.9% of the vote.[1] Indiana is the home state of Trump's running mate, Mike Pence, which was believed to have provided important assistance to the Trump campaign in what already would have been a Republican-leaning state.
Results
By congressional district
Trump won 7 of 9 congressional districts.[2]
| District | Trump | Clinton | Representative |
|---|---|---|---|
| 1st | 41% | 54% | Pete Visclosky |
| 2nd | 59% | 36% | Jackie Walorski |
| 3rd | 65% | 30% | Marlin Stutzman |
| 4th | 64% | 30% | Todd Rokita |
| 5th | 53% | 41% | Susan Brooks |
| 6th | 68% | 27% | Luke Messer |
| 7th | 36% | 58% | André Carson |
| 8th | 64% | 31% | Larry Bucshon |
| 9th | 61% | 34% | Todd Young |
By county
| County | Clinton% | Clinton# | Trump% | Trump# | Others% | Others# | Total |
|---|---|---|---|---|---|---|---|
| Adams County | 21.43% | 2,805 | 73.71% | 9,648 | 4.87% | 637 | 13,090 |
| Allen County | 37.64% | 55,382 | 57.04% | 83,930 | 5.32% | 7,825 | 147,137 |
| Bartholomew County | 30.29% | 9,841 | 63.53% | 20,640 | 6.18% | 2,009 | 32,490 |
| Benton County | 23.46% | 860 | 70.35% | 2,579 | 6.19% | 227 | 3,666 |
| Blackford County | 25.69% | 1,243 | 69.23% | 3,350 | 5.08% | 246 | 4,839 |
| Boone County | 31.64% | 10,181 | 61.08% | 19,654 | 7.28% | 2,343 | 32,178 |
| Brown County | 31.69% | 2,518 | 63.13% | 5,016 | 5.17% | 411 | 7,945 |
| Carroll County | 21.89% | 1,892 | 72.58% | 6,273 | 5.53% | 478 | 8,643 |
| Cass County | 26.46% | 3,759 | 68.27% | 9,701 | 5.27% | 749 | 14,209 |
| Clark County | 36.77% | 18,808 | 58.72% | 30,035 | 4.50% | 2,304 | 51,147 |
| Clay County | 20.44% | 2,306 | 75.62% | 8,531 | 3.94% | 445 | 11,282 |
| Clinton County | 23.62% | 2,819 | 71.47% | 8,531 | 4.91% | 586 | 11,936 |
| Crawford County | 28.80% | 1,323 | 65.64% | 3,015 | 5.55% | 255 | 4,593 |
| Daviess County | 16.72% | 1,800 | 79.36% | 8,545 | 3.93% | 423 | 10,768 |
| Dearborn County | 20.36% | 4,883 | 75.51% | 18,113 | 4.13% | 991 | 23,987 |
| Decatur County | 19.06% | 2,121 | 76.30% | 8,490 | 4.64% | 516 | 11,127 |
| DeKalb County | 23.32% | 3,942 | 71.32% | 12,054 | 5.36% | 906 | 16,902 |
| Delaware County | 40.23% | 18,153 | 53.77% | 24,263 | 6.0% | 2,707 | 45,123 |
| Dubois County | 26.97% | 5,389 | 66.88% | 13,365 | 6.15% | 1,230 | 19,984 |
| Elkhart County | 31.60% | 20,740 | 63.79% | 41,867 | 4.61% | 3,023 | 65,630 |
| Fayette County | 23.63% | 2,252 | 71.76% | 6,839 | 4.61% | 439 | 9,530 |
| Floyd County | 37.26% | 13,945 | 57.27% | 21,432 | 5.47% | 2,048 | 37,425 |
| Fountain County | 19.70% | 1,476 | 75.57% | 5,662 | 4.73% | 354 | 7,492 |
| Franklin County | 17.88% | 1,969 | 78.72% | 8,669 | 3.41% | 375 | 11,013 |
| Fulton County | 23.41% | 1,960 | 71.77% | 6,010 | 4.82% | 404 | 8,374 |
| Gibson County | 24.03% | 3,721 | 71.56% | 11,081 | 4.40% | 682 | 15,484 |
| Grant County | 27.69% | 7,010 | 67.19% | 17,008 | 5.11% | 1,294 | 25,312 |
| Greene County | 21.22% | 2,929 | 74.47% | 10,277 | 4.31% | 595 | 13,801 |
| Hamilton County | 37.12% | 57,263 | 56.66% | 87,404 | 6.22% | 9,589 | 154,256 |
| Hancock County | 24.61% | 8,904 | 69.30% | 25,074 | 6.09% | 2,203 | 36,181 |
| Harrison County | 25.77% | 4,783 | 69.74% | 12,943 | 4.48% | 832 | 18,558 |
| Hendricks County | 29.91% | 22,600 | 63.97% | 48,337 | 6.12% | 4,622 | 75,559 |
| Henry County | 25.42% | 5,124 | 68.94% | 13,895 | 5.64% | 1,136 | 20,155 |
| Howard County | 30.44% | 11,215 | 64.26% | 23,675 | 5.30% | 1,953 | 36,843 |
| Huntington County | 21.85% | 3,506 | 72.61% | 11,649 | 5.54% | 888 | 16,043 |
| Jackson County | 21.87% | 3,843 | 73.17% | 12,859 | 4.96% | 871 | 17,573 |
| Jasper County | 24.88% | 3,329 | 70.13% | 9,382 | 4.99% | 667 | 13,378 |
| Jay County | 23.65% | 1,889 | 71.34% | 5,697 | 5.01% | 400 | 7,986 |
| Jefferson County | 31.94% | 4,326 | 63.10% | 8,546 | 4.96% | 672 | 13,544 |
| Jennings County | 21.20% | 2,364 | 73.76% | 8,224 | 5.04% | 562 | 11,150 |
| Johnson County | 26.04% | 17,318 | 68.35% | 45,456 | 5.60% | 3,726 | 66,500 |
| Knox County | 24.31% | 3,772 | 71.39% | 11,077 | 4.30% | 667 | 15,516 |
| Kosciusko County | 19.68% | 6,313 | 74.60% | 23,935 | 5.72% | 1,836 | 32,084 |
| LaGrange County | 43.80% | 19,798 | 50.19% | 22,687 | 6.01% | 2,718 | 45,203 |
| Lake County | 21.74% | 2,080 | 73.44% | 7,025 | 4.82% | 461 | 9,566 |
| LaPorte County | 58.12% | 116,935 | 37.59% | 75,625 | 4.30% | 8,645 | 201,205 |
| Lawrence County | 21.98% | 4,210 | 73.28% | 14,035 | 4.74% | 907 | 19,152 |
| Madison County | 34.49% | 18,595 | 60.06% | 32,376 | 5.45% | 2,938 | 53,909 |
| Marion County | 58.75% | 212,899 | 35.97% | 130,360 | 5.27% | 19,113 | 362,372 |
| Marshall County | 26.53% | 4,798 | 67.96% | 12,288 | 5.51% | 996 | 18,082 |
| Martin County | 18.32% | 881 | 76.88% | 3,697 | 4.80% | 231 | 4,809 |
| Miami County | 20.52% | 2,766 | 73.99% | 9,975 | 5.50% | 741 | 13,482 |
| Monroe County | 58.53% | 34,216 | 35.23% | 20,592 | 6.24% | 3,646 | 58,454 |
| Montgomery County | 22.18% | 3,362 | 72.97% | 11,059 | 4.85% | 735 | 15,156 |
| Morgan County | 19.31% | 6,040 | 75.68% | 23,674 | 5.01% | 1,566 | 31,280 |
| Newton County | 24.23% | 1,404 | 70.35% | 4,077 | 5.42% | 314 | 5,795 |
| Noble County | 23.11% | 3,904 | 72.22% | 12,198 | 4.67% | 788 | 16,890 |
| Ohio County | 23.49% | 686 | 72.51% | 2,118 | 4.01% | 117 | 2,921 |
| Orange County | 25.00% | 2,048 | 70.84% | 5,803 | 4.16% | 341 | 8,192 |
| Owen County | 22.74% | 1,946 | 71.91% | 6,153 | 5.35% | 458 | 8,557 |
| Parke County | 21.89% | 1,441 | 73.88% | 4,863 | 4.22% | 278 | 6,582 |
| Perry County | 38.01% | 3,062 | 56.56% | 4,556 | 5.43% | 437 | 8,055 |
| Pike County | 21.70% | 1,297 | 73.58% | 4,398 | 4.72% | 282 | 5,977 |
| Porter County | 43.63% | 33,676 | 50.31% | 38,832 | 6.07% | 4,682 | 77,190 |
| Posey County | 28.24% | 3,521 | 67.41% | 8,404 | 4.35% | 542 | 12,467 |
| Pulaski County | 24.31% | 1,327 | 70.60% | 3,854 | 5.09% | 278 | 5,459 |
| Putnam County | 22.81% | 3,356 | 72.29% | 10,637 | 4.91% | 722 | 14,715 |
| Randolph County | 23.39% | 2,446 | 71.88% | 7,517 | 4.73% | 495 | 10,458 |
| Ripley County | 19.29% | 2,471 | 76.55% | 9,806 | 4.16% | 533 | 12,810 |
| Rush County | 21.14% | 1,525 | 73.36% | 5,292 | 5.50% | 397 | 7,214 |
| Scott County | 29.03% | 2,642 | 66.74% | 6,074 | 4.23% | 385 | 9,101 |
| Shelby County | 23.60% | 4,247 | 70.68% | 12,718 | 5.72% | 1,029 | 17,994 |
| Spencer County | 28.67% | 2,861 | 65.86% | 6,572 | 5.47% | 546 | 9,979 |
| St. Joseph County | 47.48% | 52,252 | 47.27% | 52,021 | 5.26% | 5,787 | 110,060 |
| Starke County | 26.98% | 2,489 | 69.01% | 6,367 | 4.01% | 370 | 9,226 |
| Steuben County | 25.70% | 3,744 | 69.57% | 10,133 | 4.73% | 689 | 14,566 |
| Sullivan County | 24.69% | 2,113 | 71.71% | 6,138 | 3.60% | 308 | 8,559 |
| Switzerland County | 25.14% | 930 | 69.15% | 2,558 | 5.70% | 211 | 3,699 |
| Tippecanoe County | 43.64% | 27,282 | 49.22% | 30,768 | 7.14% | 4,465 | 62,515 |
| Tipton County | 21.13% | 1,587 | 74.42% | 5,589 | 4.45% | 334 | 7,510 |
| Union County | 21.73% | 715 | 74.29% | 2,445 | 3.98% | 131 | 3,291 |
| Vanderburgh County | 39.35% | 28,530 | 55.85% | 40,496 | 4.80% | 3,481 | 72,507 |
| Vermillion County | 29.99% | 2,081 | 65.04% | 4,513 | 4.97% | 345 | 6,939 |
| Vigo County | 40.01% | 15,931 | 55.09% | 21,937 | 4.90% | 1,950 | 39,818 |
| Wabash County | 22.41% | 3,018 | 72.92% | 9,821 | 4.67% | 629 | 13,468 |
| Warren County | 21.35% | 839 | 73.74% | 2,898 | 4.91% | 193 | 3,930 |
| Warrick County | 30.71% | 9,086 | 64.59% | 19,113 | 4.70% | 1,390 | 29,589 |
| Washington County | 23.16% | 2,636 | 72.12% | 8,209 | 4.72% | 537 | 11,382 |
| Wayne County | 32.53% | 8,322 | 62.66% | 16,028 | 4.80% | 1,229 | 25,579 |
| Wells County | 19.61% | 2,586 | 75.88% | 10,005 | 4.51% | 594 | 13,185 |
| White County | 25.76% | 2,590 | 68.57% | 6,893 | 5.67% | 570 | 10,053 |
| Whitley County | 21.63% | 3,379 | 72.70% | 11,358 | 5.67% | 886 | 15,623 |
Primary elections
Democratic primary

Two candidates appeared on the Democratic presidential primary ballot:
| Indiana Democratic primary, May 3, 2016 | |||||
|---|---|---|---|---|---|
| Candidate | Popular vote | Estimated delegates | |||
| Count | Percentage | Pledged | Unpledged | Total | |
| Bernie Sanders | 335,074 | 52.46% | 44 | 0 | 44 |
| Hillary Clinton | 303,705 | 47.54% | 39 | 7 | 46 |
| Uncommitted | N/A | 0 | 2 | 2 | |
| Total | 638,779 | 100% | 83 | 9 | 92 |
| Source: The Green Papers - Official Primary Results | |||||
Republican primary

Twelve candidates appeared on the Republican presidential primary ballot:
- Jeb Bush (withdrawn)
- Ben Carson (withdrawn)
- Chris Christie (withdrawn)
- Ted Cruz (campaign suspended after loss in Indiana GOP Primary, a 'winner-take-all' primary)
- Carly Fiorina (withdrawn)
- Jim Gilmore (withdrawn)
- Mike Huckabee (withdrawn)
- John Kasich
- Rand Paul (withdrawn)
- Marco Rubio (withdrawn)
- Rick Santorum (withdrawn)
- Donald Trump
| Indiana Republican primary, May 3, 2016 | |||||
|---|---|---|---|---|---|
| Candidate | Votes | Percentage | Actual delegate count | ||
| Bound | Unbound | Total | |||
| 591,514 | 53.26% | 57 | 0 | 57 | |
| Ted Cruz | 406,783 | 36.63% | 0 | 0 | 0 |
| John Kasich | 84,111 | 7.57% | 0 | 0 | 0 |
| Ben Carson (withdrawn) | 8,914 | 0.80% | 0 | 0 | 0 |
| Jeb Bush (withdrawn) | 6,508 | 0.59% | 0 | 0 | 0 |
| Marco Rubio (withdrawn) | 5,175 | 0.47% | 0 | 0 | 0 |
| Rand Paul (withdrawn) | 4,306 | 0.39% | 0 | 0 | 0 |
| Chris Christie (withdrawn) | 1,738 | 0.16% | 0 | 0 | 0 |
| Carly Fiorina (withdrawn) | 1,494 | 0.13% | 0 | 0 | 0 |
| Unprojected delegates: | 0 | 0 | 0 | ||
| Total: | 1,110,543 | 100.00% | 57 | 0 | 57 |
| Source: The Green Papers | |||||
Polling
Analysis
.jpg)
Indiana, despite voting Democratic once for Barack Obama in 2008, has shifted back to being solidly Republican. Republican nominee Donald Trump carried the state by 19 points over Democrat Hillary Clinton,[3] thus gaining all of Indiana's 11 electoral votes.
Donald Trump's victory in the Hoosier State can be attributed to several factors. For one, Donald Trump had selected Indiana governor Mike Pence as his running mate, effectively eliminating any chance that Clinton could repeat Obama's surprise upset win in the state over John McCain eight years prior. Also, the state skews whiter and more Evangelical Protestant than the rest of the Midwest and the Rust Belt overall, which is a better demographic make-up for Republicans; Trump won white born-again and Evangelical Christians by a margin of 75-22.[4]
Suburban communities in the "doughnut counties" surrounding Indianapolis lean heavily Republican, and bolstered the Trump-Pence ticket in the state. Many of these voters are fiscally conservative and pro-life. Another G.O.P. stronghold that benefitted Trump was the northeast region around Fort Wayne, which is a mix of suburban, exurban and rural areas, and is home to some of the most socially conservative voters in the nation.
In Southern Indiana along the Ohio River, especially around Evansville in Vanderburgh County, the electorate is dominated by "Butternut Democrats:" socially conservative, working-class white voters who were Democrats for generations but have been trending Republican.[5] Such voters turned out for Trump in full force, inspired by his economic populism and by Pence's social conservatism.
Trump also won in Vigo County, home to Terre Haute and a noted bellwether; it has voted for the winner of every presidential election all but twice since 1892.
Clinton, for her part, performed well in Indianapolis in Marion County and in Gary in Lake County, which has a large African American population and is considered part of the Chicago Metropolitan Area. Clinton won African Americans by a margin of 83-12.
See also
References
- ↑ "Indiana Election Results 2016 – The New York Times". Retrieved November 10, 2016.
- ↑ http://www.swingstateproject.com/diary/4161/
- ↑ "Indiana Election Results 2016". Retrieved 2016-11-12.
- ↑ "2016 election results: Indiana Exit polls". www.cnn.com. Retrieved 2016-11-12.
- ↑ Cohen, Micah (2012-10-19). "After Brief Role as Battleground, Indiana Exits, Stage Right". FiveThirtyEight. Retrieved 2016-11-12.
External links
- RNC 2016 Republican Nominating Process
- Green papers for 2016 primaries, caucuses, and conventions
- 2016 Presidential primaries, ElectionProjection.com