Macoupin County, Illinois
| Macoupin County, Illinois | |
|---|---|
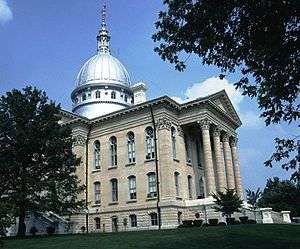 Macoupin County Courthouse in Carlinville | |
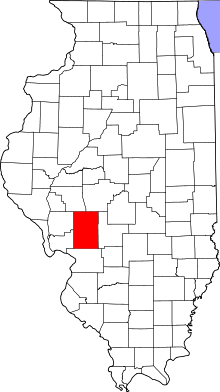 Location in the U.S. state of Illinois | |
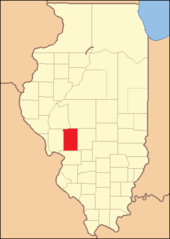
 Illinois's location in the U.S. | |
| Founded | 1829 |
| Named for | Macoupin Creek |
| Seat | Carlinville |
| Largest city | Carlinville |
| Area | |
| • Total | 868 sq mi (2,248 km2) |
| • Land | 863 sq mi (2,235 km2) |
| • Water | 4.7 sq mi (12 km2), 0.5% |
| Population | |
| • (2010) | 47,765 |
| • Density | 55/sq mi (21/km2) |
| Congressional district | 13th |
| Time zone | Central: UTC−6/−5 |
| Website |
www |
Macoupin County is a county located in the southwestern portion of the U.S. state of Illinois, and is a part of the St. Louis Metropolitan Area. According to the 2010 census, it had a population of 47,765.[1] The county seat is Carlinville.[2]
Macoupin County is part of the Metro-East region of the St. Louis, MO-IL Metropolitan Statistical Area.
The primary industry is agriculture, consisting of crops of corn (maize), soybeans, and some wheat.
History
The region was previously inhabited by Illinoisan Indians when the first white settlers arrived. Indeed, macoupin is the Miami-Illinois term for the American lotus, Nelumbo lutea. None of the native Indians remain, although some descendants of the earliest European settlers claim partial ancestry. The first European contact was by French explorers in the seventeenth century, travelling southward down the major rivers. The main European settlement was from the southwest, as people moved inland from the established transportation route of the Mississippi River.
Macoupin County was established on January 17, 1829.[3] It was formed out of Greene and Madison Counties and was named after Macoupin Creek,[4] which runs near Carlinville and meanders southwest to the Illinois River. The economy was based on subsistence agriculture, and communication was to the southwest.
In the middle 19th century, Illinois developed and changed rapidly. The greatest change was in the building of railroads, and Macoupin County was on the rail and road transportation link between St. Louis and the still-young metropolis of Chicago. The county lies midway between St. Louis and the relocated state capital of Springfield. The economy was still based entirely on agriculture, but there was now easier access to markets. Towns were small, sparsely distributed, and any new communities were founded along the railroad lines that provided transportation. Culturally, the county remained closer to its historical ties with St. Louis than to more northerly areas within the state.
Agriculture remained a mainstay of the economy, but this was joined by coal mining, an industry that partially changed the complexion of the county. With coal underlying the entire region, the most economical development was to place mines alongside the railroad tracks (for transportation of coal), and located in or near already-existing towns. By the twentieth century, there were mines in many towns, all of them with substantial populations of foreign-born miners from everywhere in Europe.
During the twentieth century, agriculture and coal mining remained the mainstays of the county's economy, and the county's fortunes rose and fell with them. Farming was still family based. Macoupin County was often at the center of major labor disputes between mine owners and miners, and was a hotbed of union activity. The county had previously played a major role in violent 1890s disputes that brought unwanted national attention, was at center stage when the United Mine Workers rose to power, and was again prominent during the internecine war between the UMW and the Progressive Miners of America of the 1930s.
Agriculture remained as the county's prime economic activity, but farming became a large-scale corporate enterprise, with small family farms rapidly disappearing. Coal mining decreased, and has almost disappeared entirely. Buildings and structures related to coal mining were torn down as they wasted away, so that there is now little to see of this once-major industry.
Towns were (and still are) characterized either by a midwestern town square layout, or by a main street layout. In the former, a central city block may be a small park with a gazebo, and with the small businesses of the town surrounding it. In the latter, a single street will have the small businesses of the town lining either side of it. Carlinville has a city square layout, with the main county building occupying the central city block. This building houses all the offices of the county. Typically, churches of the various denominations will lie within two or three blocks of the town square, or sometimes will lie mainly along a single street near the town's center.
With modern roads easily accessible, some towns in the northern part of the county became virtual bedroom communities as people commuted to Springfield to work and shop, hastening the decline of small businesses in the towns. The same effect was felt in the southernmost part of the county, and in 2005, the U.S. Census Bureau included the county in the St. Louis Metropolitan Statistical Area due to increased commuting patterns and employment in St. Louis and the Metro-East.
Geography
According to the U.S. Census Bureau, the county has a total area of 868 square miles (2,250 km2), of which 863 square miles (2,240 km2) is land and 4.7 square miles (12 km2) (0.5%) is water.[5]
Climate and weather
| Carlinville, Illinois | ||||||||||||||||||||||||||||||||||||||||||||||||||||||||||||
|---|---|---|---|---|---|---|---|---|---|---|---|---|---|---|---|---|---|---|---|---|---|---|---|---|---|---|---|---|---|---|---|---|---|---|---|---|---|---|---|---|---|---|---|---|---|---|---|---|---|---|---|---|---|---|---|---|---|---|---|---|
| Climate chart (explanation) | ||||||||||||||||||||||||||||||||||||||||||||||||||||||||||||
| ||||||||||||||||||||||||||||||||||||||||||||||||||||||||||||
| ||||||||||||||||||||||||||||||||||||||||||||||||||||||||||||
In recent years, average temperatures in the county seat of Carlinville have ranged from a low of 17 °F (−8 °C) in January to a high of 87 °F (31 °C) in July, although a record low of −23 °F (−31 °C) was recorded in February 1905 and a record high of 113 °F (45 °C) was recorded in July 1954. Average monthly precipitation ranged from 1.95 inches (50 mm) in February to 4.25 inches (108 mm) in May.[6]
Major highways
Adjacent counties
- Sangamon County - northeast
- Montgomery County - east
- Madison County - south
- Greene County - west
- Jersey County - west
- Morgan County - northwest
Demographics
| Historical population | |||
|---|---|---|---|
| Census | Pop. | %± | |
| 1830 | 1,990 | — | |
| 1840 | 7,826 | 293.3% | |
| 1850 | 12,355 | 57.9% | |
| 1860 | 24,602 | 99.1% | |
| 1870 | 32,726 | 33.0% | |
| 1880 | 37,692 | 15.2% | |
| 1890 | 40,352 | 7.1% | |
| 1900 | 42,256 | 4.7% | |
| 1910 | 50,685 | 19.9% | |
| 1920 | 57,274 | 13.0% | |
| 1930 | 48,703 | −15.0% | |
| 1940 | 46,304 | −4.9% | |
| 1950 | 44,210 | −4.5% | |
| 1960 | 43,524 | −1.6% | |
| 1970 | 44,557 | 2.4% | |
| 1980 | 49,384 | 10.8% | |
| 1990 | 47,679 | −3.5% | |
| 2000 | 49,019 | 2.8% | |
| 2010 | 47,765 | −2.6% | |
| Est. 2016 | 45,908 | [7] | −3.9% |
| U.S. Decennial Census[8] 1790-1960[9] 1900-1990[10] 1990-2000[11] 2010-2013[1] | |||
As of the 2010 United States Census, there were 47,765 people, 19,381 households, and 13,224 families residing in the county.[12] The population density was 55.4 inhabitants per square mile (21.4/km2). There were 21,584 housing units at an average density of 25.0 per square mile (9.7/km2).[5] The racial makeup of the county was 97.6% white, 0.8% black or African American, 0.3% Asian, 0.3% American Indian, 0.2% from other races, and 0.9% from two or more races. Those of Hispanic or Latino origin made up 0.9% of the population.[12] In terms of ancestry, 35.8% were German, 16.2% were Irish, 13.9% were English, 9.5% were American, and 8.0% were Italian.[13]
Of the 19,381 households, 30.2% had children under the age of 18 living with them, 53.5% were married couples living together, 9.8% had a female householder with no husband present, 31.8% were non-families, and 27.0% of all households were made up of individuals. The average household size was 2.42 and the average family size was 2.90. The median age was 41.7 years.[12]
The median income for a household in the county was $47,178 and the median income for a family was $59,700. Males had a median income of $48,878 versus $30,748 for females. The per capita income for the county was $23,222. About 9.7% of families and 12.0% of the population were below the poverty line, including 17.4% of those under age 18 and 5.5% of those age 65 or over.[14]
Communities
Cities
Towns
Villages
Unincorporated communities
Townships
Macoupin County is divided into twenty-six townships:

Politics
As part of the rural German Catholic belt surrounding the Illinois section of the St. Louis metropolitan area, Macoupin County traditionally favored the Democratic Party. Up to and including the 2000 election, Macoupin voted for the Republican nominee only in six major landslide victories, and in fact no Republican gained an absolute majority of the county’s vote until Richard Nixon’s 3,000-plus-county landslides victory over George McGovern in 1972.
The twenty-first century has seen a major change in these voting patterns due to the county’s conservative population opposing the Democratic Party’s liberal views on social issues, added to the viewpoint that the Democrats have not done enough to counter the region’s economic problems. The 2012 election saw Illinois-bred Barack Obama become the first Democrat to win the presidency without carrying Macoupin County, and in 2016 Hillary Clinton won less than thirty percent of the vote in this traditionally Democratic county – a figure eleven percent worse than McGovern’s in his landslide defeat.
| Year | Republican | Democratic | Third Parties |
|---|---|---|---|
| 2016 | 64.0% 14,322 | 29.9% 6,689 | 6.2% 1,380 |
| 2012 | 51.9% 10,946 | 44.9% 9,464 | 3.2% 673 |
| 2008 | 44.1% 9,891 | 53.9% 12,090 | 2.1% 462 |
| 2004 | 50.1% 11,413 | 49.1% 11,193 | 0.8% 179 |
| 2000 | 45.6% 9,749 | 51.5% 11,015 | 2.9% 625 |
| 1996 | 34.3% 7,235 | 52.7% 11,107 | 13.0% 2,733 |
| 1992 | 27.6% 6,518 | 50.9% 12,050 | 21.5% 5,093 |
| 1988 | 43.2% 9,362 | 56.3% 12,195 | 0.5% 112 |
| 1984 | 53.5% 12,282 | 46.2% 10,602 | 0.3% 69 |
| 1980 | 54.3% 12,131 | 40.8% 9,116 | 5.0% 1,107 |
| 1976 | 45.6% 10,242 | 53.0% 11,910 | 1.5% 334 |
| 1972 | 58.0% 13,583 | 41.3% 9,662 | 0.7% 162 |
| 1968 | 43.9% 10,262 | 46.0% 10,750 | 10.1% 2,356 |
| 1964 | 35.6% 8,430 | 64.4% 15,227 | |
| 1960 | 47.1% 11,731 | 52.7% 13,120 | 0.2% 45 |
| 1956 | 49.9% 12,290 | 50.0% 12,303 | 0.1% 34 |
| 1952 | 48.7% 12,336 | 51.1% 12,944 | 0.3% 68 |
| 1948 | 45.7% 10,198 | 52.7% 11,742 | 1.6% 358 |
| 1944 | 48.9% 11,572 | 50.5% 11,951 | 0.7% 160 |
| 1940 | 47.1% 13,000 | 52.0% 14,356 | 0.9% 254 |
| 1936 | 36.8% 9,502 | 57.6% 14,896 | 5.6% 1,453 |
| 1932 | 29.7% 7,031 | 62.7% 14,810 | 7.6% 1,799 |
| 1928 | 47.7% 10,699 | 50.3% 11,290 | 2.0% 449 |
| 1924 | 39.2% 8,571 | 28.1% 6,134 | 32.7% 7,136 |
| 1920 | 44.7% 8,700 | 30.5% 5,936 | 24.8% 4,834 |
| 1916 | 43.6% 8,875 | 49.2% 10,012 | 7.1% 1,448 |
| 1912 | 21.1% 2,177 | 47.5% 4,902 | 31.4% 3,235 |
| 1908 | 42.8% 4,988 | 49.5% 5,775 | 7.7% 901 |
| 1904 | 46.7% 4,796 | 42.2% 4,336 | 11.1% 1,140 |
| 1900 | 45.1% 4,814 | 51.3% 5,472 | 3.6% 387 |
| 1896 | 46.4% 4,970 | 52.1% 5,574 | 1.5% 164 |
| 1892 | 40.5% 3,868 | 52.9% 5,051 | 6.6% 625 |
See also
References
- 1 2 "State & County QuickFacts". United States Census Bureau. Archived from the original on July 14, 2011. Retrieved July 7, 2014.
- ↑ "Find a County". National Association of Counties. Archived from the original on 2011-05-31. Retrieved 2011-06-07.
- ↑ Adams, James N. (compiler) (1989), Keller, William E., ed., Illinois Place Names, Springfield: Illinois State Historical Society, p. 592, ISBN 0-912226-24-2
- ↑ Moses, John (1892), Illinois, Historical and Statistical, II, Chicago: Fergus Printing Company, p. 1137
- 1 2 "Population, Housing Units, Area, and Density: 2010 - County". United States Census Bureau. Retrieved 2015-07-12.
- 1 2 "Monthly Averages for Carlinville, Illinois". The Weather Channel. Archived from the original on 2012-10-23. Retrieved 2011-01-27.
- ↑ "Population and Housing Unit Estimates". Archived from the original on May 29, 2017. Retrieved June 9, 2017.
- ↑ "U.S. Decennial Census". United States Census Bureau. Archived from the original on May 12, 2015. Retrieved July 7, 2014.
- ↑ "Historical Census Browser". University of Virginia Library. Archived from the original on August 16, 2012. Retrieved July 7, 2014.
- ↑ "Population of Counties by Decennial Census: 1900 to 1990". United States Census Bureau. Archived from the original on April 24, 2014. Retrieved July 7, 2014.
- ↑ "Census 2000 PHC-T-4. Ranking Tables for Counties: 1990 and 2000" (PDF). United States Census Bureau. Archived (PDF) from the original on December 18, 2014. Retrieved July 7, 2014.
- 1 2 3 "DP-1 Profile of General Population and Housing Characteristics: 2010 Demographic Profile Data". United States Census Bureau. Retrieved 2015-07-12.
- ↑ "DP02 SELECTED SOCIAL CHARACTERISTICS IN THE UNITED STATES – 2006-2010 American Community Survey 5-Year Estimates". United States Census Bureau. Retrieved 2015-07-12.
- ↑ "DP03 SELECTED ECONOMIC CHARACTERISTICS – 2006-2010 American Community Survey 5-Year Estimates". United States Census Bureau. Retrieved 2015-07-12.
- ↑ Leip, David. "Dave Leip's Atlas of U.S. Presidential Elections". uselectionatlas.org. Archived from the original on 23 March 2018. Retrieved 1 May 2018.
External links
Places adjacent to Macoupin County, Illinois | ||||||||||
|---|---|---|---|---|---|---|---|---|---|---|
| ||||||||||
| Counties |  | |
|---|---|---|
| Major Cities (25,000+) | ||
| Cities (5,000-25,000) | ||
| Communities (1,000-5,000) |
| |
| Interstates | ||
| Airports | ||
| Colleges | ||
| Sports teams |
| |
| Topics | 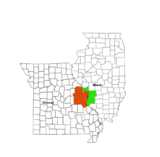 | |
|---|---|---|
| Central city | ||
| Largest cities (over 50,000 in 2010) | ||
| Medium-sized cities (over 20,000 in 2010) | ||
| Largest towns and villages (over 10,000 in 2010) |
| |
| Missouri Counties | ||
| Illinois Counties | ||
| Subregions | ||
Municipalities and communities of Macoupin County, Illinois, United States | ||
|---|---|---|
| Cities | ||
| Town | ||
| Villages | ||
| Townships | ||
| Unincorporated communities | ||
| Footnotes | ‡This city also has portions in adjacent county or counties | |
