Whiteside County, Illinois
| Whiteside County, Illinois | |
|---|---|
 Whiteside County Courthouse, Morrison | |
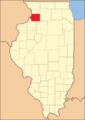
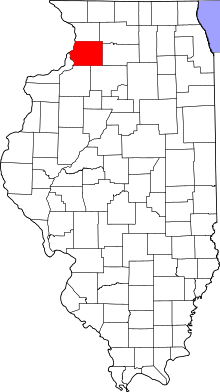 Location in the U.S. state of Illinois | |
 Illinois's location in the U.S. | |
| Founded | 1836 |
| Named for | Samuel Whiteside |
| Seat | Morrison |
| Largest city | Sterling |
| Area | |
| • Total | 697 sq mi (1,805 km2) |
| • Land | 684 sq mi (1,772 km2) |
| • Water | 12 sq mi (31 km2), 1.8% |
| Population | |
| • (2010) | 58,498 |
| • Density | 85/sq mi (33/km2) |
| Congressional district | 17th |
| Time zone | Central: UTC−6/−5 |
| Website |
www |
Whiteside County is a county located in the U.S. state of Illinois. According to the 2010 census, it had a population of 58,498.[1] Its county seat is Morrison.[2] The county is bounded on the west by the Mississippi River.
Whiteside County comprises the Sterling, IL Micropolitan Statistical Area, which is also included in the Dixon-Sterling, IL Combined Statistical Area.
Former U.S. President Ronald Reagan was born in the Whiteside County community of Tampico.
History
This area was long occupied by varying cultures of Native Americans.
Whiteside County was organized by European Americans in 1836 from parts of Jo Daviess and Henry counties. It was named for General Samuel Whiteside, an Illinois officer in the War of 1812 and Black Hawk War.
 Whiteside County's boundaries have remained unchanged since its creation in 1836.
Geography
According to the U.S. Census Bureau, the county has a total area of 697 square miles (1,810 km2), of which 684 square miles (1,770 km2) is land and 12 square miles (31 km2) (1.8%) is water.[3]
Climate and weather
| Morrison, Illinois | ||||||||||||||||||||||||||||||||||||||||||||||||||||||||||||
|---|---|---|---|---|---|---|---|---|---|---|---|---|---|---|---|---|---|---|---|---|---|---|---|---|---|---|---|---|---|---|---|---|---|---|---|---|---|---|---|---|---|---|---|---|---|---|---|---|---|---|---|---|---|---|---|---|---|---|---|---|
| Climate chart (explanation) | ||||||||||||||||||||||||||||||||||||||||||||||||||||||||||||
| ||||||||||||||||||||||||||||||||||||||||||||||||||||||||||||
| ||||||||||||||||||||||||||||||||||||||||||||||||||||||||||||
In recent years, average temperatures in the county seat of Morrison have ranged from a low of 10 °F (−12 °C) in January to a high of 85 °F (29 °C) in July, although a record low of −30 °F (−34 °C) was recorded in February 1905 and a record high of 112 °F (44 °C) was recorded in July 1936. Average monthly precipitation ranged from 1.51 inches (38 mm) in February to 4.69 inches (119 mm) in August.[4]
Major highways
Adjacent counties
- Carroll County (north)
- Ogle County (northeast)
- Lee County (east)
- Bureau County (southeast)
- Henry County (south)
- Rock Island County (southwest)
- Clinton County, Iowa (west)
National protected area
Demographics
| Historical population | |||
|---|---|---|---|
| Census | Pop. | %± | |
| 1840 | 2,514 | — | |
| 1850 | 5,361 | 113.2% | |
| 1860 | 18,737 | 249.5% | |
| 1870 | 27,503 | 46.8% | |
| 1880 | 30,885 | 12.3% | |
| 1890 | 30,854 | −0.1% | |
| 1900 | 34,710 | 12.5% | |
| 1910 | 34,507 | −0.6% | |
| 1920 | 36,174 | 4.8% | |
| 1930 | 39,019 | 7.9% | |
| 1940 | 43,338 | 11.1% | |
| 1950 | 49,336 | 13.8% | |
| 1960 | 59,887 | 21.4% | |
| 1970 | 62,877 | 5.0% | |
| 1980 | 65,970 | 4.9% | |
| 1990 | 60,186 | −8.8% | |
| 2000 | 60,653 | 0.8% | |
| 2010 | 58,498 | −3.6% | |
| Est. 2016 | 56,536 | [5] | −3.4% |
| U.S. Decennial Census[6] 1790-1960[7] 1900-1990[8] 1990-2000[9] 2010-2013[1] | |||
As of the 2010 United States Census, there were 58,498 people, 23,740 households, and 16,005 families residing in the county.[10] The population density was 85.5 inhabitants per square mile (33.0/km2). There were 25,770 housing units at an average density of 37.7 per square mile (14.6/km2).[3] The racial makeup of the county was 92.2% white, 1.3% black or African American, 0.5% Asian, 0.3% American Indian, 3.5% from other races, and 2.2% from two or more races. Those of Hispanic or Latino origin made up 11.0% of the population.[10] In terms of ancestry, 32.5% were German, 15.5% were Irish, 8.7% were Dutch, 8.6% were English, and 6.0% were American.[11]
Of the 23,740 households, 30.4% had children under the age of 18 living with them, 51.5% were married couples living together, 11.0% had a female householder with no husband present, 32.6% were non-families, and 27.7% of all households were made up of individuals. The average household size was 2.42 and the average family size was 2.92. The median age was 41.8 years.[10]
The median income for a household in the county was $45,266 and the median income for a family was $54,242. Males had a median income of $41,862 versus $29,157 for females. The per capita income for the county was $23,405. About 8.2% of families and 11.2% of the population were below the poverty line, including 17.6% of those under age 18 and 5.8% of those age 65 or over.[12]
Communities
Cities
Villages
Unincorporated communities
- Galt
- Malvern
Census-designated place
Townships
Whiteside County is divided into these townships:
Politics
| Year | Republican | Democratic | Third Parties |
|---|---|---|---|
| 2016 | 49.3% 12,615 | 43.1% 11,035 | 7.6% 1,932 |
| 2012 | 40.5% 10,448 | 57.4% 14,833 | 2.1% 547 |
| 2008 | 40.3% 10,883 | 57.8% 15,607 | 1.9% 504 |
| 2004 | 48.2% 12,959 | 51.1% 13,723 | 0.7% 191 |
| 2000 | 45.3% 11,252 | 51.9% 12,886 | 2.8% 699 |
| 1996 | 38.0% 8,859 | 51.0% 11,913 | 11.0% 2,572 |
| 1992 | 37.4% 10,146 | 45.4% 12,329 | 17.2% 4,678 |
| 1988 | 53.1% 12,978 | 46.3% 11,328 | 0.6% 156 |
| 1984 | 59.6% 16,743 | 40.0% 11,226 | 0.5% 127 |
| 1980 | 66.7% 17,389 | 27.6% 7,191 | 5.7% 1,484 |
| 1976 | 55.3% 14,308 | 43.5% 11,255 | 1.1% 291 |
| 1972 | 68.4% 17,305 | 31.3% 7,909 | 0.3% 87 |
| 1968 | 61.9% 15,177 | 33.2% 8,132 | 5.0% 1,225 |
| 1964 | 50.8% 12,940 | 49.2% 12,536 | 0.0% 0 |
| 1960 | 65.6% 17,434 | 34.3% 9,112 | 0.2% 46 |
| 1956 | 74.0% 17,589 | 25.9% 6,158 | 0.2% 37 |
| 1952 | 73.3% 17,294 | 26.4% 6,238 | 0.3% 67 |
| 1948 | 70.3% 12,922 | 28.8% 5,299 | 0.8% 154 |
| 1944 | 71.2% 14,162 | 27.9% 5,555 | 0.9% 171 |
| 1940 | 67.8% 15,752 | 31.7% 7,356 | 0.6% 134 |
| 1936 | 59.6% 12,666 | 37.6% 7,982 | 2.8% 595 |
| 1932 | 61.1% 11,388 | 37.6% 7,010 | 1.2% 228 |
| 1928 | 76.6% 13,580 | 23.0% 4,079 | 0.4% 69 |
| 1924 | 74.0% 11,532 | 12.6% 1,957 | 13.4% 2,087 |
| 1920 | 81.7% 10,923 | 14.4% 1,927 | 3.9% 513 |
| 1916 | 69.2% 10,045 | 26.5% 3,839 | 4.3% 623 |
| 1912 | 50.6% 3,904 | 25.9% 1,996 | 23.5% 1,811 |
| 1908 | 65.7% 5,257 | 26.8% 2,140 | 7.5% 600 |
| 1904 | 71.2% 5,636 | 19.5% 1,546 | 9.3% 737 |
| 1900 | 65.2% 5,663 | 31.8% 2,758 | 3.1% 266 |
| 1896 | 65.4% 5,577 | 32.7% 2,788 | 1.9% 159 |
| 1892 | 54.0% 3,819 | 39.3% 2,779 | 6.7% 474 |
See also
References
- 1 2 "State & County QuickFacts". United States Census Bureau. Retrieved 9 July 2014.
- ↑ "Find a County". National Association of Counties. Retrieved 7 June 2011.
- 1 2 "Population, Housing Units, Area, and Density: 2010 - County". United States Census Bureau. Retrieved 12 July 2015.
- 1 2 "Monthly Averages for Morrison, Illinois". The Weather Channel. Retrieved 27 January 2011.
- ↑ "Population and Housing Unit Estimates". Retrieved 9 June 2017.
- ↑ "U.S. Decennial Census". United States Census Bureau. Retrieved 9 July 2014.
- ↑ "Historical Census Browser". University of Virginia Library. Retrieved 9 July 2014.
- ↑ "Population of Counties by Decennial Census: 1900 to 1990". United States Census Bureau. Retrieved 9 July 2014.
- ↑ "Census 2000 PHC-T-4. Ranking Tables for Counties: 1990 and 2000" (PDF). United States Census Bureau. Retrieved 9 July 2014.
- 1 2 3 "Profile of General Population and Housing Characteristics: 2010 Demographic Profile Data". United States Census Bureau. Retrieved 12 July 2015.
- ↑ "Selected Social Characteristics in the United States – 2006-2010 American Community Survey 5-Year Estimates". United States Census Bureau. Retrieved 12 July 2015.
- ↑ "Selected Economic Characteristics – 2006-2010 American Community Survey 5-Year Estimates". United States Census Bureau. Retrieved 12 July 2015.
- ↑ US Election Atlas
External links
Places adjacent to Whiteside County, Illinois | ||||||||||
|---|---|---|---|---|---|---|---|---|---|---|
| ||||||||||
Municipalities and communities of Whiteside County, Illinois, United States | ||
|---|---|---|
| Cities | ||
| Villages | ||
| Townships | ||
| CDP | ||
| Other unincorporated communities |
| |
