Jo Daviess County, Illinois
| Jo Daviess County, Illinois | |
|---|---|
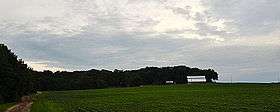
 Rugged terrain in the county, part of the Driftless Area | |
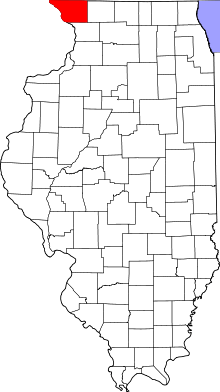 Location in the U.S. state of Illinois | |
 Illinois's location in the U.S. | |
| Founded | 1827 |
| Named for | Joseph Hamilton Daveiss |
| Seat | Galena |
| Largest city | Galena |
| Area | |
| • Total | 619 sq mi (1,603 km2) |
| • Land | 601 sq mi (1,557 km2) |
| • Water | 18 sq mi (47 km2), 2.9% |
| Population | |
| • (2010) | 22,691 |
| • Density | 38/sq mi (15/km2) |
| Congressional district | 17th |
| Time zone | Central: UTC−6/−5 |
| Website |
www |
Jo Daviess County (/ˈdeɪvɪs/) is a county located in the northwest corner of U.S. state of Illinois. According to the 2010 census, it had a population of 22,678.[1] Its county seat is Galena.[2]
Jo Daviess County is part of the Tri-State Area and is located near Dubuque, Iowa and Platteville, Wisconsin. As part of the Driftless Area, Jo Daviess County is known for its scenic stretches of road and valley views. Within Jo Daviess County lies Charles Mound, the highest natural point in Illinois.
History
Jo Daviess County was formed in 1827 out of Henry and Putnam Counties. It is named for Maj. Joseph Hamilton Daveiss, United States District Attorney for Kentucky, who was killed in 1811 at the Battle of Tippecanoe.[3] Maj. Daveiss' name is universally misspelled, as in the name of this and other counties. The local pronunciation is "Davis". Jo Daviess County was founded exclusively by immigrants from New England. These were old stock "Yankee" immigrants, meaning they were descended from the English Puritans who settled New England in the 1600s. The completion of the Erie Canal caused a surge in New England immigration to what was then the Northwest Territory. The end of the Black Hawk War led to an additional surge of immigration, once again coming almost exclusively from the six New England states as a result of overpopulation combined with land shortages in that region. Some of these later settlers were from upstate New York and had parents who had moved to that region from New England shortly after the Revolutionary War. New Englanders and New England transplants from upstate New York were the vast majority of Jo Daviess County's inhabitants during the first several decades of its history. These settlers were primarily members of the Congregational Church though due to the Second Great Awakening many of them had converted to Methodism and some had become Baptists before coming to what is now Jo Daviess County. The Congregational Church subsequently has gone through many divisions and some factions, including those in Jo Daviess County are now known as the Church of Christ and the United Church of Christ. As a result of this heritage the vast majority of inhabitants in Jo Daviess County, much like antebellum New England were overwhelmingly in favor of the abolitionist movement during the decades leading up to the Civil War.[4] In the late 1880s and early 1890s Irish and German migrants began moving into Jo Daviess County, most of these later immigrants did not move directly from Ireland and Germany, but rather from other areas in the Midwest where they had been living, particularly the state of Ohio.[5]
County border changes
- 1830- The northern border of Illinois and Wisconsin was formally established. Until that time, several Wisconsin towns actually were under the jurisdiction of Jo Daviess County.[6]
- 1831- Rock Island County was formed from a part of the county, along with a new northern extension of Henry County and Putnam County.
- 1836- Whiteside, Ogle, and Winnebago counties were formed from the southern and eastern sections of the county.
- 1837- Stephenson County was formed from the eastern section of the county.
- 1839- Carroll County was formed from the southern section of the county.
 Jo Daviess County at the time of its creation to 1831 (Wisconsin border adjustment not shown)
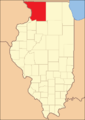 Jo Daviess between 1831 and 1836
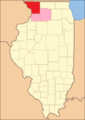 Jo Daviess between 1836 and 1837. Whiteside and Ogle Counties remained temporarily attached to Jo Daviess until county governments could be organized.[7]
 Jo Daviess between 1837 and 1839
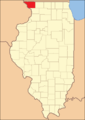 Jo Daviess reduced to its current size in 1839 by the creation of Carroll County and the organization of a government in Whiteside County
Geography
According to the U.S. Census Bureau, the county has a total area of 619 square miles (1,600 km2), of which 601 square miles (1,560 km2) is land and 18 square miles (47 km2) (2.9%) is water.[8]
Climate and weather
| Galena, Illinois | ||||||||||||||||||||||||||||||||||||||||||||||||||||||||||||
|---|---|---|---|---|---|---|---|---|---|---|---|---|---|---|---|---|---|---|---|---|---|---|---|---|---|---|---|---|---|---|---|---|---|---|---|---|---|---|---|---|---|---|---|---|---|---|---|---|---|---|---|---|---|---|---|---|---|---|---|---|
| Climate chart (explanation) | ||||||||||||||||||||||||||||||||||||||||||||||||||||||||||||
| ||||||||||||||||||||||||||||||||||||||||||||||||||||||||||||
| ||||||||||||||||||||||||||||||||||||||||||||||||||||||||||||
In recent years, average temperatures in the county seat of Galena have ranged from a low of 9 °F (−13 °C) in January to a high of 84 °F (29 °C) in July, although a record low of −35 °F (−37 °C) was recorded in February 1996 and a record high of 103 °F (39 °C) was recorded in August 1988. Average monthly precipitation ranged from 1.14 inches (29 mm) in January to 4.58 inches (116 mm) in June.[9]
Major highways
Adjacent counties
- Lafayette County, Wisconsin - north
- Stephenson County - east
- Carroll County - southeast
- Jackson County, Iowa - southwest
- Dubuque County, Iowa - west
- Grant County, Wisconsin - northwest
National protected area
Demographics
| Historical population | |||
|---|---|---|---|
| Census | Pop. | %± | |
| 1830 | 2,111 | — | |
| 1840 | 6,180 | 192.8% | |
| 1850 | 18,604 | 201.0% | |
| 1860 | 27,325 | 46.9% | |
| 1870 | 27,820 | 1.8% | |
| 1880 | 27,528 | −1.0% | |
| 1890 | 25,101 | −8.8% | |
| 1900 | 24,533 | −2.3% | |
| 1910 | 22,657 | −7.6% | |
| 1920 | 21,917 | −3.3% | |
| 1930 | 20,235 | −7.7% | |
| 1940 | 19,989 | −1.2% | |
| 1950 | 21,459 | 7.4% | |
| 1960 | 21,821 | 1.7% | |
| 1970 | 21,766 | −0.3% | |
| 1980 | 23,520 | 8.1% | |
| 1990 | 21,821 | −7.2% | |
| 2000 | 22,289 | 2.1% | |
| 2010 | 22,691 | 1.8% | |
| Est. 2016 | 21,770 | [10] | −4.1% |
| U.S. Decennial Census[11] 1790-1960[12] 1900-1990[13] 1990-2000[14] 2010-2013[1] | |||
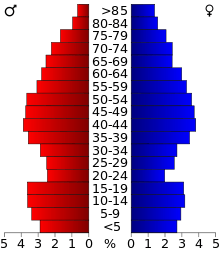
As of the 2010 United States Census, there were 22,678 people, 9,753 households, and 6,514 families residing in the county.[15] The population density was 37.7 inhabitants per square mile (14.6/km2). There were 13,574 housing units at an average density of 22.6 per square mile (8.7/km2).[8] The racial makeup of the county was 97.2% white, 0.5% black or African American, 0.3% Asian, 0.2% American Indian, 0.9% from other races, and 0.9% from two or more races. Those of Hispanic or Latino origin made up 2.7% of the population.[15] In terms of ancestry, 49.4% were German, 19.7% were Irish, 11.1% were English, and 8.5% were American.[16]
Of the 9,753 households, 25.3% had children under the age of 18 living with them, 55.9% were married couples living together, 7.0% had a female householder with no husband present, 33.2% were non-families, and 28.4% of all households were made up of individuals. The average household size was 2.31 and the average family size was 2.81. The median age was 47.1 years.[15]
The median income for a household in the county was $50,279 and the median income for a family was $60,381. Males had a median income of $38,372 versus $29,412 for females. The per capita income for the county was $26,819. About 5.6% of families and 8.4% of the population were below the poverty line, including 11.5% of those under age 18 and 6.4% of those age 65 or over.[17]
Communities
Cities
Villages
Census-designated places

Townships
Jo Daviess County is divided into twenty-three townships:
Government
| Year | Republican | Democratic | Third Parties |
|---|---|---|---|
| 2016 | 54.0% 6,121 | 39.4% 4,462 | 6.6% 751 |
| 2012 | 48.4% 5,534 | 49.6% 5,667 | 2.0% 228 |
| 2008 | 44.0% 5,170 | 54.5% 6,403 | 1.5% 177 |
| 2004 | 53.3% 6,174 | 45.9% 5,311 | 0.9% 99 |
| 2000 | 51.4% 5,304 | 44.4% 4,585 | 4.2% 433 |
| 1996 | 42.1% 3,915 | 44.8% 4,171 | 13.1% 1,220 |
| 1992 | 40.6% 4,249 | 38.7% 4,044 | 20.7% 2,161 |
| 1988 | 53.9% 4,923 | 45.3% 4,141 | 0.8% 73 |
| 1984 | 63.2% 5,877 | 36.0% 3,348 | 0.8% 77 |
| 1980 | 57.8% 5,186 | 29.9% 2,678 | 12.3% 1,107 |
| 1976 | 56.9% 5,478 | 41.3% 3,979 | 1.8% 171 |
| 1972 | 63.4% 5,763 | 36.5% 3,318 | 0.2% 16 |
| 1968 | 59.1% 5,563 | 34.3% 3,228 | 6.6% 617 |
| 1964 | 48.9% 4,607 | 51.1% 4,818 | |
| 1960 | 58.7% 6,111 | 41.2% 4,293 | 0.1% 13 |
| 1956 | 69.8% 6,762 | 30.0% 2,906 | 0.2% 18 |
| 1952 | 71.3% 7,132 | 28.6% 2,858 | 0.1% 13 |
| 1948 | 61.8% 5,299 | 37.6% 3,220 | 0.6% 51 |
| 1944 | 66.0% 6,465 | 33.7% 3,298 | 0.4% 34 |
| 1940 | 65.1% 7,285 | 34.5% 3,864 | 0.4% 43 |
| 1936 | 51.3% 5,619 | 46.4% 5,079 | 2.3% 252 |
| 1932 | 44.4% 4,520 | 54.0% 5,497 | 1.6% 160 |
| 1928 | 61.6% 6,333 | 37.5% 3,856 | 0.9% 94 |
| 1924 | 50.4% 4,864 | 15.3% 1,477 | 34.4% 3,318 |
| 1920 | 76.3% 6,098 | 20.1% 1,604 | 3.7% 295 |
| 1916 | 60.0% 5,775 | 36.4% 3,505 | 3.6% 349 |
| 1912 | 22.6% 1,233 | 40.8% 2,226 | 36.7% 2,001 |
| 1908 | 54.6% 3,132 | 40.3% 2,310 | 5.2% 297 |
| 1904 | 63.1% 3,388 | 29.8% 1,598 | 7.1% 382 |
| 1900 | 56.1% 3,444 | 41.4% 2,543 | 2.5% 156 |
| 1896 | 58.4% 3,594 | 38.8% 2,391 | 2.8% 173 |
| 1892 | 46.7% 2,680 | 48.7% 2,793 | 4.7% 267 |
Jo Daviess County is fairly typical of Yankee Northern Illinois in its political history, although it has generally voted more Democratic than most nearby rural counties in the region. It voted Democratic only four times between 1856 and 1992 – for Grover Cleveland in 1892, Woodrow Wilson in 1912, Franklin D. Roosevelt in 1932, and Lyndon B. Johnson in 1964. Between 1996 and 2012, the increasing Southern and Evangelical orientation of the GOP turned Jo Daviess into a swing county, voting for the national winner each time. Increasing concern about lack of employment opportunities in the “Rust Belt” caused a powerful swing to populist Republican Donald Trump in 2016: Trump obtained the best GOP record in Jo Daviess County since Ronald Reagan when he came within 3,819 votes of a fifty-state cleansweep in 1984.
Councillors
- Ron Smith (R), District 9 (Council Hill & East Galena), Chairman
- Brandon Behlke (R), District 11 (West Galena II & Rawlins)
- Gerald Bennett (D), District 6 (Apple River & Warren I)
- Merri Belage (R), District 13 (Elizabeth & Rice), Vice-Chair
- Bill Bingham (R), District 4 (Vinegar Hill & Menominee)
- Jody Covert (R), District 14 (Hanover & Rice)
- Rick Dittmar (R), District 15 (Berreman, Derinda, Pleasant Valley, & Woodbine)
- Robert Heuerman (R), District 16 (Stockton I & Wards Grove)
- Dan Hughes (R), District 7 (Nora, Warren II, & Rush)
- Randy Jobgen (D), District 10 (West Galena I)
- Steve McIntyre (R), District 8 (Thompson & Guilford)
- Margie Montelius (D), District 1 (Dunlieth I)
- John O'Boyle (R), District 17 (Stockton II & Rush)
- Steve Rutz (R), District 3 (Dunlieth III)
- Terry Stoffregen (R), District 12 (West Galena III & Rawlins)
- R.J. Winkelhake (R), District 5 (Scales Mound & Guilford)
- Don Zillig (D), District 2 (Dunlieth II)
See also
References
- 1 2 "State & County QuickFacts". United States Census Bureau. Archived from the original on July 12, 2011. Retrieved July 6, 2014.
- ↑ "Find a County". National Association of Counties. Archived from the original on May 10, 2015. Retrieved 2011-06-07.
- ↑ Gannett, Henry (1905). The Origin of Certain Place Names in the United States. Govt. Print. Off. p. 169.
- ↑ The History of Jo Daviess County, Illinois: Containing a History of the County, Its Cities, Towns, Etc., a Biographical Directory of Its Citizens, War Record of Its Volunteers in the Late Rebellion by H.F. Kett & Company, 1878
- ↑ The Early History of Northern Illinois by Charles Knapp Carpenter Ogle County Federation of Women's Clubs, 1948
- ↑ "Archived copy". Archived from the original on 2008-10-13. Retrieved 2008-04-29. Jo Daviess County Courthouse: History Highlights
- ↑ White, Jesse. Origin and Evolution of Illinois Counties. State of Illinois, March 2010.
- 1 2 "Population, Housing Units, Area, and Density: 2010 - County". United States Census Bureau. Retrieved 2015-07-12.
- 1 2 "Monthly Averages for Galena, Illinois". The Weather Channel. Retrieved 2011-01-27.
- ↑ "Population and Housing Unit Estimates". Retrieved June 9, 2017.
- ↑ "U.S. Decennial Census". United States Census Bureau. Archived from the original on May 12, 2015. Retrieved July 6, 2014.
- ↑ "Historical Census Browser". University of Virginia Library. Retrieved July 6, 2014.
- ↑ "Population of Counties by Decennial Census: 1900 to 1990". United States Census Bureau. Retrieved July 6, 2014.
- ↑ "Census 2000 PHC-T-4. Ranking Tables for Counties: 1990 and 2000" (PDF). United States Census Bureau. Retrieved July 6, 2014.
- 1 2 3 "DP-1 Profile of General Population and Housing Characteristics: 2010 Demographic Profile Data". United States Census Bureau. Retrieved 2015-07-12.
- ↑ "DP02 SELECTED SOCIAL CHARACTERISTICS IN THE UNITED STATES – 2006-2010 American Community Survey 5-Year Estimates". United States Census Bureau. Retrieved 2015-07-12.
- ↑ "DP03 SELECTED ECONOMIC CHARACTERISTICS – 2006-2010 American Community Survey 5-Year Estimates". United States Census Bureau. Retrieved 2015-07-12.
- ↑ Leip, David. "Dave Leip's Atlas of U.S. Presidential Elections". uselectionatlas.org.
External links
- Jo Daviess County, IL official website
- Galena/Jo Daviess County Convention & Visitors Bureau
- Who was Jo Daviess?
Places adjacent to Jo Daviess County, Illinois | ||||||||||
|---|---|---|---|---|---|---|---|---|---|---|
| ||||||||||
Municipalities and communities of Jo Daviess County, Illinois, United States | ||
|---|---|---|
| Cities | ||
| Villages | ||
| Townships | ||
| CDPs | ||
| Other unincorporated communities | ||
| Ghost town | ||
