Moultrie County, Illinois
| Moultrie County, Illinois | |
|---|---|
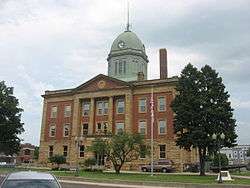 Moultrie County Courthouse in Sullivan | |
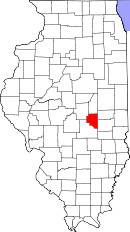 Location in the U.S. state of Illinois | |
 Illinois's location in the U.S. | |
| Founded | 1843 |
| Named for | William Moultrie |
| Seat | Sullivan |
| Largest city | Sullivan |
| Area | |
| • Total | 344 sq mi (891 km2) |
| • Land | 336 sq mi (870 km2) |
| • Water | 8.5 sq mi (22 km2), 2.5% |
| Population | |
| • (2010) | 14,846 |
| • Density | 44/sq mi (17/km2) |
| Congressional district | 15th |
| Time zone | Central: UTC−6/−5 |
| Website |
www |
Moultrie County is a county located in the U.S. state of Illinois. According to the 2010 census, it had a population of 14,846.[1] Its county seat is Sullivan.[2] The name is pronounced as in "mole tree", unlike the pronunciation of its namesake, South Carolinian Revolutionary War hero William Moultrie.
History
Moultrie County was formed in 1843 out of Shelby and Macon counties. It is named for South Carolina General, and later Governor, William Moultrie. General Moultrie defended Sullivan's Island, South Carolina from British attack in 1776. The site was later renamed Fort Moultrie. Nearby Jasper County was named for Sgt. William Jasper, another hero of the defense of Sullivan's Island.
The official flag of the county is the Moultrie Flag, which was flown over the new fortress on Sullivan's Island, when Moultrie defended it, and was designed by Moultrie, himself. It went on to become iconic of liberty in the South.
When Abraham Kellar of Lovington, John Cook of Marrowbone, and John Fleming of Nelson proposed the formation of a new county from Macon, Shelby, and Coles counties, Macon gave up a strip of “worthless swamp” that is now among the most fertile land in the world, but Shelby and Coles voters refused to give up any land. Finally, Shelby County gave up some of its land to make a zig-zag border with Moultrie County.
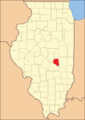 Moultrie County at the time of its creation in 1843
 Moultrie Flag, the official flag of the county
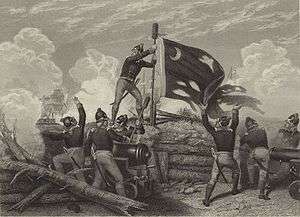 The Moultrie Flag being raised by Sergeant William Jasper
Geography
According to the U.S. Census Bureau, the county has a total area of 344 square miles (890 km2), of which 336 square miles (870 km2) is land and 8.5 square miles (22 km2) (2.5%) is water.[3]
Climate and weather
| Sullivan, Illinois | ||||||||||||||||||||||||||||||||||||||||||||||||||||||||||||
|---|---|---|---|---|---|---|---|---|---|---|---|---|---|---|---|---|---|---|---|---|---|---|---|---|---|---|---|---|---|---|---|---|---|---|---|---|---|---|---|---|---|---|---|---|---|---|---|---|---|---|---|---|---|---|---|---|---|---|---|---|
| Climate chart (explanation) | ||||||||||||||||||||||||||||||||||||||||||||||||||||||||||||
| ||||||||||||||||||||||||||||||||||||||||||||||||||||||||||||
| ||||||||||||||||||||||||||||||||||||||||||||||||||||||||||||
In recent years, average temperatures in the county seat of Sullivan have ranged from a low of 19 °F (−7 °C) in January to a high of 87 °F (31 °C) in July, although a record low of −26 °F (−32 °C) was recorded in January 1915 and a record high of 111 °F (44 °C) was recorded in July 1936. Average monthly precipitation ranged from 1.89 inches (48 mm) in February to 4.05 inches (103 mm) in June.[4]
Major highways
Adjacent counties
- Piatt County - north
- Douglas County - east
- Coles County - east
- Shelby County - south
- Macon County - northwest
Demographics
| Historical population | |||
|---|---|---|---|
| Census | Pop. | %± | |
| 1850 | 3,234 | — | |
| 1860 | 6,385 | 97.4% | |
| 1870 | 10,385 | 62.6% | |
| 1880 | 13,699 | 31.9% | |
| 1890 | 14,481 | 5.7% | |
| 1900 | 15,224 | 5.1% | |
| 1910 | 14,630 | −3.9% | |
| 1920 | 14,839 | 1.4% | |
| 1930 | 13,247 | −10.7% | |
| 1940 | 13,477 | 1.7% | |
| 1950 | 13,171 | −2.3% | |
| 1960 | 13,635 | 3.5% | |
| 1970 | 13,263 | −2.7% | |
| 1980 | 14,546 | 9.7% | |
| 1990 | 13,930 | −4.2% | |
| 2000 | 14,287 | 2.6% | |
| 2010 | 14,846 | 3.9% | |
| Est. 2016 | 14,827 | [5] | −0.1% |
| U.S. Decennial Census[6] 1790-1960[7] 1900-1990[8] 1990-2000[9] 2010-2013[1] | |||
As of the 2010 United States Census, there were 14,846 people, 5,758 households, and 4,053 families residing in the county.[10] The population density was 44.2 inhabitants per square mile (17.1/km2). There were 6,260 housing units at an average density of 18.6 per square mile (7.2/km2).[3] The racial makeup of the county was 98.5% white, 0.3% black or African American, 0.2% Asian, 0.2% American Indian, 0.2% from other races, and 0.6% from two or more races. Those of Hispanic or Latino origin made up 0.9% of the population.[10] In terms of ancestry, 23.8% were German, 12.0% were Irish, 11.4% were American, and 10.9% were English.[11]
Of the 5,758 households, 31.8% had children under the age of 18 living with them, 57.6% were married couples living together, 8.9% had a female householder with no husband present, 29.6% were non-families, and 25.5% of all households were made up of individuals. The average household size was 2.51 and the average family size was 3.01. The median age was 40.3 years.[10]
The median income for a household in the county was $46,364 and the median income for a family was $54,494. Males had a median income of $42,581 versus $26,799 for females. The per capita income for the county was $22,954. About 6.2% of families and 11.0% of the population were below the poverty line, including 17.2% of those under age 18 and 6.7% of those age 65 or over.[12]
Communities
City
Villages
Unincorporated Communities
- Lake City
- Bruce
- Kirksville
- Cadwell
Townships
Education
Moultrie County is served by three school districts.
- Sullivan Community Unit School District 300
- Okaw Valley Community Unit School District 302
- Arthur-Lovington/Atwood-Hammond Community Unit School District 305
Politics
| Year | Republican | Democratic | Third Parties |
|---|---|---|---|
| 2016 | 70.9% 4,455 | 23.6% 1,481 | 5.5% 347 |
| 2012 | 62.3% 3,784 | 35.3% 2,144 | 2.4% 147 |
| 2008 | 55.3% 3,471 | 42.5% 2,668 | 2.1% 134 |
| 2004 | 62.3% 4,028 | 36.9% 2,388 | 0.8% 50 |
| 2000 | 53.4% 3,058 | 44.2% 2,529 | 2.4% 138 |
| 1996 | 40.3% 2,199 | 48.2% 2,629 | 11.4% 623 |
| 1992 | 31.9% 2,065 | 47.3% 3,056 | 20.8% 1,344 |
| 1988 | 51.0% 3,167 | 48.5% 3,013 | 0.5% 32 |
| 1984 | 59.2% 3,593 | 40.5% 2,458 | 0.4% 21 |
| 1980 | 56.7% 3,495 | 37.9% 2,332 | 5.4% 334 |
| 1976 | 45.4% 2,803 | 54.0% 3,332 | 0.6% 34 |
| 1972 | 57.1% 3,143 | 42.7% 2,350 | 0.3% 14 |
| 1968 | 50.5% 3,094 | 39.9% 2,447 | 9.6% 586 |
| 1964 | 40.0% 2,493 | 60.0% 3,733 | 0.0% 0 |
| 1960 | 54.9% 3,752 | 45.1% 3,079 | 0.0% 0 |
| 1956 | 57.7% 3,756 | 42.2% 2,751 | 0.1% 8 |
| 1952 | 59.1% 3,880 | 40.8% 2,675 | 0.1% 8 |
| 1948 | 49.4% 3,043 | 49.3% 3,037 | 1.3% 81 |
| 1944 | 52.3% 3,180 | 46.9% 2,853 | 0.8% 46 |
| 1940 | 49.3% 3,636 | 50.1% 3,696 | 0.6% 41 |
| 1936 | 42.4% 3,074 | 56.7% 4,110 | 0.9% 65 |
| 1932 | 35.4% 2,353 | 63.5% 4,219 | 1.1% 74 |
| 1928 | 60.3% 3,310 | 39.5% 2,168 | 0.2% 10 |
| 1924 | 53.1% 3,001 | 42.5% 2,403 | 4.4% 248 |
| 1920 | 55.8% 3,279 | 42.7% 2,513 | 1.5% 89 |
| 1916 | 45.0% 2,933 | 51.7% 3,370 | 3.4% 222 |
| 1912 | 26.7% 853 | 47.0% 1,501 | 26.4% 842 |
| 1908 | 48.4% 1,704 | 48.2% 1,695 | 3.4% 119 |
| 1904 | 50.6% 1,719 | 43.3% 1,470 | 6.1% 208 |
| 1900 | 45.9% 1,728 | 52.4% 1,975 | 1.7% 65 |
| 1896 | 44.8% 1,711 | 54.4% 2,077 | 0.8% 32 |
| 1892 | 39.2% 1,287 | 50.8% 1,670 | 10.0% 329 |
See also
References
- 1 2 "State & County QuickFacts". United States Census Bureau. Archived from the original on July 15, 2011. Retrieved July 7, 2014.
- ↑ "Find a County". National Association of Counties. Retrieved 2011-06-07.
- 1 2 "Population, Housing Units, Area, and Density: 2010 - County". United States Census Bureau. Retrieved 2015-07-12.
- 1 2 "Monthly Averages for Sullivan, Illinois". The Weather Channel. Retrieved 2011-01-27.
- ↑ "Population and Housing Unit Estimates". Retrieved June 9, 2017.
- ↑ "U.S. Decennial Census". United States Census Bureau. Retrieved July 7, 2014.
- ↑ "Historical Census Browser". University of Virginia Library. Retrieved July 7, 2014.
- ↑ "Population of Counties by Decennial Census: 1900 to 1990". United States Census Bureau. Retrieved July 7, 2014.
- ↑ "Census 2000 PHC-T-4. Ranking Tables for Counties: 1990 and 2000" (PDF). United States Census Bureau. Retrieved July 7, 2014.
- 1 2 3 "DP-1 Profile of General Population and Housing Characteristics: 2010 Demographic Profile Data". United States Census Bureau. Retrieved 2015-07-12.
- ↑ "DP02 SELECTED SOCIAL CHARACTERISTICS IN THE UNITED STATES – 2006-2010 American Community Survey 5-Year Estimates". United States Census Bureau. Retrieved 2015-07-12.
- ↑ "DP03 SELECTED ECONOMIC CHARACTERISTICS – 2006-2010 American Community Survey 5-Year Estimates". United States Census Bureau. Retrieved 2015-07-12.
- ↑ Leip, David. "Dave Leip's Atlas of U.S. Presidential Elections". uselectionatlas.org. Retrieved 31 March 2018.
Places adjacent to Moultrie County, Illinois | ||||||||||
|---|---|---|---|---|---|---|---|---|---|---|
| ||||||||||
Municipalities and communities of Moultrie County, Illinois, United States | ||
|---|---|---|
| Cities | ||
| Villages | ||
| Townships | ||
| Unincorporated communities | ||
| Footnotes | ‡This populated place also has portions in an adjacent county or counties | |
