Kane County, Illinois
| Kane County, Illinois | ||
|---|---|---|
| County | ||
| County of Kane | ||
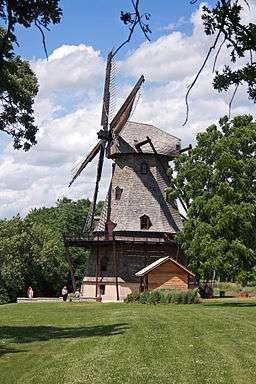 The Fabyan Windmill in Geneva is on the National Register of Historic Places in Kane County, Illinois. | ||
| ||
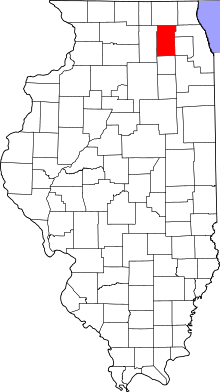 Location in the U.S. state of Illinois | ||
 Illinois's location in the U.S. | ||
| Founded | January 16, 1836 | |
| Named for | Elias Kane | |
| Seat | Geneva | |
| Largest city | Aurora | |
| Area | ||
| • Total | 524 sq mi (1,357 km2) | |
| • Land | 520 sq mi (1,347 km2) | |
| • Water | 4.1 sq mi (11 km2), 0.8% | |
| Population (est.) | ||
| • (2015) | 530,847 | |
| • Density | 991/sq mi (383/km2) | |
| Congressional districts | 6th, 8th, 11th, 14th | |
| Time zone | Central: UTC−6/−5 | |
| Website |
countyofkane | |
|
Footnotes: [1] | ||

Kane County is a county in the U.S. state of Illinois. According to the 2010 census, it has a population of 515,269,[2] making it the fifth-most populous county in Illinois. Its county seat is Geneva,[3] and its largest city is Aurora.
Kane County is one of the collar counties of the Chicago–Naperville–Elgin, IL–IN–WI Metropolitan Statistical Area.
History
Kane County was formed out of LaSalle County in 1836. The county was named in honor of Elias Kane, United States Senator from Illinois, and the first Secretary of State of Illinois.[4]
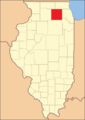 Kane County from the time of its creation to 1837, when DeKalb County was split off
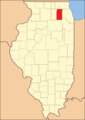 Kane County between 1837 and 1841
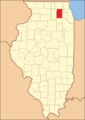 Kane County in 1841, reduced to its present size
Geography
According to the U.S. Census Bureau, the county's area was 524 square miles (1,360 km2), of which 520 square miles (1,300 km2) is land and 4.1 square miles (11 km2) (0.8%) is water.[5] Its largest cities are along the Fox River.
Climate
| Geneva, Illinois | ||||||||||||||||||||||||||||||||||||||||||||||||||||||||||||
|---|---|---|---|---|---|---|---|---|---|---|---|---|---|---|---|---|---|---|---|---|---|---|---|---|---|---|---|---|---|---|---|---|---|---|---|---|---|---|---|---|---|---|---|---|---|---|---|---|---|---|---|---|---|---|---|---|---|---|---|---|
| Climate chart (explanation) | ||||||||||||||||||||||||||||||||||||||||||||||||||||||||||||
| ||||||||||||||||||||||||||||||||||||||||||||||||||||||||||||
| ||||||||||||||||||||||||||||||||||||||||||||||||||||||||||||
In recent years, average temperatures in the county seat of Geneva have ranged from a low of 10 °F (−12 °C) in January to a high of 84 °F (29 °C) in July, although a record low of −26 °F (−32 °C) was recorded in January 1985 and a record high of 111 °F (44 °C) was recorded in July 1936. The average monthly precipitation ranged from 1.52 inches (39 mm) in February to 4.39 inches (112 mm) in July.[6]
Adjacent counties
- McHenry County (north)
- Cook County (east)
- DuPage County (east)
- Will County (southeast)
- Kendall County (south)
- DeKalb County (west)
Forest preserves
Kane County has an extensive forest preserve program, with numerous nature preserves, historic sites, and trails.[7]
- Almon Underwood Prairie
- Andersen Woods
- Arlene Shoemaker
- Aurora West
- Barnes
- Big Rock Forest Preserve & Campground
- Binnie
- Blackberry Maples
- Bliss Woods
- Bolcum Road Wetlands
- Bowes Creek Woods
- Braeburn Marsh
- Brewster Creek
- Brunner Family
- Buffalo Park
- Burlington Prairie
- Burnidge Forest Preserve/Paul Wolff Campground
- Camp Tomo Chi-Chi Knolls
- Campton
- Cardinal Creek
- Culver
- Deer Valley
- Dick Young
- Eagles
- Elgin Shores
- Fabyan
- Ferson Creek
- Fitchie Creek
- Fox River Bluff & Fox River Bluff West
- Fox River Shores
- Freeman Kame – Meagher
- Glenwood Park
- Grunwald Farms
- Gunnar Anderson
- Hampshire South
- Hannaford Woods/Nickels Farm
- Helm Woods
- Hughes Creek
- Jack E. Cook Park
- Jelkes Creek
- Johnson's Mound
- Jon J. Duerr
- Kenyon Farm
- Lake Run
- LeRoy Oakes
- Les Arends
- Little Woods
- Lone Grove
- McLean Boulevard Fen
- Meissner Prairie – Corron
- Mill Creek
- Muirhead Springs
- New Haven Park
- Oakhurst
- Otter Creek
- Pingree Grove
- Poplar Creek
- Prairie Green
- Raceway Woods
- Raymond Street
- Regole
- Rutland
- Sauer Family Prairie Kame
- Schweitzer Woods
- Settler's Hill
- Sleepy Hollow Ravine
- Tekakwitha Woods
- Tyler Creek
- Virgil
- Voyageur's Landing
- Willoughby Farms
Demographics
| Historical population | |||
|---|---|---|---|
| Census | Pop. | %± | |
| 1840 | 6,501 | — | |
| 1850 | 16,703 | 156.9% | |
| 1860 | 30,062 | 80.0% | |
| 1870 | 39,091 | 30.0% | |
| 1880 | 44,939 | 15.0% | |
| 1890 | 65,061 | 44.8% | |
| 1900 | 78,792 | 21.1% | |
| 1910 | 91,862 | 16.6% | |
| 1920 | 99,499 | 8.3% | |
| 1930 | 125,327 | 26.0% | |
| 1940 | 130,206 | 3.9% | |
| 1950 | 150,388 | 15.5% | |
| 1960 | 208,246 | 38.5% | |
| 1970 | 251,005 | 20.5% | |
| 1980 | 278,405 | 10.9% | |
| 1990 | 317,471 | 14.0% | |
| 2000 | 404,119 | 27.3% | |
| 2010 | 515,269 | 27.5% | |
| Est. 2017 | 534,667 | [8] | 3.8% |
| U.S. Decennial Census[9] 1790–1960[10] 1900–1990[11] 1990–2000[12] 2010–2013[2] | |||
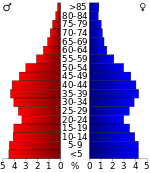
As of the 2010 United States Census, there were 515,269 people, 170,479 households, and 128,323 families residing in the county.[13] The population density was 990.8 inhabitants per square mile (382.6/km2). There were 182,047 housing units at an average density of 350.1 per square mile (135.2/km2).[5] The racial makeup of the county was 74.6% white, 5.7% black or African American, 3.5% Asian, 0.6% American Indian, 13.0% from other races, and 2.6% from two or more races. Those of Hispanic or Latino origin made up 30.7% of the population.[13] In terms of ancestry, 24.3% were German, 13.0% were Irish, 7.9% were Polish, 7.4% were Italian, 7.1% were English, and 2.4% were American.[14]
Of the 170,479 households, 42.3% had children under the age of 18 living with them, 59.2% were married couples living together, 11.0% had a female householder with no husband present, 24.7% were non-families, and 19.8% of all households were made up of individuals. The average household size was 2.98 and the average family size was 3.45. The median age was 34.5 years.[13]
The median income for a household in the county was $67,767 and the median income for a family was $77,998. Males had a median income of $53,833 versus $39,206 for females. The per capita income for the county was $29,480. About 7.0% of families and 9.1% of the population were below the poverty line, including 13.5% of those under age 18 and 5.7% of those age 65 or over.[15]
Education
Infrastructure
Health care
There are several hospitals serving the county:
- Advocate Sherman Hospital, Elgin
- Delnor Hospital, Geneva
- Presence Mercy Medical Center, Aurora
- Presence Saint Joseph Hospital, Elgin
- Rush-Copley Medical Center, Aurora
Transportation
Airport
Major highways
Communities
Cities
Villages
- Algonquin (part)
- Barrington Hills (mostly)
- Bartlett (part)
- Big Rock
- Burlington
- Campton Hills
- Carpentersville
- East Dundee (part)
- Elburn
- Gilberts
- Hampshire
- Hoffman Estates (part)
- Huntley (mostly)
- Kaneville
- Lily Lake
- Maple Park (part)
- Montgomery (mostly)
- North Aurora
- Pingree Grove
- Sleepy Hollow
- South Elgin
- Sugar Grove
- Virgil
- Wayne (part)
- West Dundee
Census-designated place
Other unincorporated communities
Townships
Politics
| Year | Republican | Democratic | Third Parties |
|---|---|---|---|
| 2016 | 41.4% 82,734 | 51.9% 103,665 | 6.7% 13,288 |
| 2012 | 48.6% 88,335 | 49.7% 90,332 | 1.7% 3,058 |
| 2008 | 43.4% 83,963 | 55.2% 106,756 | 1.4% 2,644 |
| 2004 | 55.0% 92,065 | 44.1% 73,813 | 0.9% 1,419 |
| 2000 | 54.5% 76,996 | 42.5% 60,127 | 3.0% 4,282 |
| 1996 | 47.4% 54,375 | 41.8% 47,902 | 10.8% 12,416 |
| 1992 | 43.5% 55,684 | 34.8% 44,568 | 21.6% 27,686 |
| 1988 | 64.1% 66,283 | 35.2% 36,366 | 0.7% 763 |
| 1984 | 69.1% 72,655 | 30.3% 31,875 | 0.6% 629 |
| 1980 | 61.8% 64,106 | 28.0% 29,015 | 10.3% 10,663 |
| 1976 | 62.2% 59,275 | 35.7% 34,057 | 2.1% 2,042 |
| 1972 | 69.9% 64,546 | 29.8% 27,525 | 0.3% 306 |
| 1968 | 61.9% 54,144 | 30.4% 26,609 | 7.6% 6,667 |
| 1964 | 53.3% 46,391 | 46.7% 40,703 | |
| 1960 | 63.8% 55,389 | 36.1% 31,279 | 0.1% 93 |
| 1956 | 72.8% 56,009 | 27.1% 20,848 | 0.1% 59 |
| 1952 | 67.8% 50,801 | 32.1% 24,058 | 0.1% 96 |
| 1948 | 64.4% 39,284 | 34.7% 21,176 | 0.9% 532 |
| 1944 | 62.2% 38,689 | 37.5% 23,362 | 0.3% 185 |
| 1940 | 61.8% 41,949 | 37.8% 25,676 | 0.4% 289 |
| 1936 | 52.6% 33,491 | 44.2% 28,187 | 3.2% 2,051 |
| 1932 | 56.2% 32,934 | 42.0% 24,638 | 1.9% 1,084 |
| 1928 | 69.9% 38,236 | 29.6% 16,184 | 0.5% 253 |
| 1924 | 76.3% 32,717 | 8.2% 3,517 | 15.5% 6,624 |
| 1920 | 82.8% 26,832 | 13.3% 4,323 | 3.8% 1,243 |
| 1916 | 67.7% 23,868 | 28.0% 9,875 | 4.3% 1,506 |
| 1912 | 12.7% 2,415 | 23.1% 4,394 | 64.3% 12,257 |
| 1908 | 70.3% 12,840 | 23.6% 4,316 | 6.1% 1,111 |
| 1904 | 75.6% 12,638 | 16.8% 2,799 | 7.6% 1,271 |
| 1900 | 67.6% 12,031 | 29.5% 5,259 | 2.9% 521 |
| 1896 | 69.9% 12,133 | 28.0% 4,852 | 2.1% 362 |
| 1892 | 53.8% 7,977 | 39.0% 5,778 | 7.2% 1,072 |
As one of the Yankee-settled and prosperous suburban “collar counties”, Kane County was a stronghold of the Free Soil Party in its first few elections, being one of nine Illinois counties to give a plurality to Martin van Buren in 1848. Kane County then unsurprisingly became solidly Republican for the century and a half following that party’s formation. It voted for the GOP Presidential nominee in every election between 1856 and 2004 except that of 1912 when the Republican Party was mortally divided and Progressive Theodore Roosevelt carried the county with a majority of the vote over conservative incumbent William Howard Taft.
The gradual shift of the GOP towards white Southern Evangelicals, however, has led the generally moderate electorate of Kane and the other “collar counties” to trend towards the Democratic Party. In 2008, Illinois-bred Barack Obama became the first Democrat to carry Kane County since Franklin Pierce in 1852, and the first ever to win an absolute majority of the county’s vote (the previous two Democratic winners, Pierce and James K. Polk in 1844 had both gained only pluralities due to strong Free Soil votes). Obama won a plurality in 2012, and Hillary Clinton improved upon Obama’s showing to become the second Democrat to win a majority in 2016.
Taxes
In May 2017, the Kane County Reporter reported that Kane County taxpayers would see a total of $223 million in state income tax increases if a tax bill passed by the Democrat-controlled Illinois State Senate became law. Kane County communities that would see the largest collective tax increases include West St. Charles ($19.4 million), Geneva ($17.6 million), Central St. Charles ($16.5 million), Batavia ($13.6 million) and Algonquin ($13.5 million).[17]
See also
References
- ↑ U.S. Geological Survey Geographic Names Information System: Kane County, Illinois
- 1 2 "State & County QuickFacts". United States Census Bureau. Archived from the original on July 12, 2011. Retrieved July 6, 2014.
- ↑ "Find a County". National Association of Counties. Archived from the original on 2011-05-31. Retrieved 2011-06-07.
- ↑ Gannett, Henry (1905). The Origin of Certain Place Names in the United States. Govt. Print. Off. p. 172.
- 1 2 "Population, Housing Units, Area, and Density: 2010 – County". United States Census Bureau. Retrieved 2015-07-12.
- 1 2 "Monthly Averages for Geneva, Illinois". The Weather Channel. Retrieved 2011-01-27.
- ↑ "Forest Preserves". Forest Preserve District of Kane County.
- ↑ "Population and Housing Unit Estimates". Retrieved April 8, 2018.
- ↑ "U.S. Decennial Census". United States Census Bureau. Archived from the original on May 12, 2015. Retrieved April 16, 2015.
- ↑ "Historical Census Browser". University of Virginia Library. Retrieved July 6, 2014.
- ↑ "Population of Counties by Decennial Census: 1900 to 1990". United States Census Bureau. Retrieved July 6, 2014.
- ↑ "Census 2000 PHC-T-4. Ranking Tables for Counties: 1990 and 2000" (PDF). United States Census Bureau. Retrieved July 6, 2014.
- 1 2 3 "DP-1 Profile of General Population and Housing Characteristics: 2010 Demographic Profile Data". United States Census Bureau. Retrieved 2015-07-12.
- ↑ "DP02 SELECTED SOCIAL CHARACTERISTICS IN THE UNITED STATES – 2006–2010 American Community Survey 5-Year Estimates". United States Census Bureau. Retrieved 2015-07-12.
- ↑ "DP03 SELECTED ECONOMIC CHARACTERISTICS – 2006–2010 American Community Survey 5-Year Estimates". United States Census Bureau. Retrieved 2015-07-12.
- ↑ Leip, David. "Dave Leip's Atlas of U.S. Presidential Elections". uselectionatlas.org.
- ↑ "Kane County taxpayers would pay an extra $223M if Democrats' tax hike becomes law". Kane County Reporter. 2017-05-30. Retrieved 2018-03-22.
- General
- Forstall, Richard L. (editor) (1996). Population of States and Counties of the United States: 1790 to 1990: From the Twenty-One Decennial Censuses. United States Department of Commerce, Bureau of the Census, Population Division. ISBN 0-934213-48-8.
External links
| Wikimedia Commons has media related to Kane County, Illinois. |
- Kane County official government website
Places adjacent to Kane County, Illinois | ||||||||||
|---|---|---|---|---|---|---|---|---|---|---|
| ||||||||||
Municipalities and communities of Kane County, Illinois, United States | ||
|---|---|---|
| Cities | ||
| Villages | ||
| Townships | ||
| CDP | ||
| Other unincorporated communities |
| |
| Footnotes | ‡This populated place also has portions in an adjacent county or counties | |
| Major city |  | |
|---|---|---|
| Cities (over 30,000 in 2010) | ||
| Towns and villages (over 30,000 in 2010) |
| |
| Counties | ||
| Regions | ||
| Sub-regions | ||
