United States presidential election in Mississippi, 2016
|
|
|
|
|
 County Results
|
Trump
40-50%
50-60%
60-70%
70-80%
80-90%
|
Clinton
40-50%
50-60%
60-70%
70-80%
80-90%
|
|
|
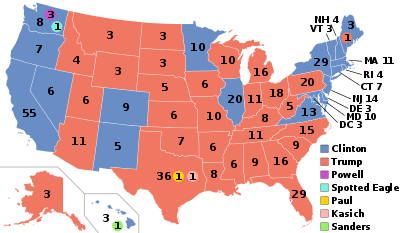
The 2016 United States presidential election in Mississippi was held on November 8, 2016, as part of the 2016 General Election in which all 50 states plus The District of Columbia participated. Mississippi voters chose electors to represent them in the Electoral College via a popular vote pitting the Republican Party's nominee, businessman Donald Trump, and running mate Indiana Governor Mike Pence against Democratic Party nominee, former Secretary of State Hillary Clinton and her running mate, Virginia Senator Tim Kaine.
On March 8, 2016, in the presidential primaries, Mississippi voters expressed their preferences for the Democratic, and Republican, parties' respective nominees for president. Registered members of each party only voted in their party's primary, while voters who were unaffiliated chose any one primary in which to vote.
Mississippi has not voted Democratic since 1976. Since that time, Republicans have dominated the state's political elections, and so Trump was widely expected to win the election. Donald Trump won the election in Mississippi with 57.9% of the vote. Hillary Clinton received 40.1% of the vote.[1] Trump's 17.8% margin of victory proved to be a 6.8% increase over the 11.5% margin of victory by which Republican nominee Mitt Romney won the state over Barack Obama in 2012.
Primary elections
Democratic primary
Mississippi primary, 2016
|
| March 8, 2016 (2016-03-08) |
|
|
|
 Mississippi results by county
Hillary Clinton |
Republican primary

Republican primary results by county.
Trump
Cruz
Twelve candidates appeared on the Republican presidential primary ballot:[2]
| Mississippi Republican primary, March 8, 2016 |
| Candidate |
Votes |
Percentage |
Actual delegate count |
| Bound |
Unbound |
Total |
 Donald Trump Donald Trump |
196,659 |
47.24% |
25 |
0 |
25 |
| Ted Cruz |
150,364 |
36.12% |
15 |
0 |
15 |
| John Kasich |
36,795 |
8.84% |
0 |
0 |
0 |
| Marco Rubio |
21,885 |
5.26% |
0 |
0 |
0 |
| Ben Carson (withdrawn) |
5,626 |
1.35% |
0 |
0 |
0 |
| Jeb Bush (withdrawn) |
1,697 |
0.41% |
0 |
0 |
0 |
| Mike Huckabee (withdrawn) |
1,067 |
0.26% |
0 |
0 |
0 |
| Rand Paul (withdrawn) |
643 |
0.15% |
0 |
0 |
0 |
| Rick Santorum (withdrawn) |
510 |
0.12% |
0 |
0 |
0 |
| Chris Christie (withdrawn) |
493 |
0.12% |
0 |
0 |
0 |
| Carly Fiorina (withdrawn) |
224 |
0.05% |
0 |
0 |
0 |
| Lindsey Graham (withdrawn) |
172 |
0.04% |
0 |
0 |
0 |
| George Pataki (withdrawn) |
135 |
0.03% |
0 |
0 |
0 |
| Unprojected delegates: |
0 |
0 |
0 |
| Total: |
416,270 |
100.00% |
40 |
0 |
40 |
| Source: The Green Papers |
General elections
By congressional district
Trump won 3 of 4 congressional districts.[11]
By county
| County |
Clinton% |
Clinton# |
Trump% |
Trump# |
Others% |
Others# |
Total |
| Adams | 56.06% | 7,757 | 42.45% | 5,874 | 1.48% | 205 | 13,836 |
| Alcorn | 18.16% | 2,684 | 79.95% | 11,819 | 1.89% | 280 | 14,783 |
| Amite | 38.26% | 2,697 | 60.84% | 4,289 | 0.91% | 64 | 7,050 |
| Attala | 39.27% | 3,242 | 59.31% | 4,897 | 1.42% | 117 | 8,256 |
| Benton | 42.84% | 1,719 | 56.09% | 2,251 | 1.07% | 43 | 4,013 |
| Bolivar | 65.44% | 9,046 | 33.20% | 4,590 | 1.36% | 188 | 13,824 |
| Calhoun | 29.86% | 1,910 | 68.64% | 4,390 | 1.50% | 96 | 6,396 |
| Carroll | 30.39% | 1,680 | 68.72% | 3,799 | 0.89% | 49 | 5,528 |
| Chickasaw | 46.25% | 3,649 | 52.31% | 4,127 | 1.44% | 114 | 7,890 |
| Choctaw | 29.96% | 1,218 | 68.59% | 2,788 | 1.45% | 59 | 4,065 |
| Claiborne | 86.80% | 3,708 | 12.64% | 540 | 0.56% | 24 | 4,272 |
| Clarke | 33.18% | 2,585 | 65.94% | 5,137 | 0.89% | 69 | 7,791 |
| Clay | 57.20% | 5,722 | 41.49% | 4,150 | 1.31% | 131 | 10,003 |
| Coahoma | 71.57% | 6,378 | 27.22% | 2,426 | 1.21% | 108 | 8,912 |
| Copiah | 51.93% | 6,741 | 47.01% | 6,103 | 1.06% | 138 | 12,982 |
| Covington | 37.18% | 3,276 | 61.68% | 5,435 | 1.13% | 100 | 8,811 |
| DeSoto | 31.34% | 20,591 | 65.59% | 43,089 | 3.07% | 2,015 | 65,695 |
| Forrest | 41.75% | 11,716 | 55.09% | 15,461 | 3.16% | 887 | 28,064 |
| Franklin | 35.01% | 1,502 | 63.43% | 2,721 | 1.56% | 67 | 4,290 |
| George | 10.38% | 1,027 | 87.92% | 8,696 | 1.70% | 168 | 9,891 |
| Greene | 18.14% | 974 | 80.74% | 4,335 | 1.12% | 60 | 5,369 |
| Grenada | 42.08% | 4,424 | 56.79% | 5,970 | 1.13% | 119 | 10,513 |
| Hancock | 18.96% | 3,344 | 78.31% | 13,811 | 2.73% | 482 | 17,637 |
| Harrison | 33.44% | 21,169 | 63.74% | 40,354 | 2.83% | 1,790 | 63,313 |
| Hinds | 71.39% | 67,594 | 26.69% | 25,275 | 1.91% | 1,812 | 94,681 |
| Holmes | 82.83% | 6,689 | 16.21% | 1,309 | 0.97% | 78 | 8,076 |
| Humphreys | 72.21% | 3,071 | 27.06% | 1,151 | 0.73% | 31 | 4,253 |
| Issaquena | 56.51% | 395 | 42.63% | 298 | 0.86% | 6 | 699 |
| Itawamba | 11.47% | 1,117 | 86.99% | 8,470 | 1.54% | 150 | 9,737 |
| Jackson | 29.57% | 14,657 | 67.85% | 33,629 | 2.58% | 1,281 | 49,567 |
| Jasper | 51.54% | 4,368 | 47.65% | 4,038 | 0.81% | 69 | 8,475 |
| Jefferson | 59.64% | 3,720 | 39.54% | 2,466 | 0.82% | 51 | 6,237 |
| Jefferson Davis | 86.45% | 3,337 | 12.69% | 490 | 0.85% | 33 | 3,860 |
| Jones | 27.48% | 7,791 | 71.01% | 20,133 | 1.51% | 428 | 28,352 |
| Kemper | 60.94% | 2,827 | 38.33% | 1,778 | 0.73% | 34 | 4,639 |
| Lafayette | 40.57% | 7,969 | 55.35% | 10,872 | 4.08% | 802 | 19,643 |
| Lamar | 21.10% | 5,190 | 76.25% | 18,751 | 2.65% | 651 | 24,592 |
| Lauderdale | 38.19% | 11,269 | 60.13% | 17,741 | 1.68% | 496 | 29,506 |
| Lawrence | 34.49% | 2,195 | 64.28% | 4,091 | 1.23% | 78 | 6,364 |
| Leake | 42.42% | 3,584 | 56.60% | 4,782 | 0.98% | 83 | 8,449 |
| Lee | 30.47% | 10,029 | 67.51% | 22,220 | 2.02% | 664 | 32,913 |
| Leflore | 69.90% | 7,787 | 28.83% | 3,212 | 1.27% | 141 | 11,140 |
| Lincoln | 29.34% | 4,458 | 69.44% | 10,550 | 1.22% | 185 | 15,193 |
| Lowndes | 46.21% | 11,819 | 51.89% | 13,271 | 1.90% | 485 | 25,575 |
| Madison | 40.85% | 20,343 | 56.75% | 28,265 | 2.40% | 1,194 | 49,802 |
| Marion | 31.45% | 3,677 | 67.01% | 7,836 | 1.54% | 180 | 11,693 |
| Marshall | 54.07% | 8,023 | 44.39% | 6,587 | 1.54% | 229 | 14,839 |
| Monroe | 34.78% | 5,524 | 64.01% | 10,167 | 1.22% | 193 | 15,884 |
| Montgomery | 42.33% | 2,115 | 56.41% | 2,818 | 1.26% | 63 | 4,996 |
| Neshoba | 25.73% | 2,715 | 72.77% | 7,679 | 1.51% | 159 | 10,553 |
| Newton | 29.20% | 2,756 | 69.38% | 6,548 | 1.42% | 134 | 9,438 |
| Noxubee | 77.99% | 4,347 | 21.53% | 1,200 | 0.48% | 27 | 5,574 |
| Oktibbeha | 48.88% | 8,859 | 47.32% | 8,576 | 3.80% | 689 | 18,124 |
| Panola | 49.33% | 7,431 | 49.45% | 7,449 | 1.22% | 184 | 15,064 |
| Pearl River | 16.47% | 3,604 | 81.26% | 17,782 | 2.27% | 497 | 21,883 |
| Perry | 22.46% | 1,220 | 76.12% | 4,135 | 1.42% | 77 | 5,432 |
| Pike | 49.31% | 8,043 | 49.10% | 8,009 | 1.58% | 258 | 16,310 |
| Pontotoc | 18.38% | 2,386 | 79.61% | 10,336 | 2.02% | 262 | 12,984 |
| Prentiss | 20.94% | 2,067 | 77.47% | 7,648 | 1.59% | 157 | 9,872 |
| Quitman | 68.71% | 2,312 | 29.75% | 1,001 | 1.55% | 52 | 3,365 |
| Rankin | 22.48% | 14,110 | 75.16% | 47,178 | 2.36% | 1,480 | 62,768 |
| Scott | 40.56% | 4,268 | 58.18% | 6,122 | 1.25% | 132 | 10,522 |
| Sharkey | 67.53% | 1,479 | 31.60% | 692 | 0.87% | 19 | 2,190 |
| Simpson | 33.93% | 3,874 | 64.74% | 7,393 | 1.33% | 152 | 11,419 |
| Smith | 21.20% | 1,617 | 77.72% | 5,928 | 1.08% | 82 | 7,627 |
| Stone | 22.33% | 1,573 | 75.32% | 5,306 | 2.36% | 166 | 7,045 |
| Sunflower | 70.07% | 6,725 | 29.11% | 2,794 | 0.82% | 79 | 9,598 |
| Tallahatchie | 56.85% | 3,337 | 41.94% | 2,462 | 1.21% | 71 | 5,870 |
| Tate | 33.77% | 3,926 | 64.46% | 7,495 | 1.77% | 206 | 11,627 |
| Tippah | 19.95% | 1,842 | 78.40% | 7,240 | 1.66% | 153 | 9,235 |
| Tishomingo | 11.93% | 999 | 85.61% | 7,166 | 2.46% | 206 | 8,371 |
| Tunica | 74.77% | 2,667 | 23.91% | 853 | 1.32% | 47 | 3,567 |
| Union | 17.50% | 2,012 | 80.33% | 9,235 | 2.17% | 249 | 11,496 |
| Walthall | 40.32% | 2,790 | 58.62% | 4,056 | 1.06% | 73 | 6,919 |
| Warren | 47.82% | 9,284 | 50.30% | 9,767 | 1.88% | 365 | 19,416 |
| Washington | 67.64% | 11,380 | 31.17% | 5,244 | 1.19% | 201 | 16,825 |
| Wayne | 36.71% | 3,524 | 62.40% | 5,990 | 0.89% | 85 | 9,599 |
| Webster | 20.10% | 1,019 | 78.44% | 3,976 | 1.46% | 74 | 5,069 |
| Wilkinson | 67.73% | 2,857 | 31.25% | 1,318 | 1.02% | 43 | 4,218 |
| Winston | 43.35% | 3,850 | 55.29% | 4,910 | 1.36% | 121 | 8,881 |
| Yalobusha | 42.49% | 2,582 | 55.55% | 3,376 | 1.96% | 119 | 6,077 |
| Yazoo | 53.32% | 5,369 | 45.66% | 4,598 | 1.02% | 103 | 10,070 |
Counties that swung from Democratic to Republican
External links
|
|---|
|
| Republican Party | |
|---|
| Democratic Party | |
|---|
| Libertarian Party | |
|---|
| Green Party | |
|---|
| Constitution Party | |
|---|
| Independent | |
|---|
|
|
|---|
| Election timelines | |
|---|
| National polling | |
|---|
| State polling | |
|---|
| Fundraising | |
|---|
| Debates and forums | |
|---|
| Straw polls | |
|---|
| Major events | |
|---|
Caucuses
and primaries | |
|---|
| Results breakdown | |
|---|
National
conventions | |
|---|
| Reforms | |
|---|
.jpg)

.svg.png)