Union County, Illinois
| Union County, Illinois | |
|---|---|
 Union County Courthouse in Jonesboro | |
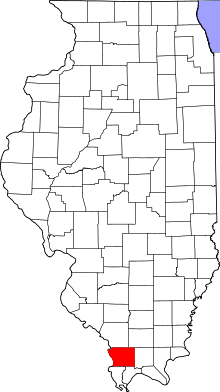 Location in the U.S. state of Illinois | |
 Illinois's location in the U.S. | |
| Founded | January 2, 1818 |
| Seat | Jonesboro |
| Largest city | Anna |
| Area | |
| • Total | 422 sq mi (1,093 km2) |
| • Land | 413 sq mi (1,070 km2) |
| • Water | 8.7 sq mi (23 km2), 2.1% |
| Population | |
| • (2010) | 17,808 |
| • Density | 43/sq mi (17/km2) |
| Congressional district | 12th |
| Time zone | Central: UTC−6/−5 |
| Website |
www |
Union County is a county located in the U.S. state of Illinois. According to the 2010 census, it had a population of 17,808.[1] Its county seat is Jonesboro.[2] It is located in the southern portion of Illinois known locally as "Little Egypt".
History
Union County was formed out of Johnson County on January 2, 1818, the same year Illinois became a state.[3] It was named for a joint revival meeting of the Baptists and Dunkards, called a "union meeting". The county seal depicts the leaders of these two groups shaking hands.[4]
 For its first year of existence, Union County included an area of unorganized territory temporarily attached to it.[5]
 In 1819, the additional territory became Alexander County, reducing Union to its current borders.
Geography
According to the U.S. Census Bureau, the county has a total area of 422 square miles (1,090 km2), of which 413 square miles (1,070 km2) is land and 8.7 square miles (23 km2) (2.1%) is water.[6]
Climate and weather
| Jonesboro, Illinois | ||||||||||||||||||||||||||||||||||||||||||||||||||||||||||||
|---|---|---|---|---|---|---|---|---|---|---|---|---|---|---|---|---|---|---|---|---|---|---|---|---|---|---|---|---|---|---|---|---|---|---|---|---|---|---|---|---|---|---|---|---|---|---|---|---|---|---|---|---|---|---|---|---|---|---|---|---|
| Climate chart (explanation) | ||||||||||||||||||||||||||||||||||||||||||||||||||||||||||||
| ||||||||||||||||||||||||||||||||||||||||||||||||||||||||||||
| ||||||||||||||||||||||||||||||||||||||||||||||||||||||||||||
In recent years, average temperatures in the county seat of Jonesboro have ranged from a low of 22 °F (−6 °C) in January to a high of 90 °F (32 °C) in July, although a record low of −20 °F (−29 °C) was recorded in January 1918 and a record high of 112 °F (44 °C) was recorded in July 1901. Average monthly precipitation ranged from 3.13 inches (80 mm) in September to 5.22 inches (133 mm) in May.[7]
Major highways
Adjacent counties
- Jackson County (north)
- Williamson County (northeast)
- Johnson County (east)
- Pulaski County (southeast)
- Alexander County (south)
- Cape Girardeau County, Missouri (west)
- Perry County, Missouri (northwest)
National protected areas
Demographics
| Historical population | |||
|---|---|---|---|
| Census | Pop. | %± | |
| 1820 | 2,362 | — | |
| 1830 | 3,239 | 37.1% | |
| 1840 | 5,524 | 70.5% | |
| 1850 | 7,615 | 37.9% | |
| 1860 | 11,181 | 46.8% | |
| 1870 | 16,518 | 47.7% | |
| 1880 | 18,102 | 9.6% | |
| 1890 | 21,549 | 19.0% | |
| 1900 | 22,610 | 4.9% | |
| 1910 | 21,856 | −3.3% | |
| 1920 | 20,249 | −7.4% | |
| 1930 | 19,883 | −1.8% | |
| 1940 | 21,528 | 8.3% | |
| 1950 | 20,500 | −4.8% | |
| 1960 | 17,645 | −13.9% | |
| 1970 | 16,071 | −8.9% | |
| 1980 | 17,765 | 10.5% | |
| 1990 | 17,619 | −0.8% | |
| 2000 | 18,293 | 3.8% | |
| 2010 | 17,808 | −2.7% | |
| Est. 2017 | 17,000 | [8] | −4.5% |
| U.S. Decennial Census[9] 1790-1960[10] 1900-1990[11] 1990-2000[12] 2010-2013[1] | |||
2010
Whereas according to the 2010 U.S. Census Bureau:
- 94.8% White
- 0.9% Black
- 0.5% Native American
- 0.3% Asian
- 0.0% Native Hawaiian or Pacific Islander
- 1.5% Two or more races
- 2.0% Other races
- 4.8% Hispanic or Latino (of any race)
2000
As of the 2010 United States Census, there were 17,808 people, 7,167 households, and 4,837 families residing in the county.[13] The population density was 43.1 inhabitants per square mile (16.6/km2). There were 7,924 housing units at an average density of 19.2 per square mile (7.4/km2).[6] The racial makeup of the county was 94.8% white, 0.9% black or African American, 0.5% American Indian, 0.3% Asian, 2.0% from other races, and 1.5% from two or more races. Those of Hispanic or Latino origin made up 4.8% of the population.[13] In terms of ancestry, 23.0% were German, 12.6% were Irish, 9.4% were English, and 8.1% were American.[14]
Of the 7,167 households, 29.7% had children under the age of 18 living with them, 52.6% were married couples living together, 10.6% had a female householder with no husband present, 32.5% were non-families, and 28.4% of all households were made up of individuals. The average household size was 2.41 and the average family size was 2.92. The median age was 42.9 years.[13]
The median income for a household in the county was $39,760 and the median income for a family was $48,465. Males had a median income of $36,831 versus $31,272 for females. The per capita income for the county was $19,512. About 12.7% of families and 21.1% of the population were below the poverty line, including 22.5% of those under age 18 and 16.7% of those age 65 or over.[15]
Communities
Cities
Villages
Unincorporated communities
Politics
| Year | Republican | Democratic | Third Parties |
|---|---|---|---|
| 2016 | 67.2% 5,790 | 27.9% 2,402 | 4.9% 424 |
| 2012 | 59.6% 4,957 | 37.7% 3,137 | 2.7% 224 |
| 2008 | 54.7% 5,003 | 42.8% 3,918 | 2.6% 233 |
| 2004 | 58.5% 5,333 | 41.0% 3,735 | 0.6% 51 |
| 2000 | 50.8% 4,397 | 46.0% 3,982 | 3.2% 281 |
| 1996 | 38.0% 3,147 | 51.3% 4,252 | 10.7% 883 |
| 1992 | 33.1% 3,003 | 51.5% 4,681 | 15.4% 1,399 |
| 1988 | 50.1% 4,244 | 49.5% 4,197 | 0.5% 38 |
| 1984 | 55.1% 4,721 | 44.6% 3,815 | 0.3% 28 |
| 1980 | 50.8% 4,289 | 44.8% 3,781 | 4.4% 371 |
| 1976 | 41.2% 3,531 | 58.3% 5,003 | 0.5% 44 |
| 1972 | 59.4% 5,034 | 40.4% 3,428 | 0.2% 18 |
| 1968 | 46.5% 3,889 | 43.0% 3,603 | 10.5% 880 |
| 1964 | 37.6% 3,142 | 62.4% 5,208 | 0.0% 0 |
| 1960 | 50.6% 4,432 | 49.3% 4,321 | 0.1% 10 |
| 1956 | 49.1% 4,204 | 50.9% 4,359 | 0.1% 6 |
| 1952 | 52.0% 4,658 | 47.9% 4,296 | 0.1% 9 |
| 1948 | 46.0% 3,864 | 53.3% 4,479 | 0.7% 55 |
| 1944 | 48.3% 4,114 | 51.2% 4,367 | 0.5% 46 |
| 1940 | 45.5% 4,915 | 53.7% 5,804 | 0.8% 81 |
| 1936 | 39.8% 4,165 | 59.8% 6,260 | 0.3% 36 |
| 1932 | 31.5% 2,859 | 67.8% 6,157 | 0.8% 69 |
| 1928 | 44.5% 3,352 | 55.1% 4,149 | 0.4% 29 |
| 1924 | 39.2% 2,579 | 57.4% 3,783 | 3.4% 224 |
| 1920 | 45.6% 3,119 | 53.5% 3,660 | 1.0% 68 |
| 1916 | 37.1% 3,135 | 61.2% 5,171 | 1.7% 141 |
| 1912 | 10.4% 458 | 60.4% 2,648 | 29.2% 1,281 |
| 1908 | 37.4% 1,695 | 59.4% 2,690 | 3.2% 144 |
| 1904 | 39.5% 1,537 | 50.6% 1,967 | 9.9% 383 |
| 1900 | 36.5% 1,695 | 62.4% 2,900 | 1.1% 50 |
| 1896 | 37.7% 1,842 | 61.3% 2,998 | 1.1% 52 |
| 1892 | 34.0% 1,427 | 63.4% 2,663 | 2.7% 112 |
See also
References
- 1 2 "State & County QuickFacts". United States Census Bureau. Archived from the original on July 22, 2011. Retrieved July 9, 2014.
- ↑ "Find a County". National Association of Counties. Archived from the original on 2015-05-10. Retrieved 2011-06-07.
- ↑ Perrin 1883, p. 285.
- ↑ Callary, Edward (2009). Place Names of Illinois. Urbana and Chicago, Illinois: University of Illinois Press. p. 354.
- ↑ White, Jesse. Origin and Evolution of Illinois Counties. State of Illinois, March 2010. "Archived copy" (PDF). Archived (PDF) from the original on 2012-09-30. Retrieved 2012-09-26.
- 1 2 "Population, Housing Units, Area, and Density: 2010 - County". United States Census Bureau. Retrieved 2015-07-12.
- 1 2 "Monthly Averages for Jonesboro, Illinois". The Weather Channel. Archived from the original on 2012-10-23. Retrieved 2011-01-27.
- ↑ "Population and Housing Unit Estimates". Archived from the original on May 29, 2017. Retrieved June 9, 2017.
- ↑ "U.S. Decennial Census". United States Census Bureau. Archived from the original on May 12, 2015. Retrieved July 9, 2014.
- ↑ "Historical Census Browser". University of Virginia Library. Archived from the original on August 16, 2012. Retrieved July 9, 2014.
- ↑ "Population of Counties by Decennial Census: 1900 to 1990". United States Census Bureau. Archived from the original on April 24, 2014. Retrieved July 9, 2014.
- ↑ "Census 2000 PHC-T-4. Ranking Tables for Counties: 1990 and 2000" (PDF). United States Census Bureau. Archived (PDF) from the original on December 18, 2014. Retrieved July 9, 2014.
- 1 2 3 "DP-1 Profile of General Population and Housing Characteristics: 2010 Demographic Profile Data". United States Census Bureau. Retrieved 2015-07-12.
- ↑ "DP02 SELECTED SOCIAL CHARACTERISTICS IN THE UNITED STATES – 2006-2010 American Community Survey 5-Year Estimates". United States Census Bureau. Retrieved 2015-07-12.
- ↑ "DP03 SELECTED ECONOMIC CHARACTERISTICS – 2006-2010 American Community Survey 5-Year Estimates". United States Census Bureau. Retrieved 2015-07-12.
- ↑ Leip, David. "Dave Leip's Atlas of U.S. Presidential Elections". uselectionatlas.org. Archived from the original on 23 March 2018. Retrieved 1 May 2018.
Bibliography
- Perrin, William Henry, ed. (1883). History of Alexander, Union and Pulaski Counties, Illinois. Chicago, Ill: O.L. Baskin & Co. OCLC 8695008.
- U.S. Geological Survey Geographic Names Information System: Union County, Illinois
External links
- Union County Official Website
- Union County State's Attorney
- Union County Treasurer
- Union County Chamber of Commerce
Places adjacent to Union County, Illinois | |
|---|---|
Municipalities and communities of Union County, Illinois, United States | ||
|---|---|---|
| Cities | ||
| Villages | ||
| Precincts |
| |
| Unincorporated communities | ||

| Counties |  | |
|---|---|---|
| Mid-sized cities (25,000+) | ||
| Small Cities (10,000-25,000) | ||
| Small Cities (5,000-10,000) | ||
| Interstates | ||
| Airports/Military bases |
| |
| Universities | ||
| Colleges | ||
| Sports teams based in the Southern Illinois | ||
Coordinates: 37°28′16″N 89°15′18″W / 37.47111°N 89.25500°W