Democratic Party presidential primaries, 1976
|
| |||||||||||||||||||||||||||||||||||||||||||||||||||||
| |||||||||||||||||||||||||||||||||||||||||||||||||||||
| |||||||||||||||||||||||||||||||||||||||||||||||||||||
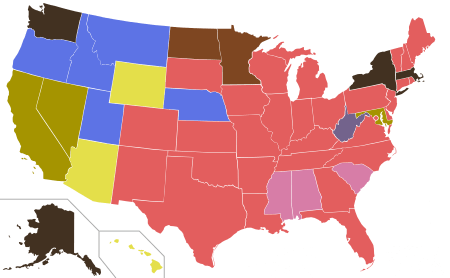 First place finishes by convention roll call | |||||||||||||||||||||||||||||||||||||||||||||||||||||
| |||||||||||||||||||||||||||||||||||||||||||||||||||||
_(cropped).jpg)
.jpg)
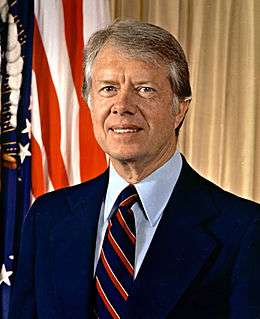
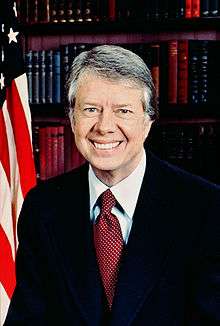
The 1976 Democratic presidential primaries were the selection process by which voters of the Democratic Party chose its nominee for President of the United States in the 1976 U.S. presidential election. Former Georgia Governor Jimmy Carter was selected as the nominee through a series of primary elections and caucuses culminating in the 1976 Democratic National Convention held from July 12 to July 15, 1976, in New York City. This is the earliest Democratic Convention where one of the nominees is still alive as of 2018.
Primary race
The Watergate scandal, resignation of Richard Nixon, American withdrawal from Vietnam, and recession of 1974-75 dominated domestic issues in the runup to the presidential election of 76. President Gerald Ford had squandered his early popularity with an unconditional pardon of Nixon and his perceived mishandling of the recession, and by late 1975 had slumped badly in national polls.
Due to the absence of any clear front-runner for the nomination and a political climate that seemed tilted heavily in their party's favor, a record number of Democrats competed for their party's presidential nomination in 1976. However, most of these candidates would drop out early in the race.
The 1976 campaign featured a record number of state primaries and caucuses, and it was the first presidential campaign in which the primary system was dominant. However, most of the Democratic candidates failed to realize the significance of the increased number of primaries, or the importance of creating momentum by winning the early contests. The one candidate who did see the opportunities in the new nominating system was Jimmy Carter, a former state senator and Governor of Georgia. Carter, who was virtually unknown at the national level, would never have gotten the Democratic nomination under the old, boss-dominated nominating system, but given the public disgust with political corruption following Richard Nixon's resignation, Carter realized that his obscurity and "fresh face" could be an asset in the primaries. Carter's plan was to run in all of the primaries and caucuses, beginning with the Iowa caucus, and build up momentum by winning "somewhere" each time primary elections were held. Carter startled many political experts by finishing second in the Iowa caucuses (where he came in second to "uncommitted"). Arizona Congressman Morris Udall, who had been leading in the polls at one point, came in fifth behind Fred R. Harris, leading Harris to coin the term "winnowed in", referring to his surprisingly strong showing.[1][2][3][4] Carter then won the New Hampshire primary on February 24, thus proving that a Southerner could win in the North. He then proceeded to slowly but steadily accumulate delegates in primaries around the nation. He also knocked his key rivals out of the race one by one. He defeated George Wallace in the North Carolina primary March 23, thus eliminating his main rival in the South. He defeated Senator Henry "Scoop" Jackson in Pennsylvania April 27, and Jackson quit the race. In the Wisconsin primary on April 6, Carter scored an impressive come-from-behind victory over Mo Udall, and eliminated Udall as a serious contender.
As Carter closed in on the nomination, an "ABC" (Anybody But Carter) movement started among Northern and Western liberal Democrats who worried that Carter's Southern upbringing would make him too conservative for the Democratic Party. The leaders of the ABC movement - Idaho Senator Frank Church and California Governor Jerry Brown - announced their candidacies for the Democratic nomination and defeated Carter in several late primaries. However, their campaigns started too late to prevent Carter from gathering the remaining delegates he needed to capture the nomination.
Nominee
Withdrew after names had been put in nomination
.jpg) Representative Morris Udall of Arizona
Representative Morris Udall of Arizona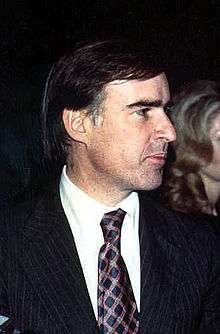

Withdrew during primaries
 Senator Birch Bayh of Indiana
 Senator Lloyd Bentsen of Texas
 Senator Robert Byrd of West Virginia
 Senator Frank Church of Idaho
 Delegate Walter Fauntroy of Washington, D.C.
 Former Senator Fred Harris of Oklahoma
 Senator Henry M. Jackson of Washington
 Governor Milton Shapp of Pennsylvania
.png)

Withdrew before primaries
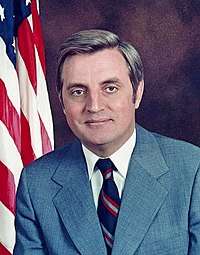 Senator Walter Mondale of Minnesota
Primaries
Scoop Jackson raised his national profile by speaking out on Soviet Union–United States relations and Middle East policy regularly, and was considered a front-runner for the nomination when he announced the start of his campaign in February 1975. Jackson received substantial financial support from Jewish-Americans who admired his pro-Israel views, but Jackson's support of the Vietnam War resulted in hostility from the left wing of the Democratic Party.
Jackson chose to run on social issues, emphasizing law and order and his opposition to busing. Jackson was also hoping for support from labor, but the possibility that Hubert Humphrey might enter the race caused unions to offer only lukewarm support.[5][6][7][8]
Jackson made the fateful decision not to compete in the early Iowa caucus and New Hampshire primary, which Carter won after liberals split their votes among four other candidates. Though Jackson won the Massachusetts and New York primaries, he dropped out on May 1 after losing the critical Pennsylvania primary to Carter by 12 points and running out of money.[5][6][7][8]
Statewide contest by winner
Results by state:[9]
| Jimmy Carter | Jerry Brown | George Wallace | Morris Udall | Scoop Jackson | Frank Church | Lloyd Bentsen | Robert Byrd | Sargent Shriver | Fred Harris | Ellen McCormack | Milton Shapp | Birch Bayh | Uncommitted | ||
|---|---|---|---|---|---|---|---|---|---|---|---|---|---|---|---|
| January 19 | Iowa Caucus |
27.57% (10,764) |
- | - | 5.99% (2,340) |
1.10% (429) |
- | - | - | 3.30% (1,287) |
9.89% (3,861) |
- | - | 13.19% (5,148) |
37.16% (14,508) |
| January 24 | Mississippi[10] Precinct Caucuses (0 of 24 Delegates) (Note) |
13.76% (203.96) |
- | 44.62% (661.36) |
- | - | - | 1.56% (23.16) |
- | 12.00% (177.87) |
1.05% (15.61) |
- | - | - | 27.00% (400.17) |
| February 7 | Oklahoma[11] County Caucuses (0 of 37 Delegates) (Note) |
18.50% (1,304) |
- | 10.40% | - | - | - | 12.80% | - | - | 17.00% (1,202) |
- | - | - | 40.00% (2,808) |
| February 14 | Mississippi[12] County Conventions (0 of 24 Delegates) (Note) |
11.30% | - | 49.00% | - | - | - | - | - | 10.50% | - | - | - | - | 28.00% |
| February 21 | Mississippi[13] District Caucuses (19 of 24 Delegates) (Note) |
N/A (4 Delegates) |
- | N/A (9 Delegates) |
- | - | - | - | - | N/A (3 Delegates) |
- | - | - | - | N/A (3 Delegates) |
| February 24 | New Hampshire[14] Primary (17 of 17 Delegates) |
28.37% (23,373) (15 Delegates) |
- | 1.29% (1,061) (WI) |
22.71% (18,710) (2 Delegates) |
2.25% (1,857) (WI) |
- | - | - | 8.19% (6,743) |
10.76% (8,863) |
1.22% (1,007) |
- | 15.19% (12,510) |
- |
| March 2 | Massachusetts[15] Primary (104 of 104 Delegates) |
13.86% (101,948) (16 Delegates) |
- | 16.73% (123,112) (21 Delegates) |
17.73% (130,440) (20 Delegates) |
22.34% (164,393) (30 Delegates) |
- | 0.05% (364) |
- | 7.24% (53,252) (8 Delegates) |
7.57% (55,701) (6 Delegates) |
3.50% (25,772) (1 Delegate) |
2.95% (21,693) (1 Delegate) |
4.75% (34,963) (1 Delegate) |
1.33% |
| March 2 | Vermont[15] Primary (0 of 12 Delegates) (Note) |
45.84% (16,352) |
- | - | - | - | - | - | - | 30.52% (10,889) |
14.22% (5,074) |
9.42% (3,359) |
- | - | - |
| March 2 | Washington[16] Caucus (Note) |
- | - | - | - | N/A | - | - | - | - | - | - | - | - | - |
| March 9 | Florida[17] Primary (81 of 81 Delegates) |
34.34% (439,870) (34 Delegate) |
- | 30.61% (392,105) (26 Delegate) |
2.05% (26,257) |
23.90% (306,120) (21 Delegate) |
0.43% (5,456) |
- | 0.46% (5,910) |
0.54% (6,871) |
0.44% (5,666) |
0.58% (7,481) |
2.42% (31,024) |
0.67% (8,552) |
2.92% (37,348) |
| March 16 | Illinois[18][19] Primary (169 of 169 Delegates) (Note) |
48.09% (630,915) (53 Delegate) |
- | 28.18% (361,798) (3 Delegate) |
- | - | - | - | - | 16.67% (214,024) |
7.70% (98,862) |
- | - | - | - (113 Delegate) (Note) |
| March 20 | Oklahoma[20] District Caucuses (28 of 37 Delegates) (Note) |
N/A (8 Delegates) |
- | - | - | - | - | - | - | - | N/A (5 Delegates) |
- | - | - | N/A (15 Delegates) |
| March 23 | North Carolina[21] Primary (61 of 61 Delegates) |
53.64% (324,437) (36 Delegate) |
- | 34.75% (210,166) (25 Delegate) |
2.32% (14,032) |
4.26% (25,749) |
- | 0.28% (1,675) |
- | - | 0.98% (5,923) |
- | - | - | 3.78% (22,850) |
| March 31 | South Carolina[22] State Convention (31 of 31 Delegates) (Note) |
N/A (9 Delegates) |
- | N/A (8 Delegates) |
- | - | N/A (1 Delegate) |
- | - | - | - | - | - | - | N/A (13 Delegates) |
| April 3 | Kansas[23] Caucuses (0 of 26 Delegates) (Note) |
38.16% (232) |
- | 0.49% (3) |
4.77% (29) |
7.07% (43) |
0.33% (2) |
- | - | - | 2.14% (13) |
- | - | - | 47.03% (286) |
| April 3 | Oklahoma[24] State Convention (9 of 37 Delegates) (Note) |
N/A (4 Delegates) |
- | - | - | - | - | - | - | - | N/A (2 Delegates) |
- | - | - | N/A (3 Delegates) |
| April 3 | Virginia[25] County Caucuses (0 of 54 Delegates) (Note) |
30.30% (655) |
- | 3.19% (69) |
4.07% (88) |
- | - | - | - | - | - | - | - | - | 62.03% (1,341) |
| April 6 | New York[26][27][28] Primary (274 of 274 Delegates) (Note) |
N/A N/A (35 Delegates) |
- | - | N/A N/A (72 Delegates) |
N/A N/A (102 Delegates) |
- | - | - | - | - | - | - | - | N/A N/A (65 Delegates) |
| April 6 | Wisconsin[29] Primary (68 of 68 Delegates) |
36.63% (271,220) (25 Delegates) |
- | 12.49% (92,460) (10 Delegates) |
35.62% (263,771) (26 Delegates) |
6.43% (47,605) (6 Delegates) |
- | 0.23% (1,730) |
- | 0.69% (5,097) |
1.11% (8,185) |
3.64% (26,982) (1 Delegate) |
0.08% (596) |
0.17% (1,255) |
0.97% (7,154) |
| April 10 | Iowa[30] District Caucuses (40 of 47 Delegates) (Note) |
N/A (17 Delegates) |
- | - | N/A (10 Delegates) |
- | - | - | - | - | N/A (2 Delegates) |
- | - | - | N/A (11 Delegates) |
| April 21 | Missouri[31] County Caucuses (0 of 71 Delegates) (Note) |
13.23% (111) |
- | - | 5.13% (43) |
2.15% (18) |
- | - | - | - | - | - | - | - | 65.20% (547) |
| April 26 | Arizona[32] Caucuses (25 of 25 Delegates) |
13.23% (2,520) (4 Delegates) |
- | 6.97% (1,691) (1 Delegate) |
71.39% (17,318) (20 Delegates) |
5.50% (1,335) |
1.60% (388) |
- | - | - | - | 1.20% (291) |
- | - | 2.95% (716) |
| April 27 | Pennsylvania[33] Primary (178 of 178 Delegates) (Note) |
36.95% (511,905) (64 Delegates) |
- | 11.25% (155,902) (3 Delegates) |
18.71% (259,166) (22 Delegates) |
24.57% (340,340) (19 Delegates) |
- | - | - | - | 0.94% (13,067) |
2.80% (38,800) |
2.38% (32,947) (17 Delegates) |
1.11% (15,320) (4 Delegates) |
- (53 Delegates) |
| May 1 | Texas[34] Primary (98 of 98 Delegates) |
47.65% (736,161) (92 Delegates) |
- | 17.53% (270,798) |
- | - | - | 22.20% (343,032) (6 Delegates) |
- | 1.85% (28,520) |
2.03% (31,379) |
0.37% (5,700) |
- | - | 8.38% (129,478) |
| May 4 | Alabama[35] Primary (27 of 35 Delegates) (Note) |
N/A N/A |
- | N/A N/A (12 Delegates) |
- | - | - | - | - | - | - | - | - | - | N/A N/A |
| May 4 | Georgia[36] Primary (50 of 50 Delegates) |
83.44% (419,272) (50 Delegates) |
- | 11.46% (57,594) |
1.94% (9,755) |
0.67% (3,358) |
0.49% (2,477) |
0.06% (277) |
0.72% (3,628) |
0.27% (1,378) |
0.14% (699) |
0.13% (635) |
0.04% (181) |
0.16% (824) |
- |
| May 4 | Indiana[36] Primary (75 of 75 Delegates) |
67.95% (66 Delegates) |
- | 15.16% (9 Delegates) |
- | 11.73% | - | - | - | - | - | 5.16% | - | - | - |
| May 4 | Washington, D.C.[37][38] Primary (13 of 13 Delegates) |
31.60% (10,521) (4 Delegates) |
- | - | 21.02% (6,999) (4 Delegates) |
- | - | - | - | - | 1.39% (461) |
- | - | - | 45.99% (15,310) (5 Delegates) (Note) |
| May 11 | Connecticut[39] Primary (0 of 51 Delegates) |
33.16% (35,415) |
- | - | 30.86% (32,959) |
17.75% (18,962) |
- | - | - | - | 0.17% (178) |
5.16% (5,515) |
- | - | 12.90% (13,774) |
| May 11 | Missouri[40] County Caucuses (0 of 71 Delegates) (Note) |
30.13% (47) |
- | - | - | - | - | - | - | - | - | - | - | - | 64.74% (101) |
| May 11 | Nebraska[41] Primary (23 of 23 Delegates) |
37.62% (65,833) (8 Delegates) |
- | 3.18% (5,567) |
2.68% (4,688) |
1.51% (2,642) |
38.45% (67,297) (15 Delegates) |
- | - | 0.22% (384) |
0.46% (811) |
3.45% (6,999) |
- | 0.23% (407) |
- |
| May 11 | West Virginia[41] Primary (33 of 33 Delegates) (Note) |
- | - | 10.99% (40,938) |
- | - | - | - | 89.01% (331,639) |
- | - | - | - | - | - (33 Delegates) |
| May 18 | Maryland[40] Primary (49 of 53 Delegates) (Note) |
37.08% (217,166) (32 Delegates) |
48.45% (284,271) |
4.09% (23,690) |
5.54% (31,372) (7 Delegates) |
2.36% (13,5656) (10 Delegates) |
- | - | - | - | 1.16% (6,880) |
1.34% (9,617) |
- | - | - (4 Delegates) |
| May 18 | Michigan[42] Primary (133 of 133 Delegates) |
43.40% (306,301) (69 Delegates) |
- | 6.94% (49,260) (2 Delegates) |
43.06% (304,297) (58 Delegates) |
1.46% (10,613) |
- | - | - | 0.81% (6,163) |
0.58% (4,323) |
1.08% (7,662) |
- | - | 2.24% (15,529) (4 Delegates) |
| May 22 | Vermont[43] State Convention (12 of 12 Delegates) (Note) |
N/A N/A (3 Delegates) |
N/A N/A (2 Delegates) |
- | N/A N/A (3 Delegates) |
- | - | - | - | - | - | - | - | - | N/A N/A (4 Delegates) |
| May 25 | Arkansas[44] Primary (26 of 26 Delegates) |
62.23% (314,277) (17 Delegates) |
- | 16.54% (83,005) (5 Delegates) |
7.53% (37,783) (1 Delegates) |
1.90% (9,554) |
- | - | - | - | - | - | - | - | 11.39% (57,145) (3 Delegates) |
| May 25 | Idaho[44] Primary (16 of 16 Delegates) |
11.85% (8,818) (2 Delegates) |
1.95% (1,453)(WI) |
1.50% (1,115) |
1.32% (981) |
0.65% (485) |
78.72% (58,570) (14 Delegates) |
- | - | - | 0.43% (319) |
- | - | - | 1.30% (964) |
| May 25 | Kentucky[44] Primary (46 of 46 Delegates) |
59.38% (181,690) (37 Delegates) |
- | 16.84% (51,540) (7 Delegates) |
10.87% (33,262) (2 Delegates) |
2.68% (8,186) |
- | - | - | - | - | 5.58% (17,061) |
- | - | 3.91% (11,962) |
| May 25 | Missouri[45] District Conventions (54 of 71 Delegates) (Note) |
N/A N/A (28 Delegates) |
- | - | N/A N/A (3 Delegates) |
N/A N/A (1 Delegate) |
- | - | - | - | - | N/A N/A (1 Delegate) |
- | - | N/A N/A (21 Delegates) |
| May 25 | Nevada[44] Primary (11 of 11 Delegates) |
23.35% (17,567) (3 Delegates) |
52.73% (39,671) (6 Delegates) |
3.31% (2,490) |
2.97% (2,237) |
2.52% (1,896) |
9.01% (6,778) (1 Delegate) |
- | - | - | - | - | - | - | 6.12% (4,603) (1 Delegate) |
| May 25 | Oregon[44] Primary (34 of 34 Delegates) |
26.65% (115,310) (12 Delegates) |
24.69% (106,812)(WI) (7 Delegates) |
1.34% (5,797) |
2.72% (11,747) |
1.23% (5,298) |
33.61% (145,394) (15 Delegates) |
- | - | - | 0.31% (1,344) |
0.87% (3,753) |
- | 0.17% (743) |
- |
| May 25 | Tennessee[44] Primary (46 of 46 Delegates) |
77.60% (259,243) (36 Delegates) |
0.47% (1,556)(WI) |
10.92% (36,495) (1 Delegate) |
3.72% (12,420) |
1.70% (5,672) |
2.40% (8,026) |
- | - | - | 0.49% (1,628) |
0.53% (1,782) |
0.15% (507) |
- | 1.84% (6,148) (9 Delegates) |
| May 29 | Iowa[46] State Convention (7 of 47 Delegates) (Note) |
N/A N/A (3 Delegates) |
- | - | N/A N/A (2 Delegates) |
- | - | - | - | - | - | - | - | - | N/A N/A (2 Delegates) |
| May 30 | Hawaii[46] State Convention (17 of 17 Delegates) (Note) |
- | - | - | N/A N/A (1 Delegate) |
N/A N/A (1 Delegate) |
- | - | - | - | - | - | - | - | N/A N/A (15 Delegates) |
| June 1 | Montana[47] Primary (17 of 17 Delegates) |
24.64% (26,329) (4 Delegates) |
- | 3.44% (3,680) |
6.28% (6,708) |
2.67% (2,856) |
59.39% (63,448) (11 Delegates) |
- | - | - | - | - | - | - | 3.58% (3,820) (2 Delegates) |
| June 1 | Rhode Island[47] Primary (22 of 22 Delegates) |
30.22% (18,237) (7 Delegates) |
- | 0.84% (507) |
4.21% (2,543) |
1.25% (756) |
27.21% (16,423) (6 Delegates) |
- | - | - | - | 4.09% (2,468) |
0.22% (132) |
0.41% (247) |
31.54% (19,035) (9 Delegates) (Note) |
| June 1 | South Dakota[47] Primary (17 of 17 Delegates) |
41.22% (24,186) (9 Delegates) |
- | 2.41% (1,412) |
33.25% (19,510) (7 Delegates) |
0.95% (558) |
- | - | - | - | 0.98% (573) |
7.77% (4,561) |
- | - | 13.42% (7,871) (1 Delegate) |
| June 6 | Minnesota[48] State Convention (16 of 65 Delegates) (Note) |
- | - | - | - | - | - | - | - | - | - | - | - | - | N/A N/A (16 Delegates) (Note) |
| June 8 | California[49] Primary (300 of 300 Delegates) |
20.44% (697,092) (67 Delegates) |
59.04% (2,013,210) (204 Delegates) |
3.00% (102,292) |
5.03% (171,501) (2 Delegates) |
1.13% (38,634) |
7.35% (250,581) (7 Delegates) |
- | - | - | 0.50% (16,920) |
0.86% (29,242) |
- | 0.34% (11,419) |
2.31% (78,595) |
| June 8 | New Jersey[49] Primary (Preferential) (0 of 108 Delegates) (Note) |
58.38% (210,655) |
- | 8.64% (31,183) |
- | 8.82% (31,820) |
13.59% (49,034) |
- | - | - | - | 6.03% (21,774) |
- | - | - |
| June 8 | New Jersey[49] Primary (Delegate) (108 of 108 Delegates) (Note) |
27.97% (129,455) (25 Delegates) |
- | 6.25% (28,944) |
12.83% (59,365) |
- | 6.68% (30,722) |
- | - | - | - | 4.26% (19,700) |
- | - | 42.06% (194,673) (83 Delegates) |
| June 8 | Ohio[49] Primary (Delegate) (152 of 152 Delegates) |
52.29% (593,130) (126 Delegates) |
- | 5.64% (63,953) |
21.19% (240,342) (20 Delegates) |
3.12% (35,404) |
13.92% (157,884) |
- | - | - | - | - | - | - | 3.85% (43,661) (6 Delegates) (Note) |
| Legend: | 1st place (popular vote) |
2nd place (popular vote) |
3rd place (popular vote) |
Candidate has withdrawn |
Candidate had not yet Joined |
|---|
Total popular vote
Total popular vote in primaries[50]
- Jimmy Carter - 6,971,770 (40.16%)
- Jerry Brown - 2,449,374 (13.98%)
- George Wallace - 2,236,186 (12.75%)
- Mo Udall - 1,611,754 (9.16%)
- Henry M. Jackson - 1,134,375 (6.32%)
- Frank Church - 830,818 (4.77%)
- Unpledged - 412,915 (2.37%)
- Lloyd Bentsen - 347,078 (1.99%)
- Robert Byrd - 340,309 (1.95%)
- Sargent Shriver - 332,919 (1.91%)
- Fred R. Harris - 265,947 (1.52%)
- Ellen McCormack - 243,727 (1.40%)
- Milton Shapp - 88,254 (0.50%)
- Birch Bayh - 86,438 (0.49%)
- Hubert Humphrey - 61,992 (0.35%)
- Others - 32,380 (0.18%)
- Ted Kennedy - 19,805 (0.12%)
- Walter Fauntroy - 10,149 (0.05%)
- Walter Washington - 5,161 (0.03%)
- Terry Sanford - 404 (0.00%)
Democratic National Convention
The 1976 Democratic National Convention was held in New York City. By the time the convention opened Carter already had more than enough delegates to win the nomination, and so the major emphasis at the convention was to create an appearance of party unity, which had been lacking in the 1968 and 1972 Democratic Conventions. Carter easily won the nomination on the first ballot; he then chose Senator Walter Mondale of Minnesota, a liberal and a protege of Hubert Humphrey, as his running mate.
The tally at the convention was:[51]
- Jimmy Carter - 2,239 (74.48%)
- Mo Udall - 330 (10.98%)
- Jerry Brown - 301 (10.01%)
- George Wallace - 57 (1.90%)
- Ellen McCormack - 22 (0.73%)
- Frank Church - 19 (0.63%)
- Hubert Humphrey - 10 (0.33%)
- Henry M. Jackson - 10 (0.33%)
- Fred R. Harris - 9 (0.30%)
- Milton Shapp - 2 (0.07%)
- Robert Byrd, Cesar Chavez, Leon Jaworski, Barbara Jordan, Ted Kennedy, Jennings Randolph, Fred Stover - each 1 vote (0.03%)
Vice-Presidential nomination
 Senator Walter F. Mondale of Minnesota
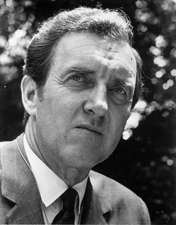 Senator Edmund S. Muskie of Maine
- Senator Frank Church of Idaho
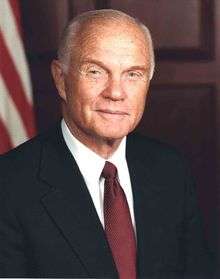 Senator John Glenn of Ohio
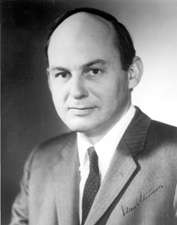 Senator Adlai Stevenson III of Illinois
- Senator Henry M. Jackson of Washington
 Congressman Peter W. Rodino of New Jersey
 Congressman Ron Dellums of California
 Congresswoman Barbara Jordan of Texas
By June, Carter had the nomination sufficiently locked up and could take time to interview potential vice-presidential candidates.
The pundits predicted that Frank Church would be tapped to provide balance as an experienced senator with strong liberal credentials. Church promoted himself, persuading friends to intervene with Carter in his behalf. If a quick choice had been required as in past conventions, Carter later recalled, he would probably have chosen Church. But the longer period for deliberation gave Carter time to worry about his compatibility with the publicity-seeking Church, who had a tendency to be long-winded. Instead, Carter invited Senators Edmund Muskie, John Glenn, Walter Mondale, and Congressmen Peter W. Rodino to visit his home in Plains, Georgia, for personal interviews, while Church, Henry M. Jackson, and Adlai Stevenson III would be interviewed at the convention in New York. Rodino revealed he had no interest in the position, and of all the other potential candidates, Carter found Mondale the most compatible. As a result, Carter selected Mondale as his running mate.
African American leadership within the Democratic Party had sought to potentially place Los Angeles Mayor Tom Bradley, Congressmen Ron Dellums, or Congresswoman Barbara Jordan on the ticket with Carter. However, Jordan took herself out of consideration, and Carter did not have any interest in the other candidates put forward.
The vice presidential tally, in part, was:
- Walter Mondale 2837
- House Speaker Carl Albert 36
- Ronald Dellums 20
- Fritz Efaw 12
- Barbara Jordan 17
- Others 53
See also
References
- ↑ Jules Witcover, No Way to Pick A President: How Money and Hired Guns Have Debased American Elections, 2001, p.166
- ↑ George C. Edwards, John Howard Kessel, Bert A. Rockman, Researching the presidency: vital questions, new approaches, 1993, p.60
- ↑ "WINNOWED IN!... BUT FOR JUST HOW LONG? ... Looking forward to the second month of Primary/Caucus season 2004". www.thegreenpapers.com. Retrieved 2 April 2018.
- ↑ "SERIOUS WINNOWING ... both on and after 'Super Duper' Tuesday". www.thegreenpapers.com. Retrieved 2 April 2018.
- 1 2 Oldham, Kit (August 19, 2003). "Jackson, Henry M. "Scoop"". HistoryLink.org.
- 1 2 David Wilma and Kit Oldham (November 7, 2003). "State voters elect Dixy Lee Ray as first woman governor of Washington, re-elect Senator Henry Jackson and House incumbents, and prefer Ford to Carter on November 2, 1976". HistoryLink.org. Archived from the original on 2005-11-27.
- 1 2 Salam, Reihan (May 27, 2003). "Double Scoop". The New Republic Online.
- 1 2 "Jimmy Carter's Big Breakthrough". Time Magazine. May 10, 1976. Archived from the original on 2014-10-13.
- ↑ "Larry J. Sabato's Crystal Ball » The Modern History of the Democratic Presidential Primary, 1972-2008". www.centerforpolitics.org. Retrieved 2 April 2018.
- ↑ "The New York Times: Thursday July 1, 1976". nytimes.com. Retrieved 2 April 2018.
- ↑ "OKLAHOMA VOTING IS WON BY CARTER; He Leads Harris Slightly in Committed Delegates". nytimes.com. Retrieved 2 April 2018.
- ↑ "Wallace Gets 49% in Mississippi Vote". nytimes.com. Retrieved 2 April 2018.
- ↑ "Wallace Wins 9 Mississippi Delegates". nytimes.com. Retrieved 2 April 2018.
- ↑ "Ford Won 18 of 21 Delegates In Primary in New Hampshire". nytimes.com. Retrieved 2 April 2018.
- 1 2 "Final Tallies in 2 Races". nytimes.com. Retrieved 2 April 2018.
- ↑ "Jackson Is Seen Winning Most Of Washington State Delegates". nytimes.com. Retrieved 2 April 2018.
- ↑ "Final Totals in Florida Primary". nytimes.com. Retrieved 2 April 2018.
- ↑ "Late Vote Totals In Illinois Races". nytimes.com. Retrieved 2 April 2018.
- ↑ "FORD AND CARTER AMASS DELEGATES IN ILLINOIS RACES; Georgian Shows Surprising Strength in the Tabulation, Though Stevenson Leads NEW MOMENTUM SEEN Reagan, Resisting, Pressed Again to Quit as Gesture Toward Party Unity Ford and Carter Amassing Delegates". nytimes.com. Retrieved 2 April 2018.
- ↑ "OKLAHOMA PARTY SPLITS ON CARTER; Uncommitted Do Not Follow Governor's Shift to Georgian". nytimes.com. Retrieved 2 April 2018.
- ↑ "Vote Totals in N. Carolina". nytimes.com. Retrieved 2 April 2018.
- ↑ "South Carolina Democrats Give Carter 9 of Their 31 Delegates". nytimes.com. Retrieved 2 April 2018.
- ↑ "Carter Takes the Lead in Delegate Selections in Kansas Counties". nytimes.com. Retrieved 2 April 2018.
- ↑ "The New York Times: Sunday April 4, 1976". nytimes.com. Retrieved 2 April 2018.
- ↑ "CARTER IS VICTOR IN 2 STATE RACES; Virginia and Kansas Returns Show Him With Big Lead in 1 st Votes for Delegates Carter Is Victor in Races For Delegates in 2 States". nytimes.com. Retrieved 2 April 2018.
- ↑ "State's Delegates to the Conventions". nytimes.com. Retrieved 2 April 2018.
- ↑ "Jackson Won in New York By Narrowly Based Voting; Did Best in Queens and Brooklyn and With Jews and Moderates--Crangle Hails 'Draft Humphrey' Success". nytimes.com. Retrieved 2 April 2018.
- ↑ "Udall Wins All 5 Places On 23rd District Ballot". nytimes.com. Retrieved 2 April 2018.
- ↑ "FORD EASY VICTOR; Wallace and Jackson Far Behind in Battle in the Midwest Carter Tops Udall in a Tight Wisconsin Primary; Ford Defeats Reagan Easily Wallace and Jackson Lag In Presidential Contest". nytimes.com. Retrieved 2 April 2018.
- ↑ "Carter and Udall Lead as Delegates Are Picked In Iowa". nytimes.com. Retrieved 2 April 2018.
- ↑ "Democrats in Missouri Avoiding Choices". nytimes.com. Retrieved 2 April 2018.
- ↑ "ARIZONA PRIMARY IS WON BY UDALL; Home State Gives Him First Victory Reagan Gets 27 of 29 G.O.P. Delegates". nytimes.com. Retrieved 2 April 2018.
- ↑ "Tuesday Voting's Effects". nytimes.com. Retrieved 2 April 2018.
- ↑ "DEMOCRATIC VOTE PROPELS REAGAN TO TEXAS SWEEP; Large Crossover Is Cited as Challenger Takes All 96 Delegates From Ford CARTER BIG WINNER, TOO 92 of His Supporters Gain Convention Seats While Bentsen's Win Only 6 G.O.P. Vote Tops 400,000 The Crossover Vote Democratic Vote Helps Reagan to Sweep Texas". nytimes.com. Retrieved 2 April 2018.
- ↑ "Results in Alabama Show Wallace Strength Fading". nytimes.com. Retrieved 2 April 2018.
- 1 2 "GEORGIANS BACK CARTER, REAGAN; Democrats Support Former Governor Californian Wins 48 Delegates Carter Wins Georgia Primary; Reagan Captures 48 Delegates". nytimes.com. Retrieved 2 April 2018.
- ↑ "INVALID VOTES MAR CAPITAL PRIMARY; Carter Still Holds Lead in Delegates, But Ballot Mixup May Mar His Victory". nytimes.com. Retrieved 2 April 2018.
- ↑ "Carter Loses Two Delegates In Federal Court Ruling". nytimes.com. Retrieved 2 April 2018.
- ↑ "Gov. Grasso Says the Democratic Race Is Not Over Yet". nytimes.com. Retrieved 2 April 2018.
- 1 2 "Uncommitted Slate Prevails In Missouri Delegate Vote". nytimes.com. Retrieved 2 April 2018.
- 1 2 "NEBRASKA VICTORY BY CHURCH BUOYS STOP-CARTER BLOC; Vote Is Seen as Indication That Georgian's Impetus May Be Slowing FORD PROSPECTS HURT President Viewed as Badly, in Need of a Victory in Michigan Next Week Church Victory Gives New Hope to Carter's Foes". nytimes.com. Retrieved 2 April 2018.
- ↑ "CANDIDATES SEEM IN VOTE STANDOFF FOR NEXT 3 WEEKS; Carter Believed Vulnerable After Maryland Loss and Michigan Victory OREGON NEXT BIG TEST Ford, Happy After Success in Two States, to Bid for Support of Moderates Candidates Appear in a Vote Standoff". nytimes.com. Retrieved 2 April 2018.
- ↑ "Vermont Democratic Delegation Is Split". nytimes.com. Retrieved 2 April 2018.
- 1 2 3 4 5 6 "Results of New Voting". nytimes.com. Retrieved 2 April 2018.
- ↑ "MISSOURI GAIN LESS THAN CARTER GOAL; But Georgian's Prospects of Getting More Delegates Are Encouraged". nytimes.com. Retrieved 2 April 2018.
- 1 2 "HAWAII DEMOCRATS PICK 17 DELEGATES". nytimes.com. Retrieved 2 April 2018.
- 1 2 3 "Latest Results of Voting". nytimes.com. Retrieved 2 April 2018.
- ↑ "7 States Complete Selection of Delegates". nytimes.com. Retrieved 2 April 2018.
- 1 2 3 4 "Effects of Tuesday Voting". nytimes.com. Retrieved 2 April 2018.
- ↑ "Our Campaigns - US President - D Primaries Race - Feb 01, 1976". www.ourcampaigns.com. Retrieved 2 April 2018.
- ↑ "Our Campaigns - US President - D Convention Race - Jul 12, 1976". www.ourcampaigns.com. Retrieved 2 April 2018.
Electoral histories of Presidents of the United States | ||
|---|---|---|
 | ||