Scott County, Illinois
| Scott County, Illinois | |
|---|---|
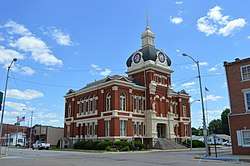 Scott County Courthouse, Winchester | |
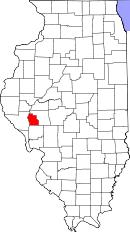 Location in the U.S. state of Illinois | |
 Illinois's location in the U.S. | |
| Founded | 1839 |
| Seat | Winchester |
| Largest city | Winchester |
| Area | |
| • Total | 253 sq mi (655 km2) |
| • Land | 251 sq mi (650 km2) |
| • Water | 1.9 sq mi (5 km2), 0.7% |
| Population | |
| • (2010) | 5,355 |
| • Density | 21/sq mi (8/km2) |
| Congressional district | 18th |
| Time zone | Central: UTC−6/−5 |
Scott County is a county located in the U.S. state of Illinois. According to the 2010 census, it had a population of 5,355,[1] making it the fourth-least populous county in Illinois. Its county seat is Winchester.[2]
Scott County is part of the Jacksonville, IL Micropolitan Statistical Area, which is also included in the Springfield-Jacksonville-Lincoln, IL Combined Statistical Area.
History
Scott County was formed in 1839 out of Morgan County. It was named for a local pioneer family named Scott.
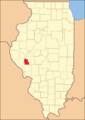 Scott County at the time of its creation in 1839
Geography
According to the U.S. Census Bureau, the county has a total area of 253 square miles (660 km2), of which 251 square miles (650 km2) is land and 1.9 square miles (4.9 km2) (0.7%) is water.[3] The county's western boundary is formed by the Illinois River.
Climate and weather
| Winchester, Illinois | ||||||||||||||||||||||||||||||||||||||||||||||||||||||||||||
|---|---|---|---|---|---|---|---|---|---|---|---|---|---|---|---|---|---|---|---|---|---|---|---|---|---|---|---|---|---|---|---|---|---|---|---|---|---|---|---|---|---|---|---|---|---|---|---|---|---|---|---|---|---|---|---|---|---|---|---|---|
| Climate chart (explanation) | ||||||||||||||||||||||||||||||||||||||||||||||||||||||||||||
| ||||||||||||||||||||||||||||||||||||||||||||||||||||||||||||
| ||||||||||||||||||||||||||||||||||||||||||||||||||||||||||||
In recent years, average temperatures in the county seat of Winchester have ranged from a low of 16 °F (−9 °C) in January to a high of 87 °F (31 °C) in July, although a record low of −26 °F (−32 °C) was recorded in January 1912 and a record high of 113 °F (45 °C) was recorded in July 1934. Average monthly precipitation ranged from 1.60 inches (41 mm) in January to 4.34 inches (110 mm) in May.[4]
Major highways
Adjacent counties
- Morgan County (east)
- Greene County (south)
- Pike County (west)
Demographics
| Historical population | |||
|---|---|---|---|
| Census | Pop. | %± | |
| 1840 | 6,215 | — | |
| 1850 | 7,914 | 27.3% | |
| 1860 | 9,069 | 14.6% | |
| 1870 | 10,530 | 16.1% | |
| 1880 | 10,741 | 2.0% | |
| 1890 | 10,304 | −4.1% | |
| 1900 | 10,455 | 1.5% | |
| 1910 | 10,067 | −3.7% | |
| 1920 | 9,489 | −5.7% | |
| 1930 | 8,539 | −10.0% | |
| 1940 | 8,176 | −4.3% | |
| 1950 | 7,245 | −11.4% | |
| 1960 | 6,377 | −12.0% | |
| 1970 | 6,096 | −4.4% | |
| 1980 | 6,142 | 0.8% | |
| 1990 | 5,644 | −8.1% | |
| 2000 | 5,537 | −1.9% | |
| 2010 | 5,355 | −3.3% | |
| Est. 2016 | 5,053 | [5] | −5.6% |
| U.S. Decennial Census[6] 1790-1960[7] 1900-1990[8] 1990-2000[9] 2010-2013[1] | |||
As of the 2010 United States Census, there were 5,355 people, 2,214 households, and 1,516 families residing in the county.[10] The population density was 21.3 inhabitants per square mile (8.2/km2). There were 2,459 housing units at an average density of 9.8 per square mile (3.8/km2).[3] The racial makeup of the county was 98.6% white, 0.2% Asian, 0.2% American Indian, 0.2% black or African American, 0.1% from other races, and 0.7% from two or more races. Those of Hispanic or Latino origin made up 0.8% of the population.[10] In terms of ancestry, 26.3% were German, 24.3% were American, 18.0% were English, and 16.2% were Irish.[11]
Of the 2,214 households, 32.0% had children under the age of 18 living with them, 54.7% were married couples living together, 9.1% had a female householder with no husband present, 31.5% were non-families, and 27.3% of all households were made up of individuals. The average household size was 2.40 and the average family size was 2.89. The median age was 42.7 years.[10]
The median income for a household in the county was $49,462 and the median income for a family was $64,412. Males had a median income of $40,781 versus $32,011 for females. The per capita income for the county was $27,530. About 6.5% of families and 9.1% of the population were below the poverty line, including 9.5% of those under age 18 and 10.2% of those age 65 or over.[12]
Communities
City
Town
Villages
Unincorporated community
Politics
| Year | Republican | Democratic | Third Parties |
|---|---|---|---|
| 2016 | 75.4% 1,966 | 20.5% 535 | 4.1% 107 |
| 2012 | 61.8% 1,587 | 35.4% 910 | 2.8% 71 |
| 2008 | 55.8% 1,455 | 41.8% 1,090 | 2.4% 62 |
| 2004 | 64.3% 1,696 | 35.2% 927 | 0.5% 13 |
| 2000 | 59.1% 1,458 | 38.6% 954 | 2.3% 57 |
| 1996 | 43.8% 1,112 | 39.9% 1,012 | 16.3% 414 |
| 1992 | 40.7% 1,132 | 38.0% 1,057 | 21.4% 594 |
| 1988 | 55.0% 1,535 | 44.6% 1,243 | 0.4% 12 |
| 1984 | 67.3% 1,976 | 32.1% 943 | 0.6% 16 |
| 1980 | 65.4% 1,990 | 30.9% 941 | 3.7% 111 |
| 1976 | 55.4% 1,789 | 44.1% 1,424 | 0.6% 19 |
| 1972 | 66.0% 2,228 | 33.9% 1,145 | 0.1% 3 |
| 1968 | 55.6% 1,971 | 35.3% 1,252 | 9.2% 325 |
| 1964 | 45.5% 1,627 | 54.5% 1,952 | 0.0% 0 |
| 1960 | 59.4% 2,267 | 40.5% 1,543 | 0.1% 4 |
| 1956 | 60.9% 2,303 | 39.1% 1,478 | 0.0% 0 |
| 1952 | 60.4% 2,298 | 39.6% 1,506 | 0.1% 3 |
| 1948 | 51.3% 1,840 | 48.4% 1,735 | 0.4% 13 |
| 1944 | 53.8% 2,185 | 45.9% 1,864 | 0.2% 9 |
| 1940 | 50.7% 2,585 | 48.9% 2,492 | 0.4% 22 |
| 1936 | 42.1% 2,165 | 57.3% 2,945 | 0.6% 28 |
| 1932 | 36.2% 1,740 | 62.7% 3,012 | 1.1% 52 |
| 1928 | 60.0% 2,601 | 39.9% 1,730 | 0.2% 7 |
| 1924 | 50.5% 2,227 | 45.2% 1,994 | 4.3% 190 |
| 1920 | 52.3% 2,075 | 45.0% 1,786 | 2.8% 110 |
| 1916 | 45.7% 2,126 | 52.8% 2,457 | 1.4% 67 |
| 1912 | 15.4% 379 | 54.5% 1,341 | 30.1% 739 |
| 1908 | 42.8% 1,101 | 53.4% 1,376 | 3.8% 98 |
| 1904 | 45.5% 1,163 | 48.3% 1,236 | 6.2% 159 |
| 1900 | 42.6% 1,204 | 56.1% 1,585 | 1.3% 38 |
| 1896 | 43.6% 1,261 | 55.3% 1,598 | 1.1% 31 |
| 1892 | 39.7% 1,006 | 50.6% 1,282 | 9.6% 244 |
See also
References
- 1 2 "State & County QuickFacts". United States Census Bureau. Retrieved July 8, 2014.
- ↑ "Find a County". National Association of Counties. Retrieved 2011-06-07.
- 1 2 "Population, Housing Units, Area, and Density: 2010 - County". United States Census Bureau. Retrieved 2015-07-12.
- 1 2 "Monthly Averages for Winchester, Illinois". The Weather Channel. Retrieved 2011-01-27.
- ↑ "Population and Housing Unit Estimates". Retrieved June 9, 2017.
- ↑ "U.S. Decennial Census". United States Census Bureau. Retrieved July 8, 2014.
- ↑ "Historical Census Browser". University of Virginia Library. Retrieved July 8, 2014.
- ↑ "Population of Counties by Decennial Census: 1900 to 1990". United States Census Bureau. Retrieved July 8, 2014.
- ↑ "Census 2000 PHC-T-4. Ranking Tables for Counties: 1990 and 2000" (PDF). United States Census Bureau. Retrieved July 8, 2014.
- 1 2 3 "DP-1 Profile of General Population and Housing Characteristics: 2010 Demographic Profile Data". United States Census Bureau. Retrieved 2015-07-12.
- ↑ "DP02 SELECTED SOCIAL CHARACTERISTICS IN THE UNITED STATES – 2006-2010 American Community Survey 5-Year Estimates". United States Census Bureau. Retrieved 2015-07-12.
- ↑ "DP03 SELECTED ECONOMIC CHARACTERISTICS – 2006-2010 American Community Survey 5-Year Estimates". United States Census Bureau. Retrieved 2015-07-12.
- ↑ Leip, David. "Dave Leip's Atlas of U.S. Presidential Elections". uselectionatlas.org. Retrieved 1 April 2018.
External links
Places adjacent to Scott County, Illinois | ||||||||||
|---|---|---|---|---|---|---|---|---|---|---|
| ||||||||||
Municipalities and communities of Scott County, Illinois, United States | ||
|---|---|---|
| City | ||
| Town | ||
| Villages | ||
| Precincts |
| |
| Unincorporated communities | ||
