United States presidential election in Oklahoma, 2016
|
| |||||||||||||||||||||||||||||||||
| |||||||||||||||||||||||||||||||||
| Turnout |
67.91% | ||||||||||||||||||||||||||||||||
|---|---|---|---|---|---|---|---|---|---|---|---|---|---|---|---|---|---|---|---|---|---|---|---|---|---|---|---|---|---|---|---|---|---|
| |||||||||||||||||||||||||||||||||
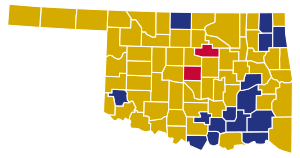
 County results
Trump 50–60%
60–70%
70–80%
80–90% | |||||||||||||||||||||||||||||||||
 Results by county showing number of votes by size and candidates by color[1] | |||||||||||||||||||||||||||||||||
| |||||||||||||||||||||||||||||||||
.jpg)


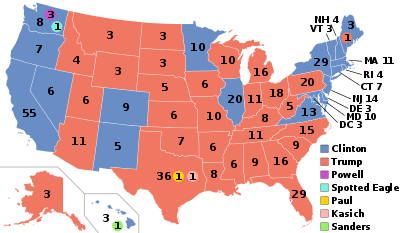
The 2016 United States presidential election in Oklahoma was held on November 8, 2016, as part of the 2016 general election in which all 50 states and The District of Columbia participated. Oklahoma voters chose electors to represent them in the Electoral College via a popular vote pitting the Republican Party's nominee, businessman Donald Trump, and running mate Indiana Governor Mike Pence against Democratic Party nominee, former Secretary of State Hillary Clinton and her running mate, Virginia Senator Tim Kaine.
On March 1, 2016, in the presidential primaries, Oklahoma voters expressed their preferences for the Democratic and Republican parties' respective nominees for president. Registered members of each party could only vote in their party's primary, while independent voters could only vote in the Democratic primary.[2]
Donald Trump won the election in Oklahoma with 65.3% of the vote. Hillary Clinton received 28.9% of the vote.[3] Considered a safe Republican state, Oklahoma has voted Republican in fifteen of the last sixteen elections.[4] It was also one of two states where Donald Trump won every county, the other being West Virginia. This also marked the fourth consecutive election in which the Republican candidate carried every county in the state.[4]
Gary Johnson, the Libertarian Party candidate, became the first third-party candidate to achieve ballot access in Oklahoma since 2000. He received 5.75% of the vote, the highest percentage for a third party in the state since Ross Perot in 1996. He was the only third-party candidate to successfully file for ballot access in Oklahoma.
Primary elections
Democratic primary
- Results
|
| |||||||||||||||||||
| |||||||||||||||||||
| |||||||||||||||||||
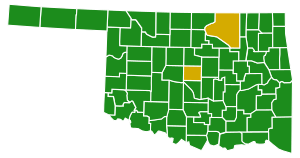 Oklahoma results by county
Bernie Sanders
Hillary Clinton | |||||||||||||||||||
| Oklahoma Democratic primary, March 1, 2016 | |||||
|---|---|---|---|---|---|
| Candidate | Popular vote | Estimated delegates | |||
| Count | Percentage | Pledged | Unpledged | Total | |
| Bernie Sanders | 174,228 | 51.88% | 21 | 1 | 22 |
| Hillary Clinton | 139,443 | 41.52% | 17 | 1 | 18 |
| Martin O'Malley (withdrawn) | 7,672 | 2.28% | |||
| Keith Russell Judd | 4,386 | 1.31% | |||
| Michael Alan Steinberg | 4,171 | 1.24% | |||
| Star Locke (withdrawn) | 3,458 | 1.03% | |||
| Rocky De La Fuente | 2,485 | 0.74% | |||
| Uncommitted | N/A | 0 | 2 | 2 | |
| Total | 335,843 | 100% | 38 | 4 | 42 |
| Source: The Green Papers, Oklahoma State Election Board | |||||
Republican primary
|
| |||||||||||||||||||||||||||||||||||||||||
| |||||||||||||||||||||||||||||||||||||||||
| |||||||||||||||||||||||||||||||||||||||||
 Oklahoma results by county
Ted Cruz Donald Trump Marco Rubio | |||||||||||||||||||||||||||||||||||||||||
.jpg)
Twelve candidates appeared on the Republican presidential primary ballot:[5]
| Oklahoma Republican primary, March 1, 2016 | |||||
|---|---|---|---|---|---|
| Candidate | Votes | Percentage | Actual delegate count | ||
| Bound | Unbound | Total | |||
| 158,078 | 34.37% | 15 | 0 | 15 | |
| Donald Trump | 130,267 | 28.32% | 14 | 0 | 14 |
| Marco Rubio | 119,633 | 26.01% | 12 | 0 | 12 |
| Ben Carson | 28,601 | 6.22% | 0 | 0 | 0 |
| John Kasich | 16,524 | 3.59% | 0 | 0 | 0 |
| Jeb Bush (withdrawn) | 2,091 | 0.45% | 0 | 0 | 0 |
| Rand Paul (withdrawn) | 1,666 | 0.36% | 0 | 0 | 0 |
| Mike Huckabee (withdrawn) | 1,308 | 0.28% | 0 | 0 | 0 |
| Carly Fiorina (withdrawn) | 610 | 0.13% | 0 | 0 | 0 |
| Chris Christie (withdrawn) | 545 | 0.12% | 0 | 0 | 0 |
| Rick Santorum (withdrawn) | 375 | 0.08% | 0 | 0 | 0 |
| Lindsey Graham (withdrawn) | 224 | 0.05% | 0 | 0 | 0 |
| Unprojected delegates: | 2 | 0 | 2 | ||
| Total: | 459,922 | 100.00% | 43 | 0 | 43 |
| Source: The Green Papers | |||||
Polling
General election
Predictions
The following are final 2016 predictions from various organizations for Oklahoma as of Election Day.
- Los Angeles Times: Strongly Trump[6]
- CNN: Solid Trump[7]
- Sabato's Crystal Ball: Safe Trump[8]
- NBC: Likely Trump[9]
- RealClearPolitics: Solid Trump[10]
- Fox News: Solid Republican[11]
- ABC: Solid Trump[12]
Statewide results
| United States presidential election in Oklahoma, 2016[13] | |||||
|---|---|---|---|---|---|
| Party | Candidate | Votes | Percentage | Electoral votes | |
| Republican | Donald Trump | 949,136 | 65.32% | 7 | |
| Democratic | Hillary Clinton | 420,375 | 28.93% | 0 | |
| Libertarian | Gary Johnson | 83,481 | 5.75% | 0 | |
| Totals | 1,452,992 | 100.00% | 7 | ||
Analysis
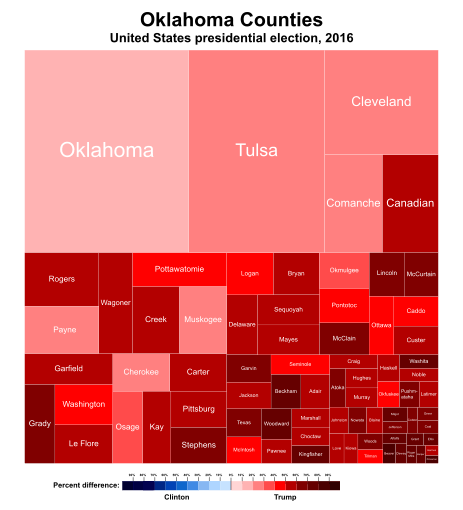
The Republican Party candidate, Donald Trump, carried Oklahoma with a victory margin of 36.39%. While Trump improved over Mitt Romney's 2012 vote total and victory margin, his vote percentage of 65.3% was down from Romney's 66.8%, making 2016 the first time since 1992 the Republican's vote percentage decreased from the previous election. Hillary Clinton's vote percentage of 28.9% is the worst for a Democratic candidate in Oklahoma since George McGovern's 24% in the 1972 election. Clinton however, did make gains in heavily populated Oklahoma County, its surrounding suburban counties, and Tulsa County. In Oklahoma County, Clinton turned a 16.66% advantage for Romney into a 10.5% advantage for Trump, while Trump was held below the 60% mark in Tulsa. Gary Johnson's total was more than twice what was needed to preserve recognized status for the Libertarian Party in the state, meaning that in 2018 the LP will be the first alternative party on the ballot for a gubernatorial election since the Reform Party in 1998. [14]
With 65.32% of the popular vote, Oklahoma would prove to be Trump's third strongest state in the 2016 election after Wyoming and West Virginia[15]. The state would also prove to be Gary Johnson's fourth strongest state with 5.75% of the popular vote after New Mexico, North Dakota and Alaska.
Results by county
Final results by county from the Oklahoma State Election Board.[1]
Trump won all the counties in Oklahoma.
| County | Clinton | Trump | Johnson | Total | |
|---|---|---|---|---|---|
| Adair | Votes | 1,382 | 4,787 | 344 | 6,513 |
| % | 21.22% | 73.50% | 5.28% | 100.00% | |
| Alfalfa | Votes | 216 | 1,933 | 109 | 2,258 |
| % | 9.57% | 85.61% | 4.83% | 100.00% | |
| Atoka | Votes | 795 | 4,084 | 139 | 5,018 |
| % | 15.84% | 81.39% | 2.77% | 100.00% | |
| Beaver | Votes | 176 | 1,993 | 74 | 2,243 |
| % | 7.85% | 88.85% | 3.30% | 100.00% | |
| Beckham | votes | 960 | 6,308 | 284 | 7,552 |
| percent | 12.71% | 83.53% | 3.76% | 100.00% | |
| Blaine | votes | 711 | 2,884 | 198 | 3,793 |
| percent | 18.75% | 76.03% | 5.22% | 100.00% | |
| Bryan | votes | 2,804 | 10,478 | 536 | 13,818 |
| percent | 20.29% | 75.83% | 3.88% | 100.00% | |
| Caddo | votes | 2,420 | 6,482 | 446 | 9,348 |
| percent | 25.89% | 69.34% | 4.77% | 100.00% | |
| Canadian | votes | 11,674 | 39,986 | 3,618 | 55,278 |
| percent | 21.12% | 72.34% | 6.55% | 100.00% | |
| Carter | votes | 4,002 | 13,752 | 780 | 18,534 |
| percent | 21.59% | 74.20% | 4.21% | 100.00% | |
| Cherokee | votes | 5,456 | 9,994 | 1,040 | 16,490 |
| percent | 33.09% | 60.61% | 6.31% | 100.00% | |
| Choctaw | votes | 1,067 | 4,206 | 153 | 5,426 |
| percent | 19.66% | 77.52% | 2.82% | 100.00% | |
| Cimarron | votes | 71 | 963 | 45 | 1,079 |
| percent | 6.58% | 89.25% | 4.17% | 100.00% | |
| Cleveland | votes | 38,829 | 62,538 | 8,083 | 109,450 |
| percent | 35.48% | 57.14% | 7.39% | 100.00% | |
| Coal | votes | 411 | 1,898 | 90 | 2,399 |
| percent | 17.13% | 79.12% | 3.75% | 100.00% | |
| Comanche | votes | 11,463 | 19,183 | 1,918 | 32,564 |
| percent | 35.20% | 58.91% | 5.89% | 100.00% | |
| Cotton | votes | 424 | 2,054 | 124 | 2,602 |
| percent | 16.30% | 78.94% | 4.77% | 100.00% | |
| Craig | votes | 1,252 | 4,283 | 250 | 5,785 |
| percent | 21.64% | 74.04% | 4.32% | 100.00% | |
| Creek | votes | 5,841 | 21,575 | 1,414 | 28,830 |
| percent | 20.26% | 74.84% | 4.90% | 100.00% | |
| Custer | votes | 2,104 | 7,826 | 611 | 10,541 |
| percent | 19.96% | 74.24% | 5.80% | 100.00% | |
| Delaware | votes | 3,311 | 11,826 | 579 | 15,716 |
| percent | 21.07% | 75.25% | 3.68% | 100.00% | |
| Dewey | votes | 222 | 1,965 | 61 | 2,248 |
| percent | 9.88% | 87.41% | 2.71% | 100.00% | |
| Ellis | votes | 155 | 1,611 | 61 | 1,827 |
| percent | 8.48% | 88.18% | 3.34% | 100.00% | |
| Garfield | votes | 4,397 | 16,009 | 1,304 | 21,710 |
| percent | 20.25% | 73.74% | 6.01% | 100.00% | |
| Garvin | votes | 1,855 | 8,253 | 438 | 10,546 |
| percent | 17.59% | 78.26% | 4.15% | 100.00% | |
| Grady | votes | 3,882 | 17,316 | 1,088 | 22,286 |
| percent | 17.42% | 77.70% | 4.88% | 100.00% | |
| Grant | votes | 288 | 1,827 | 86 | 2,201 |
| percent | 13.08% | 83.01% | 3.91% | 100.00% | |
| Greer | votes | 323 | 1,482 | 91 | 1,896 |
| percent | 17.04% | 78.16% | 4.80% | 100.00% | |
| Harmon | votes | 225 | 715 | 37 | 977 |
| percent | 23.03% | 73.18% | 3.79% | 100.00% | |
| Harper | votes | 134 | 1,318 | 47 | 1,499 |
| percent | 8.94% | 87.93% | 3.14% | 100.00% | |
| Haskell | votes | 882 | 3,701 | 155 | 4,738 |
| percent | 18.62% | 78.11% | 3.27% | 100.00% | |
| Hughes | votes | 961 | 3,388 | 177 | 4,526 |
| percent | 21.23% | 74.86% | 3.91% | 100.00% | |
| Jackson | votes | 1,473 | 5,969 | 364 | 7,806 |
| percent | 18.87% | 76.47% | 4.66% | 100.00% | |
| Jefferson | votes | 365 | 1,910 | 75 | 2,350 |
| percent | 15.53% | 81.28% | 3.19% | 100.00% | |
| Johnston | votes | 786 | 3,093 | 139 | 4,018 |
| percent | 19.56% | 76.98% | 3.46% | 100.00% | |
| Kay | votes | 3,738 | 12,172 | 893 | 16,803 |
| percent | 22.25% | 72.44% | 5.31% | 100.00% | |
| Kingfisher | votes | 786 | 5,156 | 189 | 6,131 |
| percent | 12.82% | 84.10% | 3.08% | 100.00% | |
| Kiowa | votes | 767 | 2,596 | 130 | 3,493 |
| percent | 21.96% | 74.32% | 3.72% | 100.00% | |
| Latimer | votes | 797 | 3,100 | 159 | 4,056 |
| percent | 19.65% | 76.43% | 3.92% | 100.00% | |
| Le Flore | votes | 3,250 | 13,362 | 609 | 17,221 |
| percent | 18.87% | 77.59% | 3.54% | 100.00% | |
| Lincoln | votes | 2,430 | 10,854 | 741 | 14,025 |
| percent | 17.33% | 77.39% | 5.28% | 100.00% | |
| Logan | votes | 4,248 | 13,633 | 1,098 | 18,979 |
| percent | 22.38% | 71.83% | 5.79% | 100.00% | |
| Love | votes | 735 | 2,922 | 132 | 3,789 |
| percent | 19.40% | 77.12% | 3.48% | 100.00% | |
| Major | votes | 310 | 2,948 | 149 | 3,407 |
| percent | 9.10% | 86.53% | 4.37% | 100.00% | |
| Marshall | votes | 1,096 | 4,206 | 190 | 5,492 |
| percent | 19.96% | 76.58% | 3.46% | 100.00% | |
| Mayes | votes | 3,423 | 11,555 | 739 | 15,717 |
| percent | 21.78% | 73.52% | 4.70% | 100.00% | |
| McClain | votes | 2,894 | 13,169 | 795 | 16,858 |
| percent | 17.17% | 78.12% | 4.72% | 100.00% | |
| McCurtain | votes | 1,802 | 8,656 | 268 | 10,726 |
| percent | 16.80% | 80.70% | 2.50% | 100.00% | |
| McIntosh | votes | 2,123 | 5,505 | 335 | 7,963 |
| percent | 26.66% | 69.13% | 4.21% | 100.00% | |
| Murray | votes | 1,087 | 4,175 | 266 | 5,528 |
| percent | 19.66% | 75.52% | 4.81% | 100.00% | |
| Muskogee | votes | 7,977 | 15,043 | 1,196 | 24,216 |
| percent | 32.94% | 62.12% | 4.94% | 100.00% | |
| Noble | votes | 901 | 3,715 | 262 | 4,878 |
| percent | 18.47% | 76.16% | 5.37% | 100.00% | |
| Nowata | votes | 742 | 3,321 | 174 | 4,237 |
| percent | 17.51% | 78.38% | 4.11% | 100.00% | |
| Okfuskee | votes | 943 | 2,800 | 200 | 3,943 |
| percent | 23.92% | 71.01% | 5.07% | 100.00% | |
| Oklahoma | votes | 112,813 | 141,569 | 19,560 | 273,942 |
| percent | 41.18% | 51.68% | 7.14% | 100.00% | |
| Okmulgee | votes | 4,385 | 8,944 | 620 | 13,949 |
| percent | 31.44% | 64.12% | 4.44% | 100.00% | |
| Osage | votes | 5,597 | 12,577 | 792 | 18,966 |
| percent | 29.51% | 66.31% | 4.18% | 100.00% | |
| Ottawa | votes | 2,584 | 7,631 | 475 | 10,690 |
| percent | 24.17% | 71.38% | 4.44% | 100.00% | |
| Pawnee | votes | 1,344 | 4,729 | 291 | 6,364 |
| percent | 21.12% | 74.31% | 4.57% | 100.00% | |
| Payne | votes | 8,788 | 16,651 | 2,321 | 27,760 |
| percent | 31.66% | 59.98% | 8.36% | 100.00% | |
| Pittsburg | votes | 3,711 | 12,753 | 807 | 17,271 |
| percent | 21.49% | 73.84% | 4.67% | 100.00% | |
| Pontotoc | votes | 3,637 | 10,431 | 763 | 14,831 |
| percent | 24.52% | 70.33% | 5.14% | 100.00% | |
| Pottawatomie | votes | 6,015 | 17,848 | 1,589 | 25,452 |
| percent | 23.63% | 70.12% | 6.24% | 100.00% | |
| Pushmataha | votes | 748 | 3,581 | 154 | 4,483 |
| percent | 16.69% | 79.88% | 3.44% | 100.00% | |
| Roger Mills | votes | 151 | 1,547 | 61 | 1,759 |
| percent | 8.58% | 87.95% | 3.47% | 100.00% | |
| Rogers | votes | 7,902 | 30,913 | 2,047 | 40,862 |
| percent | 19.34% | 75.65% | 5.01% | 100.00% | |
| Seminole | votes | 2,071 | 5,613 | 353 | 8,037 |
| percent | 25.77% | 69.84% | 4.39% | 100.00% | |
| Sequoyah | votes | 3,061 | 10,888 | 488 | 14,437 |
| percent | 21.20% | 75.42% | 3.38% | 100.00% | |
| Stephens | votes | 3,086 | 14,182 | 636 | 17,904 |
| percent | 17.24% | 79.21% | 3.55% | 100.00% | |
| Texas | votes | 858 | 4,621 | 301 | 5,780 |
| percent | 14.84% | 79.95% | 5.21% | 100.00% | |
| Tillman | votes | 657 | 1,944 | 105 | 2,706 |
| percent | 24.28% | 71.84% | 3.88% | 100.00% | |
| Tulsa | votes | 87,847 | 144,258 | 14,949 | 247,054 |
| percent | 35.56% | 58.39% | 6.05% | 100.00% | |
| Wagoner | votes | 6,723 | 23,005 | 1,572 | 31,300 |
| percent | 21.48% | 73.50% | 5.02% | 100.00% | |
| Washington | votes | 5,048 | 15,825 | 1,351 | 22,224 |
| percent | 22.71% | 71.21% | 6.08% | 100.00% | |
| Washita | votes | 588 | 3,854 | 189 | 4,631 |
| percent | 12.70% | 83.22% | 4.08% | 100.00% | |
| Woods | votes | 522 | 2,947 | 199 | 3,668 |
| percent | 14.23% | 80.34% | 5.43% | 100.00% | |
| Woodward | votes | 873 | 6,347 | 375 | 7,595 |
| percent | 11.49% | 83.57% | 4.94% | 100.00% | |
| Grand total | votes | 420,375 | 949,136 | 83,481 | 1,452,992 |
| percent | 28.93% | 65.32% | 5.75% | 100.00% | |
By congressional district
Trump won all five congressional districts.[16]
| District | Trump | Clinton | Representative |
|---|---|---|---|
| 1st | 61% | 33% | Jim Bridenstine |
| 2nd | 73% | 23% | Markwayne Mullin |
| 3rd | 74% | 21% | Frank Lucas |
| 4th | 66% | 28% | Tom Cole |
| 5th | 53% | 40% | Steve Russell |
See also
| Elections in Oklahoma |
|---|
 |
|
|
References
- 1 2 "Official Results General Election — November 8, 2016", OK.gov, The State of Oklahoma
- ↑ "Oklahoma State Election Board". www.Ok.gov. Retrieved July 19, 2017.
- ↑ "Oklahoma Election Results 2016". NYTimes.com. 2016. Retrieved July 19, 2017.
- 1 2 "History of Oklahoma voting in presidential elections since 1932". KJRH. 2016-11-07. Retrieved 2017-07-23.
- ↑ "Nineteen candidates file for Oklahoma Presidential Primary". Fox23.com. Retrieved January 21, 2016.
- ↑ "Our final map has Clinton winning with 352 electoral votes. Compare your picks with ours". Los Angeles Times. 2016-11-06. Retrieved 2016-11-13.
- ↑ "Road to 270: CNN's general election map - CNNPolitics.com". Cnn.com. 2016-11-08. Retrieved 2016-11-13.
- ↑ "Larry J. Sabato's Crystal Ball » 2016 President". Centerforpolitics.org. 2016-11-07. Retrieved 2016-11-13.
- ↑ Todd, Chuck. "NBC's Final Battleground Map Shows Clinton With a Significant Lead". NBC News. Retrieved 2016-11-13.
- ↑ "2016 Election Maps - Battle for White House". RealClearPolitics. Retrieved 2016-11-13.
- ↑ "Electoral Scorecard: Map shifts again in Trump's favor, as Clinton holds edge". Fox News. 2016-11-07. Retrieved 2016-11-13.
- ↑ "The Final 15: The Latest Polls in the Swing States That Will Decide the Election". Abcnews.go.com. 2016-11-07. Retrieved 2016-11-13.
- ↑ https://www.ok.gov/elections/support/ok_results_seb.pdf
- ↑ "Libertarian Party makes historic strides in Oklahoma, U.S. elections". reddirtreport.com. November 11, 2016.
- ↑ "2016 Presidential Election Statistics". Dave Leip’s Atlas of U.S. Presidential Elections. Retrieved 2018-03-05.
- ↑ "Presidential Results by Congressional District, 2000-2008 – Swing State Project". www.swingstateproject.com.