Morgan County, Illinois
| Morgan County, Illinois | |
|---|---|
 Morgan County Courthouse, Jacksonville | |
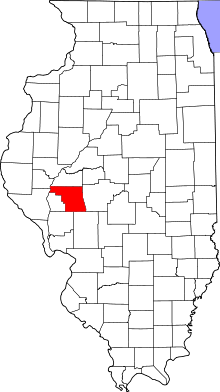 Location in the U.S. state of Illinois | |
 Illinois's location in the U.S. | |
| Founded | 1823 |
| Named for | Daniel Morgan |
| Seat | Jacksonville |
| Largest city | Jacksonville |
| Area | |
| • Total | 572 sq mi (1,481 km2) |
| • Land | 569 sq mi (1,474 km2) |
| • Water | 3.5 sq mi (9 km2), 0.6% |
| Population | |
| • (2010) | 35,547 |
| • Density | 62/sq mi (24/km2) |
| Congressional district | 18th |
| Time zone | Central: UTC−6/−5 |
Morgan County is a county located in the U.S. state of Illinois. According to the 2010 census, it had a population of 35,547.[1] Its county seat is Jacksonville.[2]
Morgan County is part of the Jacksonville, IL Micropolitan Statistical Area, which is also included in the Springfield-Jacksonville-Lincoln, IL Combined Statistical Area.
History
Morgan County was formed in 1823 out of Greene and Sangamon Counties. It was named in honor of General Daniel Morgan, who defeated the British at the Battle of Cowpens in the American Revolutionary War. General Morgan was serving under General Nathanael Greene at Cowpens.
 Morgan County from the time of its creation to 1837
 Morgan County between 1837 and 1839, when Scott County was split off
 Morgan County between 1839 and 1845
 Morgan County in 1845, when its border with Cass County was moved southward, bringing both to their present borders
Geography
According to the US Census Bureau, the county has a total area of 572 square miles (1,480 km2), of which 569 square miles (1,470 km2) is land and 3.5 square miles (9.1 km2) (0.6%) is water.[3]
Climate and weather
| Jacksonville, Illinois | ||||||||||||||||||||||||||||||||||||||||||||||||||||||||||||
|---|---|---|---|---|---|---|---|---|---|---|---|---|---|---|---|---|---|---|---|---|---|---|---|---|---|---|---|---|---|---|---|---|---|---|---|---|---|---|---|---|---|---|---|---|---|---|---|---|---|---|---|---|---|---|---|---|---|---|---|---|
| Climate chart (explanation) | ||||||||||||||||||||||||||||||||||||||||||||||||||||||||||||
| ||||||||||||||||||||||||||||||||||||||||||||||||||||||||||||
| ||||||||||||||||||||||||||||||||||||||||||||||||||||||||||||
Average temperatures in the county seat of Jacksonville range from a low of 15 °F (−9 °C) in January to a high of 87 °F (31 °C) in July; a record low of −28 °F (−33 °C) was recorded in February 1934 and a record high of 114 °F (46 °C) was recorded in July 1954. Average monthly precipitation ranged from 1.35 inches (34 mm) in January to 4.86 inches (123 mm) in May.[4]
Major highways
Adjacent counties
- Cass County - north
- Sangamon County - east
- Macoupin County - southeast
- Greene County - south
- Pike County - west
- Scott County - west
- Brown County - northwest
National protected area
Demographics
| Historical population | |||
|---|---|---|---|
| Census | Pop. | %± | |
| 1830 | 12,714 | — | |
| 1840 | 19,547 | 53.7% | |
| 1850 | 16,064 | −17.8% | |
| 1860 | 22,112 | 37.6% | |
| 1870 | 28,463 | 28.7% | |
| 1880 | 31,514 | 10.7% | |
| 1890 | 32,636 | 3.6% | |
| 1900 | 35,006 | 7.3% | |
| 1910 | 34,420 | −1.7% | |
| 1920 | 33,567 | −2.5% | |
| 1930 | 34,240 | 2.0% | |
| 1940 | 36,378 | 6.2% | |
| 1950 | 35,568 | −2.2% | |
| 1960 | 36,571 | 2.8% | |
| 1970 | 36,174 | −1.1% | |
| 1980 | 37,502 | 3.7% | |
| 1990 | 36,397 | −2.9% | |
| 2000 | 36,616 | 0.6% | |
| 2010 | 35,547 | −2.9% | |
| Est. 2016 | 34,277 | [5] | −3.6% |
| US Decennial Census[6] 1790-1960[7] 1900-1990[8] 1990-2000[9] 2010-2013[1] | |||
As of the 2010 United States Census, there were 35,547 people, 14,104 households, and 8,851 families residing in the county.[10] The population density was 62.5 inhabitants per square mile (24.1/km2). There were 15,515 housing units at an average density of 27.3 per square mile (10.5/km2).[3] The racial makeup of the county was 90.9% white, 6.0% black or African American, 0.5% Asian, 0.2% American Indian, 0.8% from other races, and 1.6% from two or more races. Those of Hispanic or Latino origin made up 2.0% of the population.[10] In terms of ancestry, 25.9% were German, 21.6% were American, 15.4% were Irish, and 14.5% were English.[11]
Of the 14,104 households, 28.3% had children under the age of 18 living with them, 47.4% were married couples living together, 11.2% had a female householder with no husband present, 37.2% were non-families, and 31.5% of all households were made up of individuals. The average household size was 2.30 and the average family size was 2.86. The median age was 40.8 years.[10]
The median income for a household in the county was $44,645 and the median income for a family was $59,185. Males had a median income of $43,609 versus $29,893 for females. The per capita income for the county was $23,244. About 11.2% of families and 16.4% of the population were below the poverty line, including 25.8% of those under age 18 and 7.5% of those age 65 or over.[12]
Communities
Cities
Villages
Unincorporated communities
Politics
Morgan County has been reliably Republican from its beginning; the Democratic nominee has gained a plurality only 19% of the time (6 of 32 elections).
| Year | Republican | Democratic | Third Parties |
|---|---|---|---|
| 2016 | 61.3% 9,076 | 31.7% 4,696 | 7.0% 1,028 |
| 2012 | 56.4% 7,972 | 41.1% 5,806 | 2.6% 364 |
| 2008 | 49.3% 7,591 | 48.5% 7,467 | 2.2% 336 |
| 2004 | 61.9% 9,392 | 37.2% 5,650 | 0.9% 138 |
| 2000 | 56.2% 8,058 | 41.2% 5,899 | 2.6% 377 |
| 1996 | 44.6% 6,352 | 43.2% 6,150 | 12.2% 1,736 |
| 1992 | 40.3% 6,566 | 39.0% 6,351 | 20.7% 3,380 |
| 1988 | 59.2% 8,808 | 40.5% 6,032 | 0.3% 46 |
| 1984 | 66.4% 10,683 | 33.3% 5,361 | 0.3% 53 |
| 1980 | 61.2% 10,406 | 32.3% 5,483 | 6.5% 1,108 |
| 1976 | 53.9% 8,885 | 44.9% 7,403 | 1.2% 201 |
| 1972 | 66.1% 11,103 | 33.8% 5,674 | 0.1% 12 |
| 1968 | 54.5% 8,902 | 38.5% 6,281 | 7.0% 1,144 |
| 1964 | 44.0% 7,240 | 56.1% 9,235 | 0.0% 0 |
| 1960 | 57.4% 9,791 | 42.5% 7,259 | 0.1% 12 |
| 1956 | 61.8% 10,262 | 38.1% 6,327 | 0.1% 11 |
| 1952 | 61.0% 10,405 | 38.9% 6,637 | 0.0% 4 |
| 1948 | 55.1% 8,398 | 44.6% 6,798 | 0.4% 59 |
| 1944 | 56.0% 8,923 | 43.7% 6,965 | 0.3% 42 |
| 1940 | 52.6% 10,137 | 47.1% 9,082 | 0.3% 64 |
| 1936 | 47.0% 8,844 | 52.1% 9,800 | 0.9% 167 |
| 1932 | 43.0% 7,787 | 56.1% 10,170 | 1.0% 173 |
| 1928 | 63.5% 10,192 | 36.2% 5,805 | 0.3% 49 |
| 1924 | 55.4% 8,223 | 38.5% 5,721 | 6.1% 900 |
| 1920 | 62.9% 8,169 | 34.2% 4,447 | 2.9% 377 |
| 1916 | 50.3% 7,536 | 47.4% 7,104 | 2.4% 358 |
| 1912 | 27.6% 2,090 | 48.1% 3,648 | 24.3% 1,844 |
| 1908 | 48.1% 4,019 | 47.8% 3,993 | 4.2% 351 |
| 1904 | 51.7% 4,248 | 40.6% 3,343 | 7.7% 634 |
| 1900 | 48.7% 4,341 | 48.4% 4,321 | 2.9% 260 |
| 1896 | 49.3% 4,317 | 49.3% 4,323 | 1.4% 121 |
| 1892 | 43.7% 3,471 | 50.4% 4,006 | 5.9% 470 |
See also
References
- 1 2 "State & County QuickFacts". US Census Bureau. Archived from the original on 15 July 2011. Retrieved 7 July 2014.
- ↑ "Find a County". National Association of Counties. Retrieved 7 June 2011.
- 1 2 "Population, Housing Units, Area, and Density: 2010 - County". US Census Bureau. Retrieved 12 July 2015.
- 1 2 "Monthly Averages for Jacksonville, Illinois". The Weather Channel. Retrieved 27 January 2011.
- ↑ "Population and Housing Unit Estimates". Retrieved 9 June 2017.
- ↑ "US Decennial Census". US Census Bureau. Retrieved 7 July 2014.
- ↑ "Historical Census Browser". University of Virginia Library. Retrieved 7 July 2014.
- ↑ "Population of Counties by Decennial Census: 1900 to 1990". US Census Bureau. Retrieved 7 July 2014.
- ↑ "Census 2000 PHC-T-4. Ranking Tables for Counties: 1990 and 2000" (PDF). US Census Bureau. Retrieved 7 July 2014.
- 1 2 3 "Profile of General Population and Housing Characteristics: 2010 Demographic Profile Data". US Census Bureau. Retrieved 12 July 2015.
- ↑ "Selected Social Characteristics in the United States – 2006-2010 American Community Survey 5-Year Estimates". US Census Bureau. Retrieved 12 July 2015.
- ↑ "Selected Economic Characteristics – 2006-2010 American Community Survey 5-Year Estimates". US Census Bureau. Retrieved 12 July 2015.
- ↑ Leip, David. "Dave Leip's Atlas of U.S. Presidential Elections". uselectionatlas.org. Retrieved 31 March 2018.
External links
Places adjacent to Morgan County, Illinois | ||||||||||
|---|---|---|---|---|---|---|---|---|---|---|
| ||||||||||
Municipalities and communities of Morgan County, Illinois, United States | ||
|---|---|---|
| Cities | ||
| Villages | ||
| Unincorporated communities | ||
