Henderson County, Illinois
| Henderson County, Illinois | |
|---|---|
 Henderson County Courthouse, Oquawka | |
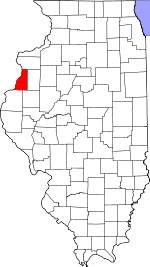 Location in the U.S. state of Illinois | |
 Illinois's location in the U.S. | |
| Founded | 1841 |
| Named for | Richard Henderson |
| Seat | Oquawka |
| Largest village | Oquawka |
| Area | |
| • Total | 395 sq mi (1,023 km2) |
| • Land | 379 sq mi (982 km2) |
| • Water | 16 sq mi (41 km2), 4.1% |
| Population | |
| • (2010) | 7,331 |
| • Density | 19/sq mi (7/km2) |
| Congressional district | 17th |
| Time zone | Central: UTC−6/−5 |
Henderson County is a county located in the U.S. state of Illinois. According to the 2010 census, it has a population of 7,331.[1] Its county seat is Oquawka.[2]
Henderson County is part of the Burlington, IA–IL Micropolitan Statistical Area.
History
Henderson County was formed in 1841 out of Warren County. It was named for Henderson County, Kentucky, which was named for Richard Henderson,[3] founder of the Transylvania Company, an early attempt to organize what later became Kentucky around 1775.
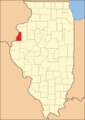 Henderson County at the time of its creation in 1841
Geography
According to the U.S. Census Bureau, the county has a total area of 395 square miles (1,020 km2), of which 379 square miles (980 km2) is land and 16 square miles (41 km2) (4.1%) is water.[4]
Climate and weather
| Oquawka, Illinois | ||||||||||||||||||||||||||||||||||||||||||||||||||||||||||||
|---|---|---|---|---|---|---|---|---|---|---|---|---|---|---|---|---|---|---|---|---|---|---|---|---|---|---|---|---|---|---|---|---|---|---|---|---|---|---|---|---|---|---|---|---|---|---|---|---|---|---|---|---|---|---|---|---|---|---|---|---|
| Climate chart (explanation) | ||||||||||||||||||||||||||||||||||||||||||||||||||||||||||||
| ||||||||||||||||||||||||||||||||||||||||||||||||||||||||||||
| ||||||||||||||||||||||||||||||||||||||||||||||||||||||||||||
In recent years, average temperatures in the county seat of Oquawka have ranged from a low of 15 °F (−9 °C) in January to a high of 85 °F (29 °C) in July, although a record low of −26 °F (−32 °C) was recorded in February 1996 and a record high of 105 °F (41 °C) was recorded in August 1983. Average monthly precipitation ranged from 1.31 inches (33 mm) in January to 4.48 inches (114 mm) in July.[5]
Major highways
Adjacent counties
- Mercer County - north
- Warren County - east
- McDonough County - southeast
- Hancock County - south
- Lee County, Iowa - southwest
- Des Moines County, Iowa - west
Demographics
| Historical population | |||
|---|---|---|---|
| Census | Pop. | %± | |
| 1850 | 4,612 | — | |
| 1860 | 9,501 | 106.0% | |
| 1870 | 12,582 | 32.4% | |
| 1880 | 10,722 | −14.8% | |
| 1890 | 9,876 | −7.9% | |
| 1900 | 10,836 | 9.7% | |
| 1910 | 9,724 | −10.3% | |
| 1920 | 9,770 | 0.5% | |
| 1930 | 8,778 | −10.2% | |
| 1940 | 8,949 | 1.9% | |
| 1950 | 8,416 | −6.0% | |
| 1960 | 8,237 | −2.1% | |
| 1970 | 8,451 | 2.6% | |
| 1980 | 9,114 | 7.8% | |
| 1990 | 8,096 | −11.2% | |
| 2000 | 8,213 | 1.4% | |
| 2010 | 7,331 | −10.7% | |
| Est. 2016 | 6,869 | [6] | −6.3% |
| U.S. Decennial Census[7] 1790-1960[8] 1900-1990[9] 1990-2000[10] 2010-2013[1] | |||
As of the 2010 United States Census, there were 7,331 people, 3,149 households, and 2,127 families residing in the county.[11] The population density was 19.3 inhabitants per square mile (7.5/km2). There were 3,827 housing units at an average density of 10.1 per square mile (3.9/km2).[4] The racial makeup of the county was 98.2% white, 0.2% Asian, 0.2% American Indian, 0.2% black or African American, 0.1% Pacific islander, 0.2% from other races, and 1.0% from two or more races. Those of Hispanic or Latino origin made up 1.1% of the population.[11] In terms of ancestry, 24.4% were German, 14.5% were Irish, 11.9% were English, 5.9% were Swedish, and 5.0% were American.[12]
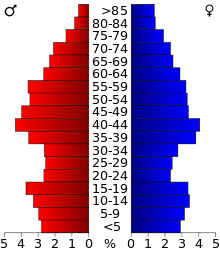
Of the 3,149 households, 26.9% had children under the age of 18 living with them, 54.9% were married couples living together, 8.7% had a female householder with no husband present, 32.5% were non-families, and 27.3% of all households were made up of individuals. The average household size was 2.31 and the average family size was 2.78. The median age was 47.2 years.[11]
The median income for a household in the county was $43,450 and the median income for a family was $55,154. Males had a median income of $41,052 versus $27,426 for females. The per capita income for the county was $22,492. About 7.8% of families and 11.4% of the population were below the poverty line, including 13.3% of those under age 18 and 8.3% of those age 65 or over.[13]
Politics
| Year | Republican | Democratic | Third Parties |
|---|---|---|---|
| 2016 | 61.3% 2,155 | 32.8% 1,155 | 5.9% 208 |
| 2012 | 43.2% 1,541 | 55.4% 1,978 | 1.4% 49 |
| 2008 | 40.3% 1,541 | 57.9% 2,215 | 1.9% 73 |
| 2004 | 44.7% 1,857 | 54.6% 2,269 | 0.7% 27 |
| 2000 | 44.2% 1,708 | 52.5% 2,030 | 3.3% 128 |
| 1996 | 34.1% 1,233 | 54.0% 1,953 | 12.0% 433 |
| 1992 | 32.4% 1,310 | 49.7% 2,013 | 17.9% 725 |
| 1988 | 45.2% 1,726 | 54.6% 2,085 | 0.3% 10 |
| 1984 | 53.5% 2,289 | 46.0% 1,969 | 0.5% 20 |
| 1980 | 57.5% 2,443 | 37.9% 1,609 | 4.6% 194 |
| 1976 | 50.2% 2,210 | 48.8% 2,152 | 1.0% 45 |
| 1972 | 60.6% 2,689 | 39.3% 1,744 | 0.1% 3 |
| 1968 | 53.6% 2,224 | 39.4% 1,635 | 7.0% 289 |
| 1964 | 45.1% 1,863 | 54.9% 2,271 | |
| 1960 | 60.2% 2,572 | 39.7% 1,697 | 0.1% 4 |
| 1956 | 65.1% 2,743 | 34.9% 1,469 | 0.1% 3 |
| 1952 | 66.0% 2,839 | 33.9% 1,458 | 0.1% 6 |
| 1948 | 60.9% 2,336 | 38.2% 1,465 | 1.0% 37 |
| 1944 | 63.3% 2,695 | 36.4% 1,550 | 0.2% 10 |
| 1940 | 61.8% 3,264 | 37.4% 1,977 | 0.8% 40 |
| 1936 | 51.0% 2,663 | 47.8% 2,496 | 1.2% 61 |
| 1932 | 42.6% 1,815 | 55.6% 2,372 | 1.9% 79 |
| 1928 | 71.1% 2,695 | 28.1% 1,065 | 0.8% 30 |
| 1924 | 72.9% 2,879 | 20.3% 803 | 6.8% 269 |
| 1920 | 76.7% 2,747 | 20.7% 740 | 2.7% 97 |
| 1916 | 58.5% 2,528 | 37.3% 1,611 | 4.2% 182 |
| 1912 | 27.8% 648 | 31.0% 721 | 41.2% 959 |
| 1908 | 62.2% 1,547 | 33.0% 820 | 4.8% 119 |
| 1904 | 65.7% 1,668 | 27.9% 708 | 6.5% 164 |
| 1900 | 62.0% 1,772 | 34.1% 976 | 3.9% 111 |
| 1896 | 62.8% 1,756 | 34.4% 962 | 2.8% 78 |
| 1892 | 55.9% 1,352 | 38.1% 921 | 6.0% 144 |
As part of Yankee-settled Northern Illinois, Henderson County was solidly Whig in its first three elections and then equally Republican from that party’s formation until the Great Depression. Franklin D. Roosevelt in 1932 was the first Democrat to win it, but the county returned to Republican Alf Landon in 1936 and was not won by a Democrat until the GOP nominated the southern-oriented conservative Barry Goldwater in 1964.
After that, like many Yankee counties, it returned to its Republican roots between 1968 and 1984, but with the shift of the GOP to a Southern Evangelical perspective Henderson County turned reliably Democratic in presidential elections from 1988 to 2012. Economic concerns in the “Rust Belt” led populist Republican Donald Trump to carry the county with over 61 percent of the vote in 2016; the highest percentage won by any Republican candidate since Dwight D. Eisenhower in 1956, and the lowest by a Democrat since Al Smith in 1928.
Henderson County is located in Illinois's 17th Congressional District and is currently represented by Democrat Cheri Bustos. For the Illinois House of Representatives, the county is located in the 94th district and is currently represented by Republican Randy Frese. The county is located in the 47th district of the Illinois Senate, and is currently represented by Republican Jil Tracy.
Communities
City
- Dallas City (partly in Hancock County)
Villages
Unincorporated communities
- Bald Bluff
- Carman
- Carthage Lake
- Decorra
- Hopper
- Olena
- Shokonon
- Terre Haute
Townships
Henderson County is divided into eleven townships:
See also
Footnotes
- 1 2 "State & County QuickFacts". United States Census Bureau. Archived from the original on July 11, 2011. Retrieved July 5, 2014.
- ↑ "Find a County". National Association of Counties. Archived from the original on 2011-05-31. Retrieved 2011-06-07.
- ↑ Gannett, Henry (1905). The Origin of Certain Place Names in the United States. Govt. Print. Off. p. 154.
- 1 2 "Population, Housing Units, Area, and Density: 2010 - County". United States Census Bureau. Retrieved 2015-07-11.
- 1 2 "Monthly Averages for Oquawka, Illinois". The Weather Channel. Retrieved 2011-01-27.
- ↑ "Population and Housing Unit Estimates". Retrieved June 9, 2017.
- ↑ "U.S. Decennial Census". United States Census Bureau. Archived from the original on May 12, 2015. Retrieved July 5, 2014.
- ↑ "Historical Census Browser". University of Virginia Library. Retrieved July 5, 2014.
- ↑ "Population of Counties by Decennial Census: 1900 to 1990". United States Census Bureau. Retrieved July 5, 2014.
- ↑ "Census 2000 PHC-T-4. Ranking Tables for Counties: 1990 and 2000" (PDF). United States Census Bureau. Retrieved July 5, 2014.
- 1 2 3 "DP-1 Profile of General Population and Housing Characteristics: 2010 Demographic Profile Data". United States Census Bureau. Retrieved 2015-07-11.
- ↑ "DP02 SELECTED SOCIAL CHARACTERISTICS IN THE UNITED STATES – 2006-2010 American Community Survey 5-Year Estimates". United States Census Bureau. Retrieved 2015-07-11.
- ↑ "DP03 SELECTED ECONOMIC CHARACTERISTICS – 2006-2010 American Community Survey 5-Year Estimates". United States Census Bureau. Retrieved 2015-07-11.
- ↑ http://uselectionatlas.org/RESULTS
Further reading
- History of Mercer and Henderson Counties, Together with Biographical Matter, Statistics, Etc. Chicago: H.H. Hill and Company, 1882.
External links
- Henderson County Public Library District
- Henderson County Economic Development Corporation
- Henderson County Genealogy
- Henderson County Tombstone Project
Places adjacent to Henderson County, Illinois | ||||||||||
|---|---|---|---|---|---|---|---|---|---|---|
| ||||||||||
Municipalities and communities of Henderson County, Illinois, United States | ||
|---|---|---|
| City | ||
| Villages | ||
| Townships | ||
| Unincorporated communities | ||
| Footnotes | ‡This populated place also has portions in an adjacent county or counties | |
