Hardin County, Illinois
| Hardin County, Illinois | |
|---|---|
 Hardin County Courthouse in Elizabethtown | |
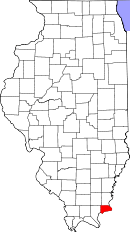 Location in the U.S. state of Illinois | |
 Illinois's location in the U.S. | |
| Founded | 1839 |
| Named for | John Hardin |
| Seat | Elizabethtown |
| Largest city | Rosiclare |
| Area | |
| • Total | 182 sq mi (471 km2) |
| • Land | 178 sq mi (461 km2) |
| • Water | 4.1 sq mi (11 km2), 2.2% |
| Population | |
| • (2010) | 4,320 |
| • Density | 24/sq mi (9/km2) |
| Congressional district | 15th |
| Time zone | Central: UTC−6/−5 |
Hardin County is a county located in the U.S. state of Illinois. According to the 2010 census, it has a population of 4,320,[1] making it the least populous county in Illinois. Its county seat is Elizabethtown.[2] Hardin County is located in the part of the state known as Little Egypt. Hardin County was named for Hardin County, Kentucky, which was named in honor of Colonel John Hardin, an officer in the American Revolutionary War and the Northwest Indian War.
History
Hardin County was formed in 1839 from Pope County. Additional area was later added from Gallatin County. Hardin County was named for Hardin County, Kentucky, which was named in honor of Colonel John Hardin, an officer in the American Revolutionary War and the Northwest Indian War. Hardin was murdered by Shawnee Indians while he was on a peace mission in 1792 for President George Washington, in what is now Shelby County, Ohio. In the 1790s and early 1800s, the Hardin County area, especially Cave-In-Rock, was notorious as a stronghold used by outlaws, bandits, river pirates, and counterfeiters.
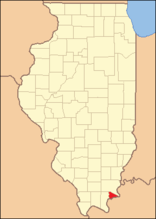 Hardin County between 1839 and 1847
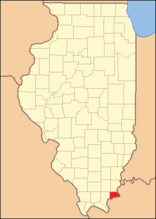 Hardin in 1847, when it was enlarged to its current size
Geography
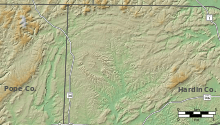
According to the U.S. Census Bureau, the county has a total area of 182 square miles (470 km2), of which 178 square miles (460 km2) is land and 4.1 square miles (11 km2) (2.2%) is water.[3] It is the second-smallest county in Illinois by area.
Hicks Dome (37°31′53″N 88°22′06″W / 37.53139°N 88.36833°W) is an interesting geological feature in Hardin County. Some believe the dome may be related to an ancient meteor or comet impact, part of the 38th parallel structures, which are a string of geological features running west to Kansas. This is thought to be a string of impact craters from a celestial body that broke apart before striking the earth. However, the Hicks Dome is underlain by ultramafic igneous rocks and igneous diatremes or breccia pipes. Most geologists now accept the theory that the older rocks at the center of the uplift are a result of this deep seated igneous activity. This activity may also have provided the fluorine in the fluorspar deposits in the region. Fluorspar, or calcium fluoride, was mined in Hardin County until the early 1990s.
Climate and weather
| Elizabethtown, Illinois | ||||||||||||||||||||||||||||||||||||||||||||||||||||||||||||
|---|---|---|---|---|---|---|---|---|---|---|---|---|---|---|---|---|---|---|---|---|---|---|---|---|---|---|---|---|---|---|---|---|---|---|---|---|---|---|---|---|---|---|---|---|---|---|---|---|---|---|---|---|---|---|---|---|---|---|---|---|
| Climate chart (explanation) | ||||||||||||||||||||||||||||||||||||||||||||||||||||||||||||
| ||||||||||||||||||||||||||||||||||||||||||||||||||||||||||||
| ||||||||||||||||||||||||||||||||||||||||||||||||||||||||||||
In recent years, average temperatures in the county seat of Elizabethtown have ranged from a low of 21 °F (−6 °C) in January to a high of 87 °F (31 °C) in July, although a record low of −22 °F (−30 °C) was recorded in January 1994 and a record high of 104 °F (40 °C) was recorded in August 2007. Average monthly precipitation ranged from 3.22 inches (82 mm) in October to 5.02 inches (128 mm) in May.[4]
Adjacent counties
- Gallatin County - north
- Union County, Kentucky - east
- Crittenden County, Kentucky - south
- Livingston County, Kentucky - southwest
- Pope County - west
- Saline County - northwest
Major highways
National protected area
- Shawnee National Forest (part)
Demographics

| Historical population | |||
|---|---|---|---|
| Census | Pop. | %± | |
| 1840 | 1,378 | — | |
| 1850 | 2,887 | 109.5% | |
| 1860 | 3,759 | 30.2% | |
| 1870 | 5,113 | 36.0% | |
| 1880 | 6,024 | 17.8% | |
| 1890 | 7,234 | 20.1% | |
| 1900 | 7,448 | 3.0% | |
| 1910 | 7,015 | −5.8% | |
| 1920 | 7,533 | 7.4% | |
| 1930 | 6,955 | −7.7% | |
| 1940 | 7,759 | 11.6% | |
| 1950 | 7,530 | −3.0% | |
| 1960 | 5,879 | −21.9% | |
| 1970 | 4,914 | −16.4% | |
| 1980 | 5,383 | 9.5% | |
| 1990 | 5,189 | −3.6% | |
| 2000 | 4,800 | −7.5% | |
| 2010 | 4,320 | −10.0% | |
| Est. 2017 | 4,046 | [5] | −6.3% |
| U.S. Decennial Census[6] 1790-1960[7] 1900-1990[8] 1990-2000[9] 2010-2013[1] | |||
As of the 2010 United States Census, there were 4,320 people, 1,915 households, and 1,234 families residing in the county.[10] The population density was 24.3 inhabitants per square mile (9.4/km2). There were 2,488 housing units at an average density of 14.0 per square mile (5.4/km2).[3] The racial makeup of the county was 97.3% white, 0.6% American Indian, 0.5% Asian, 0.3% black or African American, 0.1% Pacific islander, 0.3% from other races, and 0.8% from two or more races. Those of Hispanic or Latino origin made up 1.3% of the population.[10] In terms of ancestry, 26.5% were Irish, 23.8% were German, 10.4% were English, and 4.3% were American.[11]
Of the 1,915 households, 26.0% had children under the age of 18 living with them, 50.9% were married couples living together, 9.2% had a female householder with no husband present, 35.6% were non-families, and 31.7% of all households were made up of individuals. The average household size was 2.25 and the average family size was 2.78. The median age was 46.3 years.[10]
The median income for a household in the county was $27,578 and the median income for a family was $38,576. Males had a median income of $42,955 versus $26,683 for females. The per capita income for the county was $18,515. About 17.4% of families and 22.3% of the population were below the poverty line, including 37.4% of those under age 18 and 14.6% of those age 65 or over.[12]
Communities
City
Villages
Unincorporated communities
Precincts
- Battery Rock Precinct
- Cave-In-Rock Precinct
- East Monroe Precinct
- East Rosiclare Precinct
- McFarlan Precinct
- Monroe Precinct
- Peters Creek Precinct
- Rock Precinct
- Rock Creek Precinct
- Rosiclare Precinct
- Sellers Precinct
- Stone Church Precinct
- West Monroe Precinct
- West Rosiclare Precinct
Ghost towns
Notable people
- Logan Belt (1840-1887), outlaw leader of the Logan Belt Gang from Peters Creek
- James Ford (1775-1833), civic leader and secret criminal leader of a gang of Ohio River pirates and highwaymen
- Isaiah L. Potts (1784?-after 1843), tavern keeper of the notorious Potts Tavern who, allegedly, ran a gang of pirates and highwaymen
- Jennifer Rhodes (1947-), television and film actress from Rosiclare
- Sturdivant Gang, 19th century counterfeiters in Rosiclare
Politics
| Year | Republican | Democratic | Third Parties |
|---|---|---|---|
| 2016 | 77.0% 1,653 | 19.6% 420 | 3.5% 75 |
| 2012 | 65.9% 1,535 | 31.9% 742 | 2.3% 53 |
| 2008 | 58.8% 1,330 | 39.4% 892 | 1.8% 40 |
| 2004 | 61.6% 1,501 | 37.9% 923 | 0.5% 13 |
| 2000 | 51.8% 1,366 | 44.9% 1,184 | 3.3% 87 |
| 1996 | 30.2% 790 | 50.6% 1,323 | 19.3% 504 |
| 1992 | 31.0% 985 | 52.5% 1,665 | 16.5% 523 |
| 1988 | 53.3% 1,504 | 46.3% 1,308 | 0.4% 12 |
| 1984 | 58.3% 1,689 | 41.6% 1,205 | 0.2% 5 |
| 1980 | 55.3% 1,721 | 42.2% 1,314 | 2.5% 79 |
| 1976 | 46.2% 1,393 | 53.1% 1,602 | 0.7% 22 |
| 1972 | 62.5% 1,915 | 37.2% 1,140 | 0.2% 7 |
| 1968 | 51.8% 1,492 | 41.6% 1,199 | 6.7% 192 |
| 1964 | 44.7% 1,324 | 55.3% 1,639 | |
| 1960 | 57.0% 1,944 | 42.9% 1,465 | 0.1% 4 |
| 1956 | 56.9% 1,919 | 42.8% 1,444 | 0.2% 8 |
| 1952 | 55.8% 1,984 | 44.0% 1,563 | 0.2% 6 |
| 1948 | 55.5% 1,713 | 44.0% 1,358 | 0.5% 16 |
| 1944 | 59.3% 2,037 | 39.9% 1,370 | 0.9% 31 |
| 1940 | 53.8% 2,333 | 45.6% 1,974 | 0.6% 26 |
| 1936 | 50.1% 2,008 | 49.5% 1,984 | 0.5% 19 |
| 1932 | 48.4% 1,559 | 50.0% 1,610 | 1.7% 54 |
| 1928 | 64.4% 1,758 | 34.2% 933 | 1.5% 41 |
| 1924 | 49.1% 1,378 | 48.3% 1,358 | 2.6% 73 |
| 1920 | 61.5% 1,555 | 37.3% 943 | 1.2% 29 |
| 1916 | 51.7% 1,419 | 46.0% 1,264 | 2.3% 63 |
| 1912 | 43.6% 691 | 40.6% 644 | 15.8% 250 |
| 1908 | 52.5% 813 | 43.9% 680 | 3.6% 55 |
| 1904 | 49.1% 756 | 41.7% 642 | 9.2% 142 |
| 1900 | 46.3% 753 | 51.6% 839 | 2.1% 34 |
| 1896 | 46.2% 780 | 53.3% 900 | 0.6% 10 |
| 1892 | 43.1% 660 | 45.7% 700 | 11.2% 171 |
In its early history, Hardin County was opposed to the “Yankee” Republican Party and its Civil War against the South – with whom it was closely allied both culturally and economically. It did not vote for a Republican presidential candidate until Theodore Roosevelt’s 1904 landslide.
Since 1904, however, Hardin County has turned powerfully Republican. Like the nearby counties of Johnson, Massac and Pope, it managed to remain loyal to William Howard Taft during the 1912 election when the Republican Party was mortally divided. Hardin County would next be carried by a Democratic Presidential candidate in Franklin D. Roosevelt’s 1932 landslide victory, and not after that until Lyndon Johnson in 1964. The county did trend Democratic in the following three decades, actually voting more Democratic than the nation at-large between 1972 and 1996. Nonetheless, since 2000 Hardin County has followed the same political trajectory as Tennessee, Missouri, Kentucky, West Virginia and Appalachian regions of adjacent states, whereby the Democratic Party’s liberal views on social issues have produced dramatic swings to the Republican Party amongst its almost entirely Southern white population.[15] The past six Presidential elections have observed a swing totalling 79 percentage points to the GOP, with Hillary Clinton in 2016 receiving barely half the proportion of the worst-performing Democrat from before 2010.
See also
References
- 1 2 "State & County QuickFacts". United States Census Bureau. Archived from the original on July 11, 2011. Retrieved July 5, 2014.
- ↑ "Find a County". National Association of Counties. Retrieved 2011-06-07.
- 1 2 "Population, Housing Units, Area, and Density: 2010 - County". United States Census Bureau. Retrieved 2015-07-11.
- 1 2 "Monthly Averages for Elizabethtown, Illinois". The Weather Channel. Retrieved 2011-01-27.
- ↑ "Population and Housing Unit Estimates". Retrieved June 9, 2017.
- ↑ "U.S. Decennial Census". United States Census Bureau. Retrieved July 5, 2014.
- ↑ "Historical Census Browser". University of Virginia Library. Retrieved July 5, 2014.
- ↑ "Population of Counties by Decennial Census: 1900 to 1990". United States Census Bureau. Retrieved July 5, 2014.
- ↑ "Census 2000 PHC-T-4. Ranking Tables for Counties: 1990 and 2000" (PDF). United States Census Bureau. Retrieved July 5, 2014.
- 1 2 3 "DP-1 Profile of General Population and Housing Characteristics: 2010 Demographic Profile Data". United States Census Bureau. Retrieved 2015-07-11.
- ↑ "DP02 SELECTED SOCIAL CHARACTERISTICS IN THE UNITED STATES – 2006-2010 American Community Survey 5-Year Estimates". United States Census Bureau. Retrieved 2015-07-11.
- ↑ "DP03 SELECTED ECONOMIC CHARACTERISTICS – 2006-2010 American Community Survey 5-Year Estimates". United States Census Bureau. Retrieved 2015-07-11.
- 1 2 3 4 5 6 7 8 9 10 11 12 13 14 15 16 "Hardin County Histories".
- ↑ http://uselectionatlas.org/RESULTS
- ↑ Cohn, Nate; ‘Demographic Shift: Southern Whites’ Loyalty to G.O.P. Nearing That of Blacks to Democrats’, New York Times, April 24, 2014
External links
| Wikimedia Commons has media related to Hardin County, Illinois. |
Places adjacent to Hardin County, Illinois | |
|---|---|
Municipalities and communities of Hardin County, Illinois, United States | ||
|---|---|---|
| Cities | ||
| Villages | ||
| Precincts | ||
| Unincorporated communities | ||

| Counties |  | |
|---|---|---|
| Mid-sized cities (25,000+) | ||
| Small Cities (10,000-25,000) | ||
| Small Cities (5,000-10,000) | ||
| Interstates | ||
| Airports/Military bases |
| |
| Universities | ||
| Colleges | ||
| Sports teams based in the Southern Illinois | ||